Trap Set at the Top? Sensex Sell-Side Objective = 81,886Sensex is currently trading at 82,220 and showing early signs of a potential sell-side move based on Smart Money dynamics. After grabbing buy-side liquidity above recent highs, we’ve now entered a distribution phase.
Price has shown rejection from a premium zone, and a market structure shift is forming on lower timeframes — all pointing toward a probable move to the sell-side liquidity pool near 81,886.
This zone aligns with Smart Money's objective to tap resting liquidity below recent swing lows before any major reversal. Caution is advised for longs. Wait for confirmation if you're planning to ride the short move with the institutions. 🎯💼
Sensexsignal

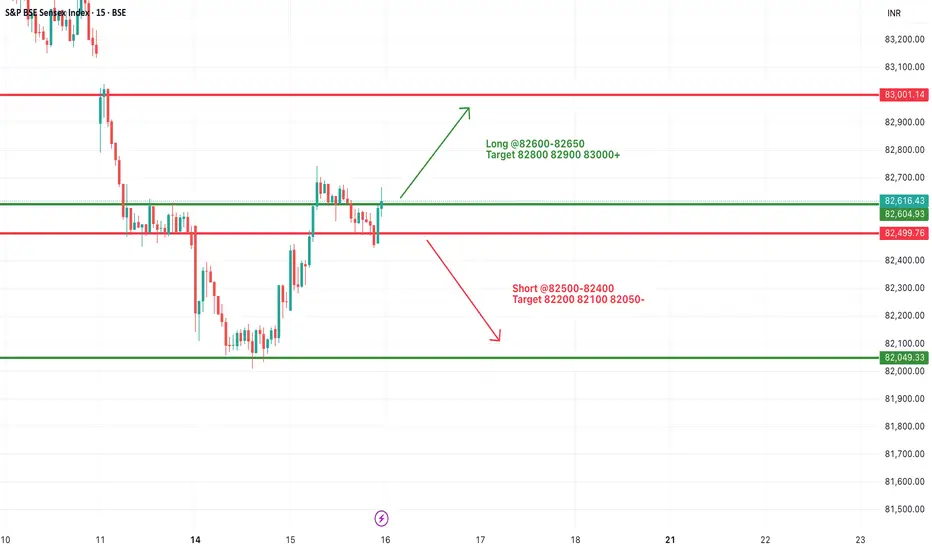
#SENSEX Intraday Support and Resistance Levels - 16/07/2025Sensex is expected to open flat near the crucial 82600–82650 resistance zone, which has acted as a turning point multiple times recently. A sustained move above this range may trigger bullish momentum toward 82800, 82900, and even 83000+. This move would indicate a positive continuation after the recovery seen from recent lows.
However, if the index faces rejection around 82600–82650, it may once again slip below 82500, opening the door for short-side opportunities with targets at 82200, 82100, and 82050. This region has seen a lot of price action over the last few sessions, so volatility may be higher.
#SENSEX Intraday Support and Resistance Levels - 15/07/2025Sensex is likely to kick off the session with a gap-up opening around the 82500 level, reflecting early bullish momentum. If this initial strength holds and the index begins to build above the 82600–82650 zone, it could signal the start of a recovery leg toward higher resistance levels at 82800, 82900, and potentially 83000+. Sustained action above 82650 may encourage momentum traders to chase strength during the day.
However, the 82500–82650 range will act as a battleground. Failure to defend this zone could invite selling pressure. A breakdown below 82500 may expose the index to intraday weakness, opening downside targets at 82200, 82100, and even 82050. In this case, expect volatility to increase near support levels.
Traders should approach with a flexible strategy—watching for breakout confirmation above 82650 or signs of reversal pressure below 82500. Today’s early range could set the tone for the entire session.

#SENSEX Intraday Support and Resistance Levels - 14/07/2025Sensex is likely to open slightly gap-down, reflecting weakness carried over from the previous session. The index is currently trading near the 82450 zone. A breakdown below the 82400 level may trigger further downside movement, with potential support targets at 82200, 82100, and 82000. This zone should be monitored closely for continuation or reversal.
On the upside, any strong recovery above the 82600–82650 level could push the index higher, with resistance targets at 82800, 82900, and 83000+. Sustaining above this range may indicate buying interest returning in the market.
If Sensex spikes toward the 82950–83000 zone and faces resistance, a reversal from there could create shorting opportunities with targets at 82800, 82700, and 82600. However, a clear breakout above 83000 would negate this short setup and shift the bias to bullish.
The index is currently in a consolidation zone, and price action around 82600–82400 will be critical to determine the day’s direction.

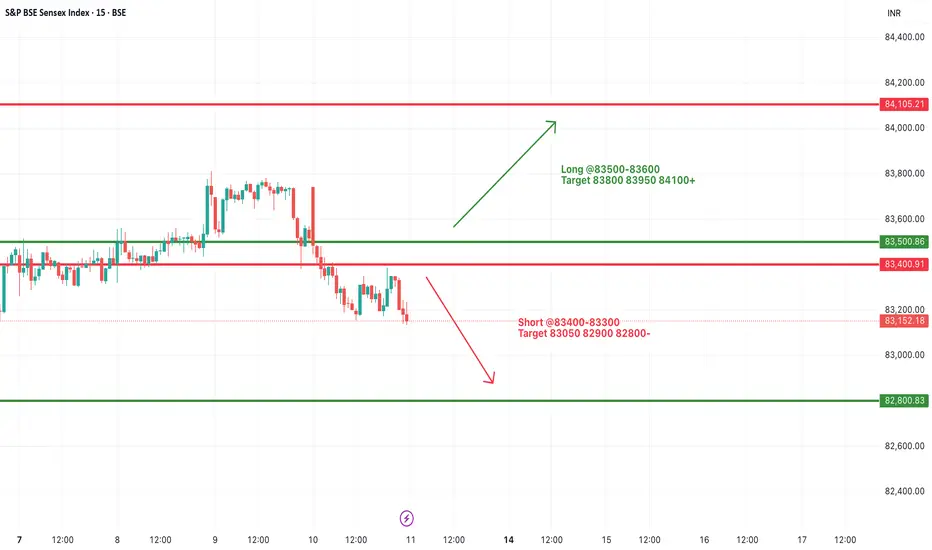
#SENSEX Intraday Support and Resistance Levels - 11/07/2025Sensex is expected to open flat after a consolidation phase and weak closing in the previous session. The index is currently hovering near the support zone of 83400–83300. If Sensex breaks and sustains below this level, further downside may unfold toward 83050, 82900, and 82800. This level should be watched closely as a decisive break may trigger increased selling pressure.
On the upside, a recovery and breakout above 83500–83600 could indicate a potential reversal. Sustaining above this zone can lead the index to rally toward 83800, 83950, and possibly 84100+. However, the price action near this resistance band will be crucial for any confirmation of bullish strength.
Overall, the sentiment remains weak with a bearish bias unless a strong breakout happens on the upside. Traders should remain cautious and focus on these breakout levels for intraday opportunities with proper risk management.
#SENSEX Intraday Support and Resistance Levels - 08/07/2025Sensex is expected to open flat today around the 83400 zone, showing no major gap or volatility at the open. The index continues to move in a tight consolidation range between 83300 and 83500. A decisive move outside this zone is likely to give direction to the market.
If the index sustains above 83500, it could lead to a bullish breakout, pushing prices towards 83700, 83800, and eventually 83950+. This breakout may indicate fresh buying interest after a prolonged sideways phase.
However, if Sensex breaches the 83300 level on the downside, it could trigger selling pressure with targets at 83050, 82900, and 82800-. Traders are advised to wait for a clear breakout or breakdown before entering any trades, as the current zone lacks momentum.

Sensex Intraday Analysis on May 12, 2025A bearish intraday trend is likely on May 12, 2025. The Sensex may find support at 79,067 (Support 1) and 78,250 (Support 2).
However, gap openings in either direction could invalidate this analysis. Traders are advised to rely on technical indicators before taking positions. Effective risk management remains essential.

Sensex Analysis for Tomorrow 18/10/24Sensex Analysis for Tomorrow 18/10/24
Pls Use Brokers chart for live price updation in Sensex
Yellow Zone is major Resistance Level.
All The important are given with horizontal black line.

BSE Sensex Important levels we are likely to see some corrections , I have marked some imp levels based on trend lines , Demand supply and FIb Levels .

Sensex (SENSEX) AnalysisFollow and Boost the post, Thanks.
Based on the 1-hour chart for the S&P BSE Sensex Index, here is the summary and analysis:
Key Levels:
- Current Price: 73,885.60
- Retracement Levels:
- 0.5 Retracement: 75,537.72
- 0.618 Retracement: 75,947.52
- Targets:
- Target 1: 75,936.42
- Target 2: 77,260.70
- Target 3: 79,420.46
Chart Analysis:
1. Retracement Phase: The chart shows the Sensex Index in a retracement phase from a recent high, moving towards lower levels.
2. Support and Resistance Levels: The chart indicates potential support around the 0% retracement level at 73,801.25 and resistance levels at the key Fibonacci retracement levels.
3. Ascending Channel: The index appears to be trading within an ascending channel, indicating a general upward trend despite the current retracement.
Potential Scenarios:
1. Bullish Scenario:
- If the index finds support around the current level (73,801.25), it could start rebounding towards the upper targets.
- The first significant resistance to watch for is the 0.5 retracement level at 75,537.72, followed by the 0.618 retracement level at 75,947.52.
- Breaking above these levels could lead the index towards Target 1 (75,936.42), Target 2 (77,260.70), and eventually Target 3 (79,420.46).
2. Bearish Scenario:
- If the index fails to hold the support around 73,801.25, it might continue to fall towards the lower boundary of the ascending channel.
- Further decline could lead to testing the lower support level around 72,081.92.
Trading Strategy:
1. Watch for Support: Monitor the price action closely around the current level (73,801.25). Look for signs of a reversal or strong buying interest at this level.
2. Buy Position: Consider entering a long position if the index shows a strong bounce from the support level with increasing volume and bullish candlestick patterns.
3. Stop-Loss: Place a stop-loss slightly below the support level at 73,801.25 to manage risk in case of a further decline.
4. Target: Aim for the targets identified (75,936.42, 77,260.70, and 79,420.46) for the long position.
Conclusion:
- The S&P BSE Sensex Index is currently in a retracement phase within an overall ascending trend. The key support level to watch is around 73,801.25. If the index finds support and rebounds, it could move towards the identified targets. Conversely, a break below the support level could lead to further downside. Monitoring the price action and volume around these key levels will be crucial for making informed trading decisions.

Ultratech heading down .?Is Ultratech heading down after touching all time high. ?
This stock has be consolidating from past 2-3 months and now finally gave the breakdown with good volume , But wait is it sustainable.?
10000 now looks like strong resistance for this stock and looks like it will further go downwards till 9316 and 9040 as per the fibs retracement level . But over all stock is very bullish
Disclaimer : This post is meant for education purpose do your own research before risking your account

how many agree this was my observation kindly give ur thoughts as what is your take on this formation
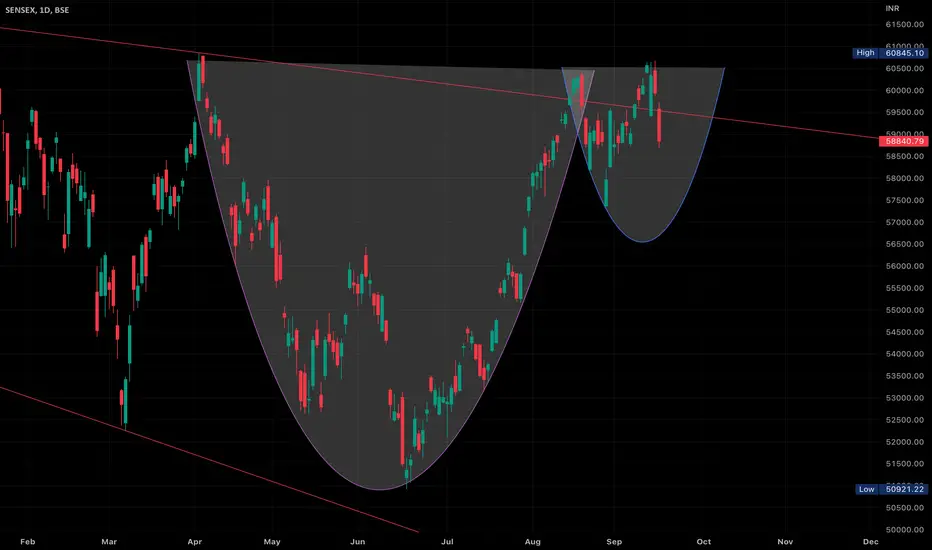
SENSEX GRAPHThis graph is of the Sensex, in which there is analysis from the daily frame for the last few days, in which it is known that it was falling down for a few days.Now after getting support, it will return to its full supply zone by next month.


SENSEX : An overviewSensex broke the uptrend line and broke down and is currently hanging between Support and resistance. Breaking the support box (Red rectangle) may cause a sell-off Towards the lower Targets.

SENSEX is Falling 01/02/2021as we can see
we have bearish Divergence with MACD Signal and MACD Histogram and it is at the end of a bullish trend which is happening post corona Pandemic and it can be interpreted as trend reversal and Distribution time
now it can be the time for some correction and retraces
we have analyzed the daily Timeframe and used Price Action Strategy to find the accumulation zones
these areas are also having confluences with Fibonacci retracement levels which are good areas to target or enter
we may have a small bullish Spike but the overall scenario is bearish from now onwards
