IXIC Nasdaq Long Term Chart: Danger approaching 50 points awayIXIC Nasdaq Composite long term chart showing danger approaching for long positions just 50 points away. Get ready to close down longs and prepare to short as per comment
Set-up


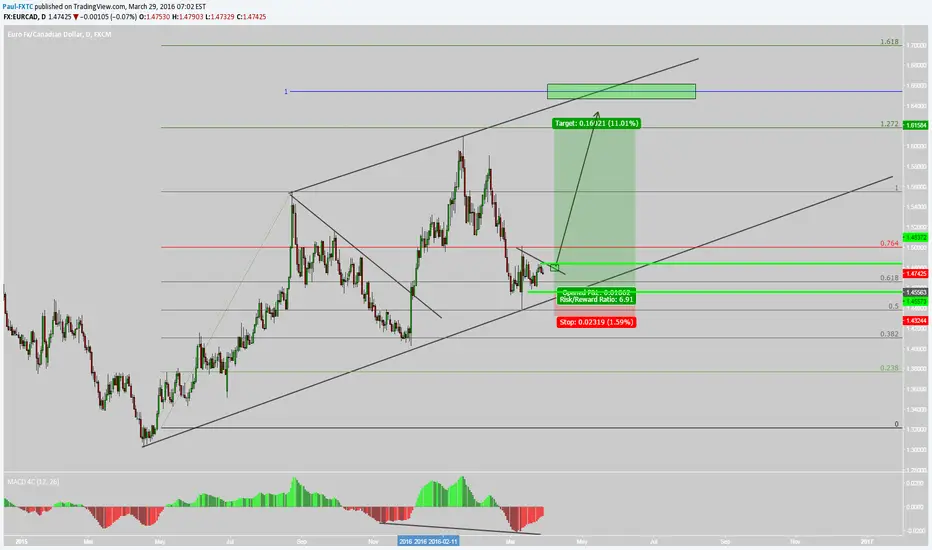
EURCAD NICE BUY SET UP EUR CAD
Tipo: BUY
TF : D 1
ORDEN PENDIENTE AL PRECIO: 1.455 - 1.485
STOP : 1.435
Take Profit : TP1 1.52 - TP2 1.56 - TP3 1.60


AUD/USD: trade to start week #11 Lots of confluences for this trade to get SHORT as u can see from the chart:
Resistance
Fib level
High test candle
Deceleration
50 ema bounce

NZDCAD - Selling Set Up - CAD Strong at this time !NZDCAD - Selling Set Up - CAD Strong at this time !


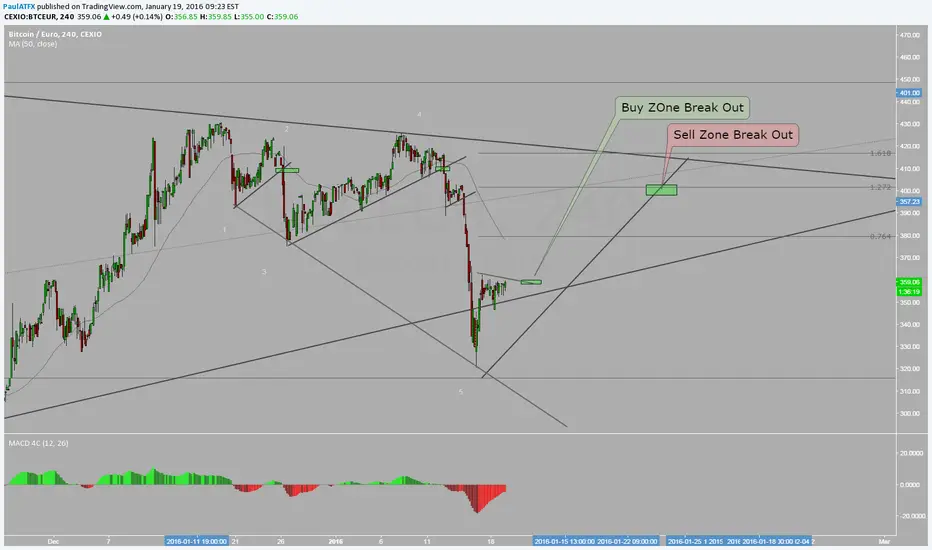
BTCEUR New Set UpLast time i saw a set up but it doesnt triger , lets see if this Set Up Breaks out nicely


CHF/JPY: So many confluences for going short!Confluences:
1/ with the recent formed downtrend
2/ Broke TL + retest
3/ Tested the 130.000 weekly resistance
4/ Bounced of the 50% fib.
5/ high test, followed by inside bar set up, followed by another high test
6/ 50 & 60 EMA's bounce

GBPUSD CABLE SHORT LONG TERM BIG DROP COOKING £$Drawn S/R on W1 very strong levels, Fib retrace shows 38.2% reversal occuring CCI Dropping. First target 23.6% - Second 0% - Stop on kumo support but will we test it at all? who knows :)
