USDCADUSDCAD 3h chart possible longs, after we saw a break out in the moving average, its above our mid trend line and also the fibonacci levels are favorable and confirm our long entry.
Setupoftheday

USDJPYRisky trade for ujsdjpy since there are chances for a doble top, but we expecting a break out and cacht a possible spike to the bullish side.
The reasons are that ujdjpy is above the mid trendline, and also above the moving average. We can see also that the fibonacci level of 23% acts as a support level giving USDJPY more probability of a spike out

BTCUSD possible bullish scenarioPossible longs for the btcusd pair, it started rejecting the middle trend line showing posible bullish signs. We place the long position at the middle of the trend line, believing that it will start rejecting at that zone till our tp. Risk Reward trade of 3.

15 Minute Bollinger Band Strategy Here we use a 15 Minute chart with Bollinger bands set to 20 with a standard deviation of 2.
First we look for an established trend direction, once that has been found we apply our bands, set the deviation for 2 and wait for the price to test or slightly break that lower band. (test/break of higher band in the case of a down trend and sell order)
Here we have highlighted these tests/breaks with a green circle. The blue arrow represents a 200 point gain on each trade. Once the trend has begun to level out the opportunity is extinguished and we move on to the next chart.
Tips/Rules
Don't trade against the trend! eg sell at a high break/test of band on an uptrend!
Keep stops loss tight - if the break and trade entry occurs, but the price keeps moving against you time to get out!
Stay cautious in a sideways market (we will post a strategy for that soon too)
If the bands widen drastically that could indicate high volatility and potential trend change.
Be aware of new releases and high importance data when entering set up.
Good luck!
Orion Fx Trading Team

Trade Set up 31130.05 if 15 min candle closes below this then short banknifty. Best is to sell calls,2nd best short future 3rd best is to buy 31000 pe.

SPX's Deviation from 200D MA since inception's day 1957Hey guys what's up
I am including all the data here so you can copy, share or edit it on Microsoft apps. feel free to reuse of redistribute all
my work to our trading view community or out side it.
March's low is most likely a fresh new cycle to say the least " believe it or not" with out bias you would come to this conclusion
one way or another and you should accept if before time proof that for you. (even if we get big corrections this is how financial markets behave : -) )
Moreover i probably did allot of mistakes here and there, missed allot of important details ... but i did everything with most to my ability : -)
*************************************
SUMMERY: (RED #s)
During each new cycle we usually get the higher & highest
numbers. the more we go into the cycle the more
the deviations get lower. Moreover, we do get
allot of NOT worthy to mention pullbacks even though
we have higher number of deviation !!! .
--------------So, no GOLDEN RULE here at all.---------------
wish you all the best.
**************************************************************
SUMMERY: (BLUE #s)
Deviation below 200d MA is not that common on a daily
chart, and i assume it would be more rare on a weekly
chart. (5 r single digits-4r20s—9 r teens-1is30s-2r40s-
1is50( Most extremes since inception r (54-47-46-32)
------------"40 % 10-19"/"22% below 10"/"8% 20s"---------
BUY BUY BUY BBUY BUY BUY BUY BUY BUY BUY BUY
-----------WHEN YOU SEE THOSE "3" EXTREEMS.-------------
Deviation below 200d MA.
-8
-25.37
-6.08
-19.91
- 7.41
-32.88
-9.94
-46.18
-15.63
-22.66
-11.51
-11.40
-27.48
-14.60
-12.49
-47.69 2000
-54.77 2007
-16.48
-9 %
-12.21 %
-15.13
-27.81 covid-19
***************************************************************************
SUMMERY: (GREEN #s)
Some of the biggest corrections/crashes/crisis
came from small percentages of deviation from
SPX's price !!! That's a key note to be observed
closely. In Contrary to the general view that the
more we go the more likely we have a stronger crash
---------- DATA says this is WRONG!!!---------------------
Since the inception of Standard & Poor's 500 :
--------------------------------------------------------
11.79 Covid -19 crash
6.4 % 2018 correction
3.45 % 2015 correction
12.21 % 2011
6.95 % 2007 crisis
6.11 % 2000 crisis
14.95 % 1999 correction
17 % 1998 correction
5.68 % 1994 10 % pullback
7.20 % 1990 correction 20 %
17.92 % 1987 crisis
20 1980 correction
13 % 1980 correction
8 % 1976 big Correction
9.97 % 1973 big crash
11.85 % 1968 big correction
5.96 % 1966 big correction
8.47 % 1962 big correction
8.62 1959 big correction
-----------------------------
we have a range of 20%- 3.45 %
------------------------------------------------------------------------------------------------------------------------------------------------------------
Summery : (Orange)
the largest 15 crashes in the history of SPX since
inception has no relation what so ever. 53 % of
corrections came from double digits % deviation!!!
47% of correction came from single digit deviations
The largest crashes since 1957 (inception):
----------------------------------------------------
11.79 35.27 covid-19 crash
6.45 20.23
12.21 21.59
6.95 57 2007 crash
13.18 50 2000 crash
14.69 22.52
7.2 20.32
17.92 36
20.39 28.08
13.76 21.58
8.02 20
9.97 52.08 big crash 73
11.85 37.12 big crash 1969
5.96 23.69 big crash 1966
8.74 29.26 1962 big crash
------------- So it is 50-50 chance !!!!!----------------
**********************************************************************
All Deviation above 20 + except for few where at
the beginning of new cycle. In another word they
came all after big crashes/corrections. Therefore
getting these high numbers of deviation is
confirming YES confirming that we are beginning
a new cycle.: 18 % of these double digits pullbacks.
82 % of these are a single digit pullback.
After March's low we r getting high #s(new Cycle)!!
All Deviation above 20 +
-----------------------------------
20.63 6.55 Beg.
20.81 5.57 Beg.
21.22 7.18
20.49 4 N.wm Beg. 1982
20.63 3.27 beg. 1982
20.85 6.24 Beg. 1982
23.78 9.03 Beg. 1982
20.39 28.08
21.23 15.54 Beg.
23.90 5.52 Beg.
20.15 4.69 Beg
*******************************************************************
Summery: All deviations between 15-19.99
20 % of these we get a double digit pullback
80 % is a shocking single digits pullback !!!!!
All deviation between 15-19.99
--------------------------------------
16.17 10.37
16.54 7.17
17.11 5.07 N.WM
16 13.07
19.76 6.49
16.53 10.29
15 6.03
15.97 6.43
15.46 3.5 N.WM
16.82 3.47 N.WM
17.92 36
19 9.33
16.23 9.12
18.87 4.86
19.77 5.05
16.78 7.63
18.14 7.79
18.31 15.47 Beg.
19.69 3.60 Beg.
*****************************************************************
Summery: All deviation between 10-14.99
36 % of the time we will get double digit pullbacks
up to 64 % of the time single digits pullbacks.
Therefor this area is favoring small dips !!!!
All deviation between 10-14.99
Deviation pullbacks
13.42 8.9
11.79 covid-19 crash 35.27
13.91 11.84
13.81 7.58
12.24 10.96
12.21 21.59
12.35 17.16
14.70 9.26
11.28 8.55 Beg.
14.14 5.35 Beg.
13.18 2000 crash
14.13 13.13
14.69 22.52
11.76 7.39
13.95 5.96 N.WM
10.79 11.04
12.77 3.95 N.WM Beg.
13.99 2.59 N.WM Beg.
14.57 14.57 N.WM Beg.
14.01 5.59 N.WM Beg.
13.89 9.26
10.80 4.76 N.wm Beg.
10.93 10.14
10.69 8.28
10.14 3.18 N.wm
12.90 4.03 N.wm
13.76 21.58
13.79 15.15
10/13/13 6/6/4.70 N.W
11.85 37.12 big crash 1969
13.87 8.36 Beg.
12.39 5.06 Beg.
11.83 4.41 Beg.
13.86 4.42 Beg.
14.97 3.36 Beg.
10.82 1.86 Beg.
Summery: 36 % of the time we will get double digit pullbacks up to 64 % of the time single digists pullbacks.Therefor this area is favoring small dips !!!!
***********************************************************************
************************************************************************************************************************
Summery: All Deviations between 5-9.99. 28 % of
them double digits pullbacks 72% single digits pullbacks.
Either, my 42 sample is not enough and in this area i am
wrong, or things get missy around these numbers !!!!!!!
All Deviations between 5-9.99
Deviation pullbacks
6.94 6.94
8.89 6.87
6.75 7.64
6.45 20.23
8.92 8.87
6.32 4.76
6.99 5.16
6.78 9.88
9.23 6.12
9.44 8.90
6.95 2007 crash
7.67 12
9.02 6.69
5.75 8.09
6.95 7.32
9.89 10.35
5.68 9.70
7.7 5.36
9.22 6.75
7.2 20.32
8.74 11.30
7.40 7.43 N.wm Beg.
8.46 14.68
9.69 11.73
9.06 4.05
8. 9.97 52.08 big crash 73
8.23/9/10 6.23/6.18/6.55 02 20
8.89 8.50
9.72 4.66
5.96 23.69 big crash 1966
6.32 4.41
6.16 10.94
6.37 4.87
8.90 4.19
8.69 4.47
8.98 2.83 N.wm
8.40 7.59
8.74 29.26 big crash 62
8.69 3.89
8.62 9.32
************************************************************************
Summery: All deviation below 5 % off 200D MA
is just 50 % double digits % 50 % single digits
pullbacks.
All deviation below 5 :
2.66 14.50
3.45 12.28
4.94 6.16
3.7 6.71
4.83 3.96
4.65 6.75
4.62 11.35
4.16 13.63 big crash
***********************************************************************
******************************************
All raw data
Total of most extended deviation
since the inception of S&P 500 in
1957 :
----------------------------------------
Deviation----pullback/corrections
?????????????????????????????????
13.42 8.9
16.17 10.37
11.79 covid-19 crash 35.27
6.94 6.94
8.89 6.87
6.75 7.64
6.45 20.23
8.92 8.87
13.91 11.84
6.32 4.76
2.66 14.50
3.45 12.28
6.99 5.16
6.78 9.88
9.23 6.12
13.81 7.58
9.44 8.90
12.24 10.96
12.21 21.59
12.35 17.16
14.70 9.26
20.63 6.55
20.81 5.57
6.95 2007 crash
7.67 12
9.02 6.69
5.75 8.09
4.94 6.16
6.95 7.32
11.28 8.55 Beg.
14.14 5.35 Beg.
6 2000 crash
13.18 2000 crash
9.89 10.35
14.13 13.13
16.54 7.17
14.69 22.52
17.11 5.07 N.WM
11.76 7.39
16 13.07
19.76 6.49
16.53 10.29
13.95 5.96 N.WM
10.79 11.04
15 6.03
12.77 3.95 N.WM Beg.
13.99 2.59 N.WM Beg.
14.57 14.57 N.WM Beg.
5.68 9.70
7.7 5.36
3.7 6.71
4.83 3.96
9.22 6.75
4.65 6.75
14.01 5.59 N.WM Beg.
15.97 6.43 N.WM Beg.
7.2 20.32
8.74 11.30
13.89 9.26
15.46 3.5 N.WM
16.82 3.47 N.WM
10.80 4.76 N.wm Beg.
7.40 7.43 N.wm Beg.
17.92 36
19 9.33
10.93 10.14
16.23 9.12
18.87 4.86
19.77 5.05
21.22 7.18
12.48 5.58
10.69 8.28
11.21 canceled this one too close
10.14 3.18 N.wm
12.90 4.03 N.wm
8.46 14.68
16.78 7.63
20.49 4 N.wm Beg.
20.63 3.27 beg.
20.85 6.24 Beg.
23.78 9.03 Beg.
16.05 canceled with in a crash
20.39 28.08
18.14 7.79
13.76 21.58
9.69 11.73
9.06 4.05
13.79 15.15
4.9 canceled within a crash
8.02 20
10/13/13 6/6/4.70 N.W
21.23 15.54 Beg.
23.90 5.52 Beg.
9.97 52.08 big crash 73
8.23/9/10 6.23/6.18/6.55 N.W
18.31 15.47 Beg.
19.69 3.60 Beg.
20.15 4.69 Beg.
11.85 37.12 big crash 1969
4.62 11.35
8.89 8.50
9.72 4.66
13.87 8.36 Beg.
5.96 23.69 big crash 1966
6.32 4.41
6.16 10.94
6.37 4.87
8.90 4.19
8.69 4.47
8.98 2.83 N.wm
8.40 7.59
12.39 5.06 Beg.
11.83 4.41 Beg.
8.74 29.26 62 big crash
8.69 3.89
13.86 4.42 Beg.
14.97 3.36 Beg.
10.82 1.86 Beg.
4.16 13.63 big crash
8.62 9.32
15 Beg.
15 Beg.
15 Beg.

EUR/USD Possible bearish or bullish Momentum.We could expect a breakout of the symmetrical triangle with a continuous bearish momentum to at least Price 1.21241 or bullish momentum to at least price 1.22439.

LINK/USDT - new market cycle - potential 77% tradeHello, Traders!
LINK started a new market cycle and now it is going through a correction phase after the first growth phase.
The main zone of buyers' interest is in the range of $9.75-10.95
Entry in the trade can be made in two parts:
near the Fibonacci correctional level of 0.618 - $10.74 in case the price enters the Buyers' Interest zone;
near the Fibonacci correctional level of 0.786 - $9.20 if the price breaks below the Buyers' Interest Zone.
You can set SL under 8.38
The target price levels would be: $12.86 $14.31 $17.33 and in the case of a medium-term trade it is $19.70
Watch out for the market and good luck!
P.S. This is not a piece of financial advice but only a trade I would be following myself

OMG- Semi-bullish zoneI expect near-term consolidation as there are some short-term resistance lvls that need to be cleared. Looking for momentum and volatility to pick up soon.
Steady uptrend and the cluster of technical supports below current price lvl indicate that OMG is one breakout away from turning fully bullish.
If BTC retraces again, it will be a perfect opportunity to accumulate some OMGS. Scale in slowly if you intend to market buy.
Just my two cents. Not investment advice.

NAS100 FOR YOU!!price formed a channel last week, after using my fib i expect price to get to my resistance level then continue to bearish move !!.. note wait for price to get to that resistance first before you think of taking the sell decision

NZDUSD broke the trendlineAs i said earlier the price broke the trendline after making DOuble top now waiting for sell opportunity after Retest of the Resistance area

Bitcoin Trade setup (6.21% gain, 6,42 RR)Drop a like if this helps you out :)
Trade Idea: Long retest of support of 11500 as price broke supply resistance on a daily time frame
Reasons for trade:
1. Just broke daily supply resistance with volume expansion
2. Daily 89 SMA sitting at 11 500 ( extra support level )
3. previous resistance should now be support zone
Trade confidence: 7.5/10
RR: 6,42 with 6,21% gain
Warnings: if traditional markets decide to turn down Bitcoin will follow

BCH trade setup +5.5RRead the notes on the chart. Trade only gets initiated on a break above those certain levels.

BCH Trade Idea Trade setup #1 for the week. Will look to post more throughout the week. Will update each post on whether it was successful or not.
Reasons for trade: Bullish divergences on 1H all the way up to 4H. Currently sitting on support.
Trade confidence: 6/10

Bitcoin Trade IdeaTrade setup #2 of the week
Reasons for entry: price is bouncing off support, Stochs look ready to spring up. Looking for some bullish relief going into Monday morning
Trade confidence: 6/10

ETH trade setup Trade Idea: ETH short down to range lows
Reasons for trade: This trade is mainly as a hedge for my other longs (see previous charts for BCH and BTC).
Shorting previous support that is now acting as resistance
Trade confidence: 4/10
RR: 5.9

Deciding point for Bitcoin Bitcoin seems to be in a ascending wedge pattern. This could break either way but whichever way it does break I think will set the trend for the coming week.


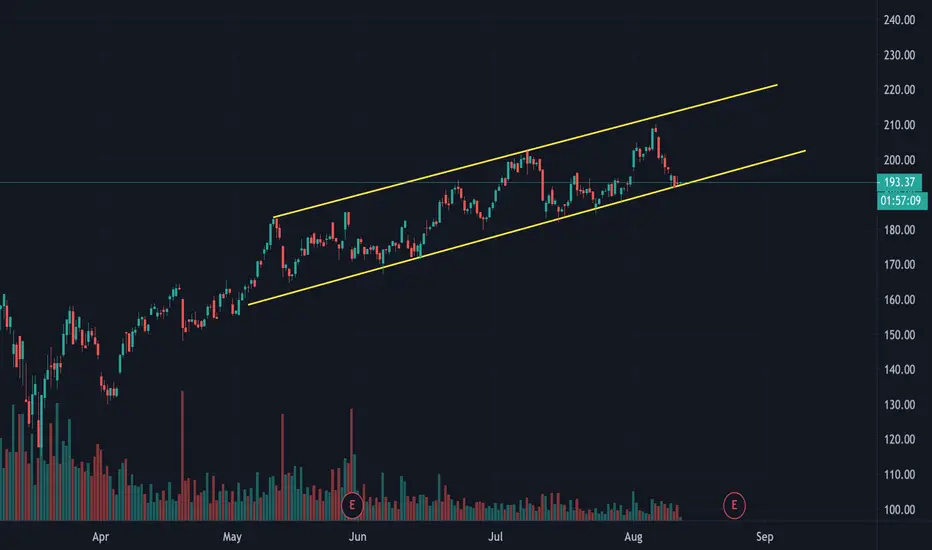
CRM - 10.18% Potential Profit - Uptrend CorridorStrong level of support, confirmed multiple times over the past 5 months in an uptrend corridor.
Price bouncing on the support line.
- Historical Uptrend
- RSI + Stoch (NA)
- MACD (NA)
Suggested Entry $193.73
Suggested Stop Loss $214.69
Target price $189.47
Note that I tend to adjust stop losses in order to secure profits early and preserve capital. This means that the target price is going to be achieved as long as there are no strong pullbacks that trigger my new adjusted stop loss.
TSLA - 10.97% Potential Profit - Corridor BreakoutLevel of confidence on this trade is Low/Mid and I will wait for a few minutes after the market opens to determine whether I'm entering with a Buy Stop or a Buy Limit order.
Corridor breakout. We are out of correction and it could now push up to +$2000.
Target price set at new Resistance bounce.
- 5-month uptrend
- RSI and STOCH above 50
- MACD above Signal
Suggested Entry $1845.75 (Buy Stop) or $1802.96 (Buy Limit)
Suggested Stop Loss $1778.69
Target price $2048.38
Note that I tend to adjust stop losses in order to secure profits early and preserve capital. This means that the target price is going to be achieved as long as there are no strong pullbacks that trigger my new adjusted stop loss.

ATRS - 10.09% Potential Profit - Bullish PennantApproach this with extra-care, allocate less than usual, and take profit fast.
This is a penny stock and a high-risk / high-reward scenario.
Clear 6-month uptrend Support with a Bullish Pennant formed within.
Target price set at a new potential resistance line.
I suggest entering a Buy Stop order. If the stop price is not triggered, I wouldn't try to chase a dead-cat bounce. Keep Stop Loss tight and adjust accordingly to protect profits.
- 6-month uptrend
- RSI + Stoch above 50
- MACD above Signal.
Suggested Entry $3.10
Suggested Stop Loss $2.96
Target price $3.42
Note that I tend to adjust stop losses in order to secure profits early and preserve capital. This means that the target price is going to be achieved as long as there are no strong pullbacks that trigger my new adjusted stop loss.

FTV - 13.01% Potential Profit - Ascending TriangleUptrend Support with a bullish pennant forming about to breakout.
Target price set at new uptrend resistance line.
- 5-month uptrend support
- RSI and STOCH well above 50
- MACD well above Signal
Suggested Entry $74.36
Suggested Stop Loss $72.33
Target price $83.89
Note that I tend to adjust stop losses in order to secure profits early and preserve capital. This means that the target price is going to be achieved as long as there are no strong pullbacks that trigger my new adjusted stop loss.
