The Edge Of The Fork - The Joker In Your PocketWOW!
\ \ First of all, I want to say THANK YOU for all the boosts, follows, and comments. You guys & gals give me the energy to continue this journey with you.\ \
Today, I want to show you that what we’ve learned with horizontal lines can also be applied to "Medianlines," or Forks.
Listen, I don’t want you to blow your brain with all the rules.
Not at the beginning of this journey, and not later on either.
Don’t ask yourself:
* when to use which Fork
* which swing to measure
* when to trade
* where to set your stop
* what if... bla bla bla
That’s not fun — that’s stress.
I don’t like stress — nobody does.
So let’s just chill and have fun here.
That’s my personal reason for doing all this Trading thing. I want to have fun — the money will take care of itself, just like the destination of a trail takes care of itself, as long as I keep putting one foot in front of the other. And that’s simple, right?
So let’s do it exactly the same way.
Just simple steps, connecting some dots, and BAM! — You’re there before you even know it §8-)
\ Let’s jump to the chart:\
Today, you’ll find out why Medianlines/Forks are a cousin of the horizontal Channel — but NOT the same.
Where are they different?
Forks are different because they’re capable of projecting the most probable path of price. And that’s a HUGE difference.
Yes, you can apply the full rule set of Forks to a horizontal Channel.
But the Channel CANNOT project the most probable path of price.
I hear you, I hear you: "No one and nothing can foresee the future. How is it even possible that Forks can?"
\ Here’s why:\
There’s a thing called "Statistical Importance." And it means that if something happens very often in the same way, we have a higher chance of seeing the same behavior again in the future.
And that’s what the inventor, Allan Andrews, discovered — and he created the rules around his findings.
\ A high probability that price will move in the direction of the projected path, as long as it stays within the boundaries of the Medianlines/Fork.\
That’s the whole "magic" behind Medianlines/Forks.
And the same applies to the "Behavior of Price" within and around Medianlines. That’s really all there is to it.
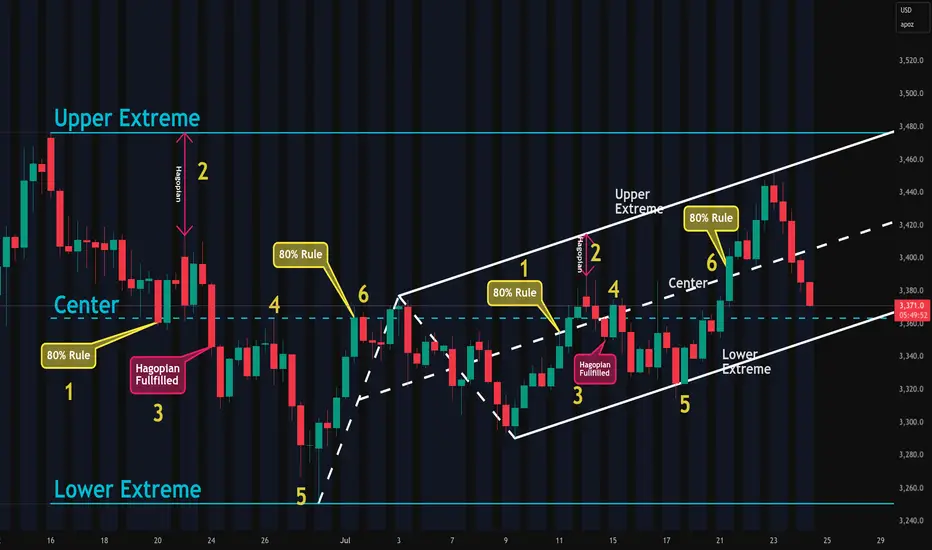
Look at the chart and compare the Channel and the Fork:
1. Price reaches the Centerline about 80% of the time
2. HAGOPIAN → price goes farther in the opposite direction than where it came from
3. HAGOPIAN’s rule fulfilled
4. Price reaches the Centerline again
5. Price reaches the other extreme
6. Price reaches the Centerline about 80% of the time
You’ll see the same behavior inside the Fork!
That’s beautiful, isn’t it? §8-)
And here’s a little Joker in your pocket — if you know the difference between the Channel and the Forks!
Do you know what it is?
Yep! You’d automatically know the direction to trade — giving you another 10% edge right out of the box — LONG TRADES ONLY. Because the Fork projects the most probable path of price to the upside, not down.
That's all folks §8-)
Like this lesson?
With a simple boost and/or a little comment, you load my Battery so I can continue my next step on the trail with you.
Thank you for spending your time with me §8-)
Setups
Mid-Session Market InsightsMid-Session Market Insights
In today's session, I'm closely monitoring eight different futures markets: S&P 500, NASDAQ 100, Russell 2000, Gold, Crude Oil, Euro Dollar, Yen Dollar, and Aussie Dollar.
S&P 500: We're seeing a rotational pattern within the prior day's value area and the CVA. I'm eyeing long opportunities from the prior value area low up to the high.
NASDAQ 100: The market is a bit choppy around the PVA and CVA highs, with a slight upward intraday trend. I'm staying cautious here.
Russell 2000: Also choppy, but we've got acceptance within the CVA. I'm looking for long opportunities from the CVA low, which aligns with the prior day's low.
Euro Dollar: I'm currently short from the CVA high, with the first target at the prior day's low. We've broken below the prior value area, so I'll trail this trade and see how it develops.
Yen Dollar: It’s been a bit of a mixed bag. I took a short below the CVA and prior day's low, got stopped out, but it was still a decent setup.
Aussie Dollar: I took some long positions that weren't the best setups, as it was quite choppy near the CVA high and prior day's low. Lesson learned for next time.
Crude Oil: I took a short from the CVA and PVA highs, hit my target at the low of those areas, and we’re currently hovering around that level.


You saw a meme. I saw imbalanceWIF doesn’t need to be serious — because I am. This move isn’t about hype. It’s about inefficiency, reclaimed structure, and a clear delivery path.
The logic:
Price swept the lows and gave a clean reaction off the OB. From there, it filled the local FVG but didn’t expand — it paused. That tells me it’s not finished building. The first push wasn’t the move. It was the positioning.
The real draw is layered above:
TP1: 0.9591 — inefficiency midpoint
TP2: 1.0469 — external liquidity and high-volume cluster
The FVG-OB combo below (0.8736–0.8565) is the reload zone. That’s where Smart Money buys. Not above. Not late.
Execution:
Entry: 0.857–0.875 zone
SL: Below 0.825
TP1: 0.959
TP2: 1.046
Let retail react to candles. I’m reacting to context.
Final thought:
“You can laugh at the ticker. Just don’t laugh at the R/R.”

USDJPY Returns to Key Support – Another Bounce Ahead?At the end of April and beginning of May, I pointed out the importance of the 142 support zone and argued that USDJPY could reverse to the upside, targeting the 146 resistance.
The pair did exactly that — not only hitting the 146 target, but also spiking as high as 148, reaching the next major resistance.
🔁 Now We're Back towards 142
Since mid-May, USDJPY has pulled back again and is now retesting the 142 area — the same zone that previously triggered a strong bounce.
📌 Outlook and Trading Plan
I still consider the 142 level a solid support, and this recent drop could offer a new buying opportunity.
Any dips under 142 that quickly reverse can be used to build long positions, with a target once more around 146.
That offers a clear trade setup with a good risk-to-reward ratio.
Disclosure: I am part of Trade Nation's Influencer program and receive a monthly fee for using their TradingView charts in my analyses and educational articles.

#BTC #BTCUSD #BTCUSDT #BITCOIN #SHORT & #LONG #Setups #Eddy#BTC #BTCUSD #BTCUSDT #BITCOIN #SHORT & #LONG #Setups #Eddy
BTCUSDT.P Short & Long Setups with Entry Points.
This Setups is based on a combination of different styles, including the volume,ict & Price Action Classic.
Based on your strategy and style, get the necessary confirmations for this short & long setups to enter the trade.
Don't forget risk and capital management.
🔴 Short Entry : 86000 (( Already Activated ))
⚪️ SL : Available on chart
⚫️ TP1 : 75000
⚫️ TP2 : 70000
⚫️ TP3 : 62000
🟢 Long Entry : 61845.8
⚪️ SL : Available on chart
⚫️ TP1 : 250000
⚫️ TP2 : 500000
⚫️ TP3 : 999000
‼️ Futures Trading Suggested Leverages : 3-5-7
The World Let it be Remembered...
Dr. #Eddy Sunshine
4/13/2025
Be successful and profitable.
Please see my previous analysis on Bitcoin and proceed based on the second scenario.
My previous analysis on Bitcoin :
I also invite you to check my analysis on the Total 3 chart and proceed accordingly, and after it happens on the altcoins, enter swing long trades with the necessary confirmations.
My analysis of the Total 3 chart:
👆 Based on the analysis provided on the Total 3 chart, proceed and wait for another bearish lag for the Total 3 chart to reach the specified area. The divergence on the upper timeframe is most likely a market maker trap and the current bullish move is a fake. In my opinion, the main bullish move will begin after another 30-45% correction on altcoins and the Total 3 chart reaching the specified area and the orange POC line.

Could we see more downside for BTC? BTC setting up a bearish flag on the daily.
Negative divergence.
Engulfing red candles after buyers trying push it up.
Next major support is around $73-72K.
I'm canceling longs for now and focus on shorts. Also expecting a late alt season.

GOLD Bullish Bias! Buy!
Hello,Traders!
GOLD is making a bullish
Rebound from the support
Cluster of rising and horizontal
Support levels so as Gold is
Trading in an uptrend we are bullish
Biased and we will be expecting
A further bullish move up
Buy!
Comment and subscribe to help us grow!
Check out other forecasts below too!

AUDJPY - Short SetupMy main trading principle is that the price always moves from swept liquidity levels to untouched liquidity levels.
In particular case we clearly can see the following context: price swept 1D and 1W key liquidity level and left untouched level lower, this indicates on probable distribution Wyckoff range.
But to take more statistically probable trades we should wait for some type of lower timeframe confirmation, and in this case we can notice sign of weakness (reaching the middle of the range), so potentially there is a higher probability to see price lower.
Your success is determined solely by your ability to consistently follow the same principles.

GER40 - Short Setup My main trading principle is that the price always moves from swept liquidity levels to untouched liquidity levels.
In particular case we clearly can see the following context: price swept 1D key liquidity level and left untouched level lower, this indicates on probable distribution Wyckoff range.
But to take more statistically probable trades we should wait for some type of lower timeframe confirmation, and in this case we can notice sign of weakness (reaching the middle of the range), so potentially there is a higher probability to see price lower.
Your success is determined solely by your ability to consistently follow the same principles.

$U in the domeNYSE:U $25 outlook short term. See a rotation in Mid Cap stocks, and the contracts have nice IV. Earnings is late Jan. Could definitely get paid off that day before alone most likely. Looking at 2/21/2025 $25 strike.
NFA
WallStreet

$CADJPYGreen: Entry Point
Blue: Start of Week
Red: End of Week
Thumbs Up: Trade Available for Week
$ Amount (Numbers Above): Price Targets
Potential ABC pattern located. Looking for price to retrace to the targets overtime.

Watchlist - Nov 17, 2024Here’s my weekend watchlist from the passive screener. The list is short, as many stocks have already made their swing moves higher. Both the market and some stocks show temporary indication of exhaustion, so it might be a good idea to be selective.
Bullish List: PLCE
Bearish List: UPST, SMLR, AMSC

Watchlist - Nov 10, 2024This is my weekend watchlist selected from the passive screener, primarily for monitoring potential setups. I didn't find many proper opportunities this time— few setups and most were lower quality, so mainly for observation. Most proper movers are already on the run.
List: PLCE, KYTX, DNA, NPWR, TTGT, OUST, ALGS, SNAP, EYE, APLS, LSCC, DHI, IBTA

Parabolic Reversals, A+ setup explained with todays NAS R5 shortRecap of todays NY Session with my shorts on NAS and Gold. I am explaining the parabolic reversal setup in detail since it happens quite often currently and is one of my favourite setups.

YOU NEED ONLY THIS SETUP TO MAKE MONEY..Check out my previous public ideas and see hot it works and how you can start making money.
Thanks for feedback! Let's get it!

GBPUSDThe price today behaved in a wonderful way. I think it has been the best day as a trader. The entire plan today was fulfilled perfectly and I wanted to share this scenario with you since it is the one. I am going to start searching every day. I hope you have Having had an excellent day, I am leaving for today. Tomorrow more and with more outside. blessings.

GOLD DAILY CHART UPDATE Hey Everyone,
Please see update on our daily chart structure.
Last week we stated that we will continue to see price play between 2355 and 2309 until we see a lock confirmation for the next range.
- We now have a cross and lock above 2355 leaving a gap to 2405.
We have marked the charts with the weighted levels and will use them to track the movement up and down confirmed with ema5 cross and lock confirmation.
We will use our smaller timeframe analysis and trading plans to navigate the range in true level to level fashion.
Our long term bias is Bullish and therefore we will continue to use our smaller timeframes to buy dips using our levels and setups.
Buying dips allows us to safely manage any swings rather then chasing the bull from the top
Thank you all for your likes, comments and follows, we really appreciate it!
Mr Gold
GoldViewFX

#BTC #Bitcoin #Short #Long #Setup 12+13 #Eddy #BTC #Bitcoin #Short #Long #Setup 12+13 #Eddy
It's you & New Setups 12 + 13 :-)
(( According to the investigations carried out in the supply range of the 4-hour time frame, and in the lower time frames we see divergence and compression and confirmations of the fall, if you are familiar with the liquidity structures, you will understand the reason for these shorts and longs again. I hope you will enjoy the settings and make the most of them and introduce my trading view page to your friends. ))
Related Relevant Analysis & setups of Bitcoin : (( BTC/USD )) : Check Link :


EURCAD → Day Analysis | BUY SetupHello Traders, here is the full analysis.
Price reversal going up, levels for BUY . EURCAD long
! Great BUY opportunity EURCAD
I still did my best and this is the most likely count for me at the moment.
Support the idea with like and follow my profile TO SEE MORE.
Traders, if you liked this idea or if you have your own opinion about it, write in the comments. I will be glad 🤝
Patience is the If You Have Any Question, Feel Free To Ask 🤗
Just follow chart with idea and analysis and when you are ready come in THE GROVE | VIP GROUP, earn more and safe, wait for the signal at the right moment and make money with us💰

Apple Market Analysis (AAPL): Evaluating Potential Scenarios 📉 While we're not ones to conjure doomsday scenarios or firmly believe in them, it's undeniable that some charts, stocks, commodities, etc., have the potential to plunge significantly.
Apple NASDAQ:AAPL is one such example. It's essential to clarify that we don't primarily anticipate a 40 to 50 percent drop in Apple's stock price. However, we must acknowledge the possibility.
🔎 Our primary analysis suggests we're dealing with an overarching Wave (3) (in blue) and currently in Wave (4). The question is whether Wave (4) has already concluded at the $124 level with a zigzag-flat movement, or if we might dip lower for Wave (4). There are two possibilities, especially since Wave 1 aligns precisely with the 127 percent level, which is the target for an Expanded Flat. The structure towards the red Wave 1 doesn't distinctly resemble a 5-wave pattern, keeping the second scenario very much in play. If this occurs, we expect prices to reach at least $124, potentially dropping further towards $100.
If we assume that it's indeed a Wave 1, lying coincidentally around $200, we might be dealing with a normal flat structure. Both Wave ((a)), showing a triple structure, and Wave ((b))are at the level of Wave 1, leading us to anticipate Wave ((c)) reaching the level of Wave ((a)). However, a deeper fall is still plausible, ideally stabilizing at the 61.8% level. Anything below this would significantly alter the potential Wave (4) scenario, and we would wait accordingly.
✅ Over the next days, we'll continue to monitor the chart, ready to send out a limit order for this setup if it materializes.
📉 Looking at the potential doomsday scenario, particularly a possible Wave II. This Wave II could reach between 50 and 78.6%. Assuming Wave A as Wave II, as shown, is quite a gamble since it doesn't even reach 38.2% of the total course since 2009. Also, Wave B, as an overshooting wave, precisely hits the 127% retracement from Wave 5 to Wave A, suggesting an extended Wave II correction.
📈 If, however, we surpass $205, this scenario becomes invalid, indicating a continued upward trend. Unless we break this level, there's still a possibility of dropping below $100, a precarious position for Apple. But then, as this is part of Wave II, a significant, long-term rise for Wave III should follow. Whether this happens remains to be seen in the coming months, laying the foundation for either a downward correction or a continued uptrend.

#BTC #Bitcoin #Short #Long #Setups 7+8+9 #Eddy#BTC #Bitcoin #Short #Long #Setups 7+8+9 #Eddy
I have specified the direction of Bitcoin for you guys <3
My New Scalp Setups & Big Short Setup on Bitcoin, In Total 3 new positions of mine on Bitcoin ;-) Look at Final Setup Target :-O :-D
(( Out of 6 signals sent, we experienced a stop "Risk-Free" & a stop "loss" & 4 signals received their profit <3 )) What's About You? ;-)
Related Relevant Analysis of Bitcoin : (( BTC/USD )) : Check Link :
"Share your thoughts & ideas with me in the comments"
