Stocks To Watch This WeekMany names are holding up well in this market. Get a pen and paper because I go quickly and make the trade your own.. These names have shown good relative strength and accumulation volume and most are in the growth sector. This may give good risk/reward entries on some of the best names. Some of these charts still need to confirm their price action. This video is my watchlist. Most of these names are at or near all time highs or multi year highs. There are 25 total stocks on this list Many of these have IPO'd in the last few years and still have a growth story ahead of them. Know your time frame and risk tolerance. Know your earnings dates! I go through these quickly so grab a pencil and paper and jot down the names that look interesting to you and then make the trade your own. Good Luck!
Setups

BTC bitcoin update camarilla pivotspreviously posted for a long entry on weekly L3 with target H3. There are two potential setups from here in the making
if btc rejects and finds resistance on the H3... short with target of L3 or lower and stoploss at H4.
If already long take partial profits. If not wait for break and retest of H4 with target H5 and above and stoploss at H3
analysis on camarilla pivots weekly levels

BTC update and next possible setupsbitcoin found support on the weekly L3 Camarilla pivot and has made its way to the weekly H3. these two levels represent the weekly projected range points that were plotted on weekly open usin prior weekly open close, high and low. from here there are two potential setups. Analysis done with camarilla pivot points weekly levels
If you are long from L3. take partial profits and move stoploss to entry and wait for more.
if you want to short look for rejection on H3 and set stop loss on H4. Target L3 and possibly lower.
If you want to long and have not entered wait for clean break of H4 and target H5 and above with stoploss at H3.
Either way this is our first point of potential resistance and it could cool off reguardless

Ethereum ETHLet's keep it simple. Looks like on a long term basis, we are still riding the uptrend. Previous High was broken. Previous low hasn't been broke as of yet. Looks like momentum is starting to break down a bit on the Mac D while at a support level. Let's see if price will retrace the previous high up to 60%. Ethereum is a popular blockchain. I don't know too much about it. However, I wouldn't see why this doesn't play out over time.
What do you think?

Dollar Futures DXYDon't want to make this too complicated. If you follow economics, we know that interest rate hikes usually make the dollar stronger. With this in mind, we see the dollar in a older support zone. A lower low has been established. However, since then there has been higher high's on smaller time frames as of late. I want to see if price will retrace the previous resistance area up to 60% or more at some point this year.
What do you think?

USDCADI wanted to take a deeper look into USA and Canada. When looking at techs and fundamentals, there looks like there could be some space here for a run as we go through our interest rate spikes etc throughout this year. On the daily timeframe, I doubled the ATR for my stop loss and the target is near the 60% area which is where the previous high's are on a higher outlook as far as time. Let's see what happens over time. We are currently in a range of higher high's and I would like to see if we are getting the same pattern (look at circles). I'll wait as long as I can for this one.
I compared the following statistics to try to get a more fundamental outlook vs depending on straight technical:
GDP per Capita Differential (Lesser amount wins) - USA
Productivity -USA
Unemployment Rate Differential (Higher amount wins) -USA
Government Spending (Higher Amount wins) -USA
Business Confidence differential (Lesser amount wins) -USA
Consumer Confidence differential (Lesser amount wins) - Canada
Consumer Spending (Higher amount wins) -Canada
What do you think? I'm looking for a more long term outlook here. This will be my only forex trade this year. Might scale in on this position over time if things work out.

GoldViewFX - H1 Update and Targets$Quick update on yesterdays post on the HOURLY CHART (see link to related post below).
We identified a range of 1817.42 - 1828.99 and expecting price to play in this range.
EMA5 broke 1817.42 down with a candle body close, which opened up the lower levels. 1806 being the strong Goldturn level, however price went and HIT the recent 1814 Goldturn and found support. Anyone who noticed this break, which we highlighted could have caught 30pips here.
The price then broke back up into 1817 Goldturn with a candle body close, which opened the upper levels, 1828 being the strong Goldturn, however price went and HIT the recent 1823 Goldturn and found some resistance; another easy catch, if anyone caught it to the next Goldturn. We had a buy signal activate here, confirmed with all our parameters, which we took and banked!!!
We have also identified a Bull flag formation here and the potential target of the pole is inline with our overall 1828 Target. We continue to buy dips and should this change, we will be sure to update you all.
Please don't forget to like, comment and follow, we really appreciate it.
GoldViewFX
XAUUSD TOP AUTHOR

BTC bitcoin. what comes next? setupsif we reject here at H3 target could be L3 with stoploss at H4. if we break H4 or L4 target would be corresponding H5 or L5 with stop on its corresponding H3 or L3 pivot below or above

USD/JPY LONG SETUP +135pipsMy overall conviction for the strength of the US economy is extremely strong with expecting the DXY to push much higher than market prices. Despite a lower than expected NFP figure today the internal metrics within the data such as wage growth , unemployment rates & household surveys were extremely optimistic for the US economy further acting as a confluence to UJ longs.
From a technicals standpoint UJ has made a HTF rally and it could potentially pullback into a 45m area of demand to collect orders before pushing higher. A 10pips stop hunt was also evident at the same zone showing the tendency of price to act as such in the area. Price should also move lower to clear any buy-side liquidity under the trend line before mitigating the area of demand.
If all goes to plan an easy 135pips would be banked.

Ace Trading Academy - GBPJPY Analysis and SetupGBPJPY has currently bounced off of the .5 fib to push lower. We want to see GJ push down to the support box below. Confirmation that it is pushing is a candle close below 156.641 which is marked on the chart.
Like, Follow and Comment
Will have updated moves when the time is right!

IntelI like historical pattern of this company. This an opinion based on an article I've just read but it seems as if the semiconductor issue is simmering down a bit relative to how unsure this issue was late last year. We also see a bunch of car companies having increased deliveries as well. Although Intel isn't the end all, be all within this sector, I can see at least a retracement of about 45% of the previous high seeing how price has reached this point up to 5 times since 2018's May. Let's see what happens! They also have enough cashflow to compensate for a hike in interest rates.

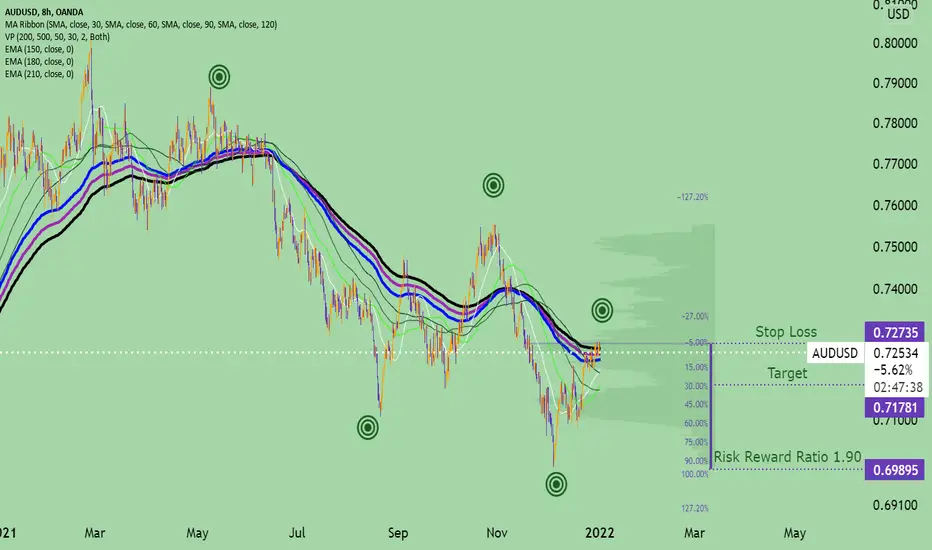
AUDUSDLooks like we have clear market structure here. Lower high's and Lower Low's. Aud has no plan of raising interest rates as of yet. USA already has plans implemented. I'm assuming that USA will have stronger currency. Price looks like it could rejecting the 210 day ema and I would like to see if price will retrace anywhere down to the 60% level. Let's see what happens!
We just trying to do better and be better...that's the goal for 2022...
DXYStepping away from indicators 2022. I see that price like to bounce off of my 150 ema. On the current candle we have strong rejection with a bullish candle on the 8 hour timeframe at a support zone. Price likes that 60% area. Price has been ranging since late November and with interest rate hikes, it should supply a small boost to the dollar. However, interest rate or not. A retracement SHOULD be imminent due to historical chart data. Let's see what happens.
We just trying be better and do better. Nothing more...nothing less....

StocksThe Market's longer term uptrend still intact and things look cautiously optimistic. These names have shown good relative strength and accumulation volume and most are in the growth sector. This may give good risk/reward entries on some of the best names. Some of these charts still need to confirm their price action. This video is my watchlist. Most of these names are at or near all time highs or multi year highs. There are 29 total stocks on this list Many of these have IPO'd in the last few years and still have a growth story ahead of them. Know your time frame and risk tolerance. Know your earnings dates! I go through these quickly so grab a pencil and paper and jot down the names that look interesting to you and then make the trade your own. Good Luck!

Happy New Years Solana FansI see a pattern. What do you think? Are you willing to hold long enough? Higher High's and Higher Low's. Let's see if we can reach the 45% retracement!

EURUSD Sell Signal This is a Trade that I'm looking to BUY or SELL: SELL
ENTRY: 1.13200
Stop Loss: 1.13400
TP1:1.12900
TP2:
TP3:(SWING)
*Disclaimer:
Futures, Options, and Currency trading all have large potential rewards, but they also have large potential risk. You must be aware of the risks and be willing to accept them in order to invest in these markets. Don’t trade with money you can’t afford to lose. Past profits do not guarantee future results.***

Stocks To Watch This WeekThe Market's longer term uptrend still intact and things look cautiously optimistic. These names have shown good relative strength and accumulation volume and most are in the growth sector. This may give good risk/reward entries on some of the best names. Some of these charts still need to confirm their price action. This video is my watchlist. Most of these names are at or near all time highs or multi year highs. There are 18 total stocks on this list Many of these have IPO'd in the last few years and still have a growth story ahead of them. Know your time frame and risk tolerance. Know your earnings dates! I go through these quickly so grab a pencil and paper and jot down the names that look interesting to you and then make the trade your own. Good Luck!

BitcoinPrice could be rejecting the 233 ema and the bears are putting up a good fight at an oversold area on the mac d/rsi. May take some time to break down but interesting to see if a possible retracement is imminent. I would like to see a retracement of 38% minimum. What do you think? Looks like the fight is going on right now for bullish and bearish vwap control. I'm going with the bears this time. Will update.
Not advice*

AUDNZDTechnical:
Potential Double Top on Daily Timeframe.
Possible rejection at the 200 ema.
Price recently broke out of downtrend dated back to May and could be in position to retest the previous low from November.
Fundamental:
New Zealand has a higher interest rate having hiked twice currently at 0.75 from 0.25 and expects to get to 1.0 sometime next year. They plan on 4 hikes since they started ending towards the end of next year while Australia although considering to still make that decision, have sentiment that it may not need to hike until 2023. New Zealand has more reason to start taking action to strengthening their economy. I usually wouldn't trade a lower GDP country on the bull side however, I'm going off the interest rate hike news for an economy that's trying to recover. Higher interest rates, stronger dollar, given historical chart data even if priced in, I want to see if we can get a boost somewhere in the future for the NZD.
Not Advice!
Trade could go wrong but that's why we keep practicing!

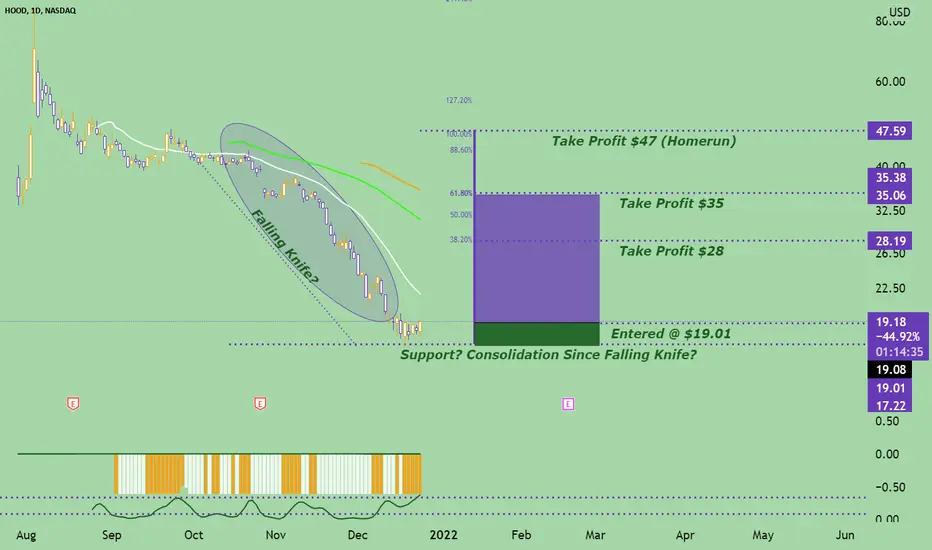
RobinhoodLooks like we are getting some consolidation around this area with a strong bullish candle kicking in. I know a lot of people may not like this stock. However, investing and trading is all about finding stocks that are under or at its fair value while giving it time to move. Benjamin Graham liked beat up stocks that have some juice left in it. Well this is Robinhood. Robinhood introduced me and a lot of my peers to investing/trading and have either changed our lives or given us sentiment that we can change things down the line for ourselves and family. This is that type of trade for me. There isn't a good amount of MOAT. However, I like that this company has the attractiveness to the youth with how easy it is to navigate the app and getting in and out of trades and even learning about different things. They make their money like any other broker through spreads etc. I've been using Robinhood for a year since I've began trading and have seen the development of the app continue to grow. Honestly, when most people beat up a stock that tells me that they may be doing something good to be honest. Reminds me of when Facebook went through their recent situation and look at their stock now. From an annual perspective, they have increased their free cashflow. Operating Activities increased. They are investing more into their business. Assets overpowered liabilities. Total Equity has increased. Debt has increased but not as much as the income they have brought in. Net income is out of the negative and their EPS is out of the negative. This isn't the end all be all. However, this is what I would consider to be a damaged stock that has juice left. I want to see a retracement of 38% or more of the previous high. Let's see what happens by 2024!
Not advice!
This trade could go wrong. That's what trading and investing is about. Let's keep working on getting better!
DXYNice support level here. Bulls taking control looks like. Looking for 38% to 88% retracement towards the previous high. Oversold on the RSI and the Mac d. Let's see what happens. If you look at the chart, $96.20 seems like a good target at this point to be safe. Let's see what happens.
Not advice

GBPUSDAfter reading an article via Reuters, gross domestic product in the world's fifth-biggest economy increased by 1.1% in the third quarter, weaker than a preliminary estimate of growth of 1.3% as global supply chain problems weighed on manufacturers and building firms. Investors are braced for a further slowdown in the fourth quarter of 2021 and a weak start to 2022 due to a rise in COVI9-cases caused by Omicron which has hurt Britain's hospitality and leisure sector and hit retailers. Although on the daily timeframe, we are on a strong bullish candle, we've located a double top on the 4 hour timeframe. This pair has been on a downtrend since June of this year due to economic growth being slower than expected. I don't see why the US economy would grow slower than the UK is trying to recover. I don't want a homerun, just a retracement of at least 38% of the previous low on this time frame. Let's see what happens.
Not advice*
This trade could go wrong. However, it's about getting better!

JPMorgan ChasePotential double bottom setup here. I like this companies financials. It's a credit card company so I'm thinking about the attractiveness of reward points and holiday spending. Even though it's not estimated to be a great holiday season for some, I'm more so thinking about the surcharges and end of month billing here. Chase is also a bank on top of that and just in case they raise interest rates, this may not be a bad move. I want us to reach anywhere between 50-68% of the previous high which was set inn October. I love financials around this time of the year. Let's see what happens!
Not Advice!
Only an Idea!
This trade may end up going wrong. That's the nature of trading! Let's keep getting better!
