Sgd

AUDSGD Sell SignalPattern: Channel Down on 1M.
Signal: Bearish as the price is coming off a rejection on the 1D MA50.
Target: 0.9200.

NZDSGD: Strong Buy opportunity within the Channel Down.The pair has been trading within a long term 1M Channel Down (RSI = 37.426, MACD = -0.018, Highs/Lows = -0.0198) that only recently made a Lower Low and is rebounding on the 3rd straight green 1W candle.
Based on the duration and decline of the previous Lower Highs, we are expecting the next Lower High to be towards 0.91000, where it will make contact with the 1W MA50, which has always provided a rejection in the past 2 years.
** If you like our free content follow our profile (www.tradingview.com) to get more daily ideas. **
Comments and likes are greatly appreciated.

Japese Yen (JPY) Demolition? Time for Singapore Dollar (SGD)?Couldn't pass this guys! But I think JPY's time as a "safe haven" currency is over. I'm yet to learn of the underlying fundamentals but there are a lot of pluses in the monthly chart. And they are rare! Since the monthly chart is king, I'll take the cues from the double bar bull reversal pattern clear in the monthly chart and call for SGD LONGs in the daily and 4-Hour charts. What's more, September's bull bar was below the lower BB meaning there was a degree of under-valuation. Therefore, as the market seeks for equilibrium, it is likely that prices will rally to 83 or higher by Q1 2020. It's a long hold but you will be earning positive swaps, so no big deal!

EURSGD: Sell opportunity on recurring pattern.The pair has been trading within a 1M Channel Down (RSI = 40.510, MACD = -0.011, Highs/Lows = -0.0132) since the start of the year. Recently is has been following a previous pattern within the Channel Down that calls for a bearish extension. We are taking this sell opportunity to aim near the 1.4810 Support. Attention is required and readiness for an early exit as this levels has been holding since November 2015.
** If you like our free content follow our profile (www.tradingview.com) to get more daily ideas. **
Comments and likes are greatly appreciated.

Trading on divergence signalsEDUCATIONAL PURPOSES:
There are several indicators that one can employ during the course of analysis. One common indicator will be the Relative Strength Index.
What can you draw from this indicator?
Overbought and Oversold signals!
However, one can also use this indicator to spot divergences in the price and the relative strength!
Above are 3 examples of RSI divergences: AUDCAD, AUDSGD and GBPAUD.
The main idea is to look out for differing directions between the price and the RSI within the same period.
As we can see from AUDCAD and AUDSGD, price was creating lower lows while RSI was creating higher lows. This is an example of a BULLISH RSI DIVERGENCE, and price will soon start correcting.
In the case of GBPAUD, another higher high on the price carves out a lower high on the RSI. This shows that there is a BEARISH RSI DIVERGENCE, and price will soon start correcting.
Spotting divergences helps with timing of trade entries (whether it is too late or too early), exiting of positions and/or adding more positions. You can also use this as a trigger for a trade (i.e. a Long trade in AUDCAD, or a Short trade in GBPAUD).
The time frame that you use to spot divergences will affect how long you have to wait for price to start correcting (i.e. shorter time for H1 as compared to Daily).
**One important point to note when spotting or trading on divergences: Observe for price action in line with your bias (bullish price action for bullish RSI divergence, vice versa).
RSI divergences can fail should it carve a higher high or lower low that is in line with price.

USDSGD nice sell after a flagIf we see a nice correction as shown, it's a good place and time to short this chart
EURSGD Sell SignalPattern: 1W Channel Down.
Signal: Bearish as the RSI was 30.00 on each of the previous Lower Lows.
Target: 1.48100 (1M Support).

NZDSGD: Long opportunity within a 1M Channel Down.The pair has been trading within a 1M Channel Down (RSI = 35.152, MACD = -0.017, Highs/Lows = -0.0297) since January 2017. Currently it is closer to the Lower Low zone and since through-out this downtrend it has always made contact with the 1W MA50, we are expecting a rise towards at least 0.9000.
** If you like our free content follow our profile (www.tradingview.com) to get more daily ideas. **
Comments and likes are greatly appreciated.

#AUDSGDThe green areas are Target
Purple ranges are important and strong
Support and resistance are specified
Time range specified
Price is within channel
Look at the trend lines

As we have predicted Singapore dollar has touched 1.3722, whats?After short break lets follow up our signals from last week. As we have posted earlier technical analysis for US - Singapore dollar currency pier, price has touched 1.3722 support and now correcting trend for short term. The pattern Sperandeo is still active. Check both photos


CHFSGD pushing for sells, retest broken key areaCHFSGD looking beautiful, price broke strong key area and retested it. We'll enter a buy with a stop loss of 60 pips compared to a take profit of 240 pips.
CHFSGD SELL
start: 1.39128
stop-loss: 1.39723
take profit: 1.36732

NZDSGD Buy SignalPattern: 1M Channel Down.
Signal: Bullish as the price is close to the 1M Support and is making a Lower Low on the inner Channel Down.
Target: 0.9000 (projected contact with the MA50).

Don't miss the great buy opportunity in GBPSGDTrading suggestion:
. There is a possibility of temporary retracement to suggested support line (1.6908). if so, traders can set orders based on Price Action and expect to reach short-term targets.
Technical analysis:
. GBPSGD is in a range bound and the beginning of uptrend is expected.
.The price is above the 21-Day WEMA which acts as a dynamic support.
. The RSI is at 64.
Take Profits:
TP1= @ 1.7118
TP2= @ 1.7250
TP3= @ 1.7525
SL= Break below S2

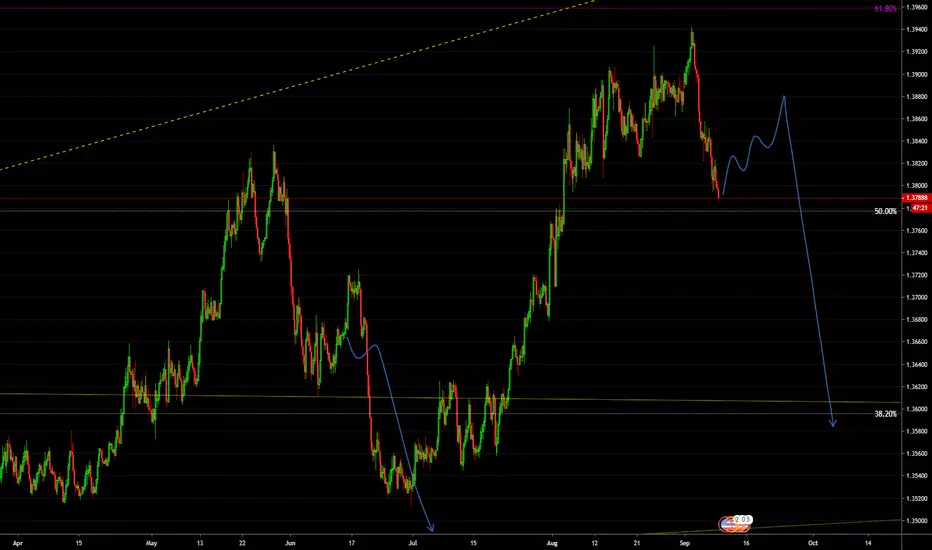
SGD/USD watching for the next tradeIf you would like to speculate a little bit, this can be your next trade.
SGD/USD is at a weekly 61.8 Fibonacci level. This level is also known as the golden level, meaning that if we have the price above the same level, we are in an uptrend, and vice versa.
I will take a closer look at future market development and RSI 40 level.
If the price holds above 61.8Fibonacci level and when RSI shows me some strength to hold his value above 40 levels, then I will shoot.

Buy to R3 - 40 pipsI am long on this thing...tight stop, 10 pips below monthly middle pivot (MR1) which is at 1.40729

AUD SGD BUY (AUSTRALIAN DOLLAR - SINGAPORE DOLLAR)Hi there. Price is forming a continuation pattern to the upside. Wait for the price to hit the bottom of the pattern and watch strong price action for buy.

RSI divergence at yearly S2 (75.922)Seems like a great setup. Price cant get through yearly pivot support2, overextended. Last hour candle was bullish pinbar off yearly s2. RSI is like Xray, helps to detect the decease. AD volume of SGDJPY is in long term bullish uptrend on daily.

Bullish RSI divergenceSeasonality for EURSGD is 69 bullish in April. After it hit 100 percent Fib time extension (on 30 min, 60 min and 4 hrs) I expect price to reverse to the next swing resistance. 60 min ADX is above 20. Stop below 100 Fib extension (23 pips).

USD SGD ShortSingapore's annual inflation rate fell to 0.6 percent in June 2019 from a two-year high of 0.9 percent in the previous month and below market expectations of 0.7 percent. That was the lowest inflation rate since March. Singapore Dollar now trading at 1.3691. Technicaly with T1, T2, T3, and T4 there is patern Sperandeo, which forecasts SGD's gradual rise against USD. Next target 1.3560 (Short USD-SGD, Long SGD-other currencies )

