Charts Speak #Sharada Cropchem
Sharada Cropchem
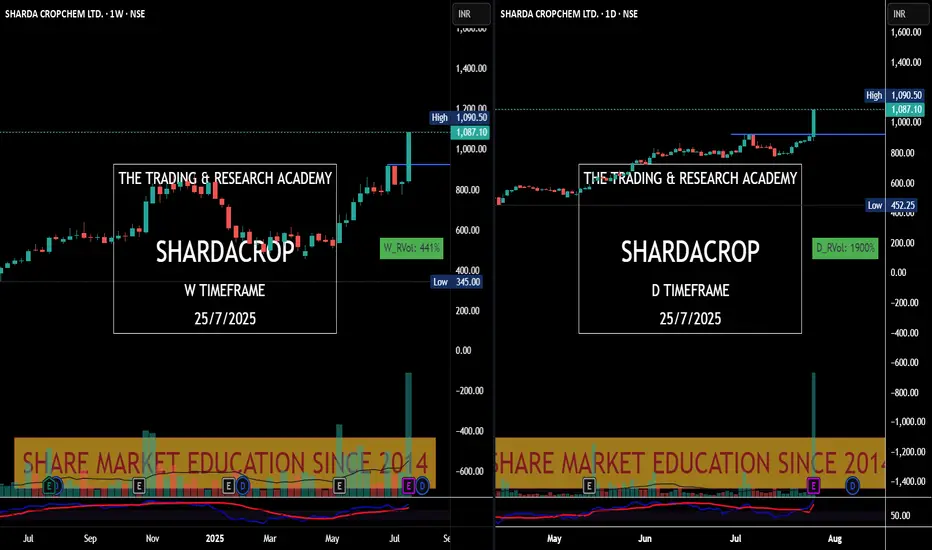
Charts always lead the News! This is yet another example where price was leading & News came later.
Stock was under accumulation since June with higher qty. In fact since May 25, it was getting bought in average 2-3M qty weekly. What a planned buying..
28th May, 4 June, 18th July were nice buying alarms for us. Today it was just a final nail in the coffin.
Shardacropchem

SHARDACROPCHEMThis stock has formed cup and handle pattern with accumulation since 3 years, Now it's a verge to break the resistance trendline which is top of the cup and handle chart pattern, breaking above 375 can be a good impulse beginning towards north. One can go Long on only closing above 375.
Key Levels are Mentioned on chart
Cup and handle pattern
Macd in monthly bullish and Uptick
Macd in weekly positive crossover and Uptick and also above zero line
Macd in daily positive
Rsi in Weekly Uptick and also Breakout
Rsi in daily
Disclaimer
I am not sebi registered analyst
My studies are Educational purpose only
Please consult your Financial advisor before trading or investing
