INTEL - The Strong Support and New Buy OpportunityThe market made a huge gap and it helped the price to reach a support zone. This zone is between SMA100 and SMA200. It also includes 50.00 support level. The price reversal from this zone will be able to give a possible buy opportunity.
RSI line is at the oversold zone and it will be able to give us a good confirmation for the price reversal. MACD histogram also will be able to support an upward movement as soon as we will get several bullish candles.
If the price drops below SMA200, the trading ideas based on the reversal from the support zone should be changed into a new one.
Shares

Forget Bitcoin and watch this textbook TA!Away from the action on BTC and the S&P500, I'm making big profits on hidden gems, like this UK stock. A classic TA inverse head and shoulders setup! Straight out of the dusty textbooks. Strong volume on the left shoulder and weak volume on the right shoulder, just as it should be. I bought just above the breakout line. The breakout is clean, retests to a perfect level and then takes off like a rocket! Beautiful. (and highly profitable).

Twitter Inc. (TWTR) Sell Limit $39.05 > $35.29 (Profit:Risk=2:1)NYSE:TWTR
Twitter, Inc.
Information:
Our figure is a divergent moving triangle less common.
In coming days, I expect a correction on the shares of Twitter, Inc. S&P 500 also looks at correction.
About stop loss:
Stop loss 4.81%
------
Sell Limit = $39.05
Take Profit = $35.29
Stop Loss = $40.93
------
Profit:Risk = 2 : 1
Profit:Risk = +9.63% : -4.81%

Microsoft Corp (MSFT) $130.00 >>> $126.10 (Profit:Risk=2:1)NASDAQ:MSFT
Microsoft Corp
Information:
Our figure is a divergent moving triangle less common.
In coming days, I expect a correction on the shares of Microsoft Corp. S&P 500 also looks at correction.
About stop loss:
Stop loss 1.50%
------
Sell Limit = $130.00
Take Profit = $126.10
Stop Loss = $131.92
------
Profit:Risk = 2 : 1
Profit:Risk = +3.00% : -1.50%

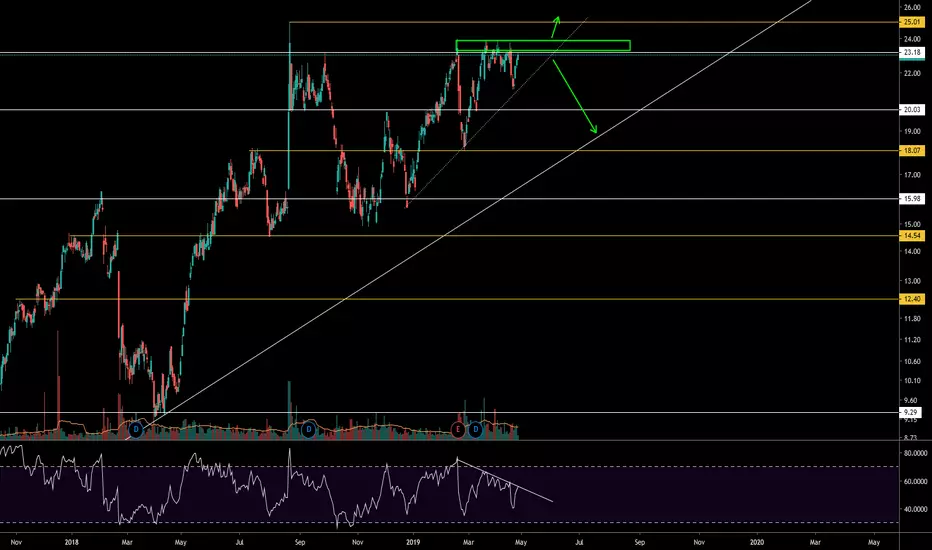
WISETECH GLOBAL (WTC) - Preparing for Breakout?Wisetech has been failing to breakthrough resistance for the past 2 months, forming a downtrend on the RSI.
A break above the pocket of resistance at $23.85 would see Wisetech retest its ATH and most likely break it higher.
A break below the local dotted uptrend line should see Wisetech retest it's major uptrend line around $20.
Dominos Pizza, Inc. (DPZ) Buy $277.70 >>> $290.00NYSE:DPZ
Dominos Pizza, Inc.
------
Buy = $277.70
Take Profit = $290.00
Stop Loss = $270.40
------
Profit:Risk = 1.68 : 1
Profit:Risk = +4.43% : -2.63%

Cisco Systems (CSCO) Sell $56.33 > $48.63 (Profit:Risk = 4.48:1)NASDAQ:CSCO
Cisco Systems, Inc.
Information:
We go up the channel for too long.
Now there will be a breakdown and a reversal of share price.
About stop loss:
Stop loss is placed just above the weekly candle in case of a false touch.
Weekly chart:
Daily Chart:
H4 Chart:
------
Sell = $56.33
Take Profit = $48.63
Stop Loss = $58.05
------
Profit:Risk = 4.48 : 1
Profit:Risk = +13.67% : -3.05%


Electronic Arts (EA) Buy $94.50 >>> Target $99.30NASDAQ:EA
Electronic Arts
Stock - Nasdaq (USA)
Profit:Risk = 1.37:1
---
Buy = $94.50
Take Profit = $99.30
Stop Loss = $90.99
------
Take Profit = +5.08%
Stop Loss = -3.71%

Procter & Gamble opportunityDaily shows overbought with candles showing rejection on the upper side of the channel. A short can be placed if we see an impulsive below 105 level on to test the uptrend line, better with a spike in volume as well. If not, a long is likely on bounce from the 105 zone.
Please like and comment your thoughts on this!

American International (AIG)(NYSE) Sell $46.04 >>> Target $44.34NYSE:AIG
American International Group Inc
Stock - NYSE (USA)
Profit:Risk = 2:1
---
Sell (Pre Market) = $46.04
Take Profit = $44.34
Stop Loss = $46.90
------
Take Profit = +3.70%
Stop Loss = -1.86%

Johnson & Johnson head and shouldersLooks like a right shoulder could be forming, weekly chart offers a nice view and divergence for the H&S pattern. A break to the low through 200SMA on a daily chart could signal a nice short. J&J tasked a Federal Judge to take over the 2400 lawsuits because of the baby powder fiasco so company is still dealing with the fallout.
Could be a good trade for next week. Although earnings on Tuesday were positive there was no bullish spike.
Have a great Easter weekend!

Vodafone inverse head and shouldersWeekly chart confirmed the trend line with a 3rd touch. Daily chart shows inverse H&S pattern with RSI and MACD divergences. This could break to the upside after Easter holidays. Great reward to risk ratio.

LSF - BreakoutLSF has broken out of its tight range whilst it's underlying NAV has hit record highs since it's collapse.
Expect price to break through the local high and head towards next resistance.

Apple - The Bearish DivergenceLook at the market when the price reached the top at 230.00 level. The price formed a bearish divergence with RSI and MACD. After a breakout below the uptrend line, the market continued the downward movement. The same pattern we have now. The market gives us a new bearish divergence. The local uptrend line was broken and it allows us to think about shorting. The price will be able to start a new downward movement with targets at SMA50, SMA100 or the support levels.
For confirmation the upward movement the price will have to break 200.00 resistance level. Will buyers have the power for such breakout? We will see. Indicators tell us about the possible downward movement more than about the breakout and the continuation of the uptrend.

PEPSICO - Sell OpportunityThe price reached a resistance zone between 122.00 and 123.00 level, and we got a reversal. RSI confirms the price reversal and gives a bearish signal from the overbought zone. MACD supports a possible downward movement. DMI is bullish and confirms the uptrend, but ADX line starts falling. It tells us that bulls are not so strong now and the market can begin a correction movement.
If the price breaks the local uptrend line, we should be ready to see the falling to one of the possible support levels or Moving Averages with 100 and 200 periods.

Twitter - Sell OpportunityThe price bounced from the resistance zone between 35.00 and 35.50 levels. RSI confirmed the price reversal. The market looks overbought and the downward movement will be logical. MACD histogram gives a bearish signal. MACD lines are going to support a possible downward movement. DMI is bullish but ADX line, after reaching 50.00 level, starts a sideways movement. It tells us that buyers can take a rest and the market will be able to start a correction movement.
If the price breaks the local uptrend line, we will get an additional signal confirming the further downward movement to the nearest support zones at Moving Averages and support levels.

Boeing approaching buy zonePrice got rejected at resistance at the start of the gap. Approaching buy zone again and 200SMA. Great opportunity to catch the next rally, target to close the gap. Stop with a buffer below the 200SMA.

WALT DISNEY - Sell OpportunityThe price is at the resistance zone between 115.00 and 116.00 levels. We get a reversal candlestick pattern which can be used for opening sell positions. If the price drops below the low price of this signal candle, it will be a confirmation of the further downward movement. The targets for the sellers should be 112.00 and 109.00 levels.
RSI is going to confirm the price reversal from the resistance zone. MACD and DMI still support the upward movement, but for getting additional signal confirming the strength of buyers, the price will have to move above the high of the signal candle and stay above the resistance zone.

TPG presents itself with a buying opportunityAustralian Telco TPM.ASX has been bashed down after failure to bring 5G via Huawei. However now looks set to continue its run upward.

Johnson & Johnson opportunityRising channel now testing its low and 200SMA. Potential to buy with a good risk-reward. Or see if we break lower on the open of the US session.

Which way will BYOT go?Huge rise, then fall on the day they announced EPA approval
for their sanitiser product.
But a few days after, the market seems mildly positive.
Moving averages on the daily chart are now in alignment and bullish
BUT: MACD on weekly chart shows bearish divergence
So you decide, which way will it go?

DX strong breakout from 8.48Strong breakout for DX from 8.48 in the last few days.
Wait and see what the long term effect is.
