Exide Ltd is currently trading near its 200-day moving averageExide Ltd – Technical Outlook
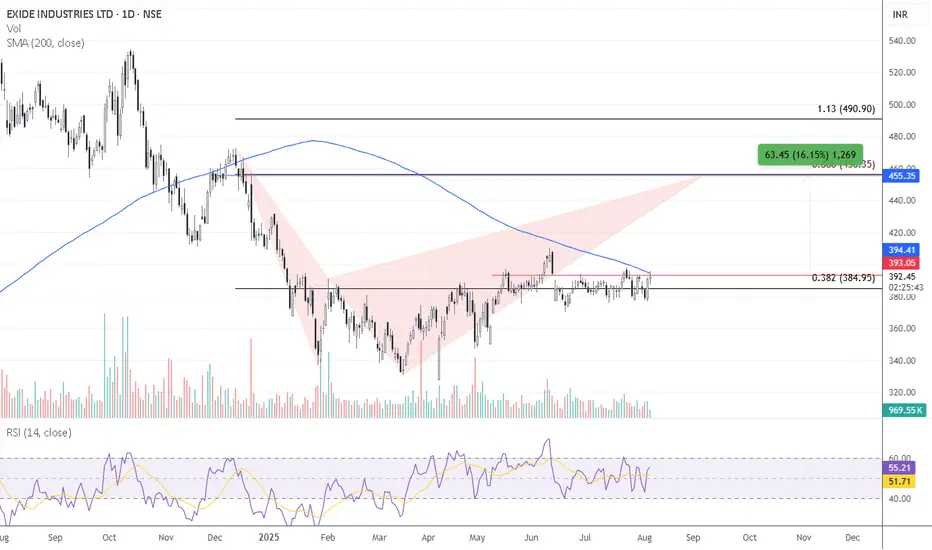
Exide Ltd is currently trading near its 200-day moving average, which is acting as a key resistance level. A decisive breakout above this level could trigger a positional upmove of approximately 15%, making it a strong candidate for a medium-term long trade.
Additionally, the stock has been consolidating within a narrow 5% range, indicating a phase of accumulation. A breakout from this sideways range could present a short-term swing trading opportunity.
Actionable Insight:
Keep Exide Ltd on your watchlist for both positional and swing long trades, contingent on a breakout above key resistance levels.
Shark

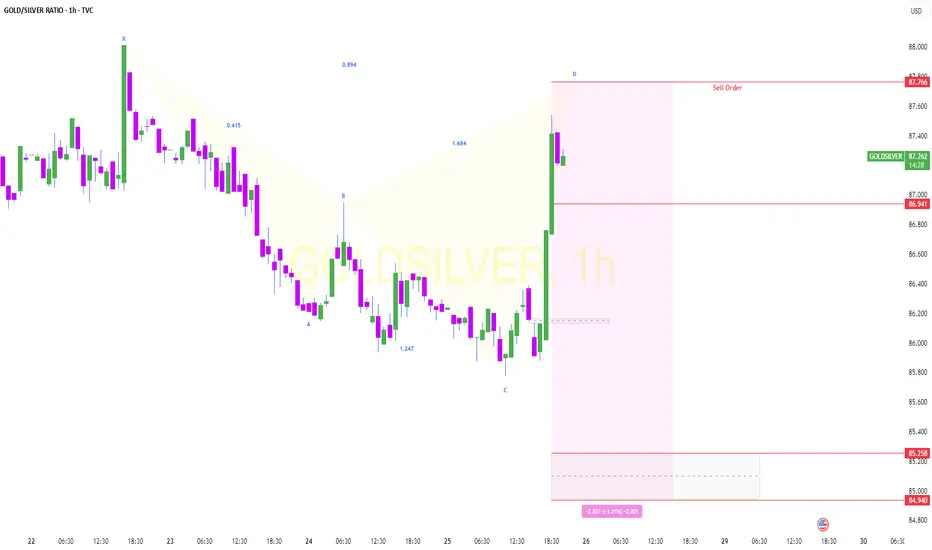
GOLDSILVER Short .GOLDSILVER Index may fall from 87.77 towards target (order block zone), based on shark pattern.
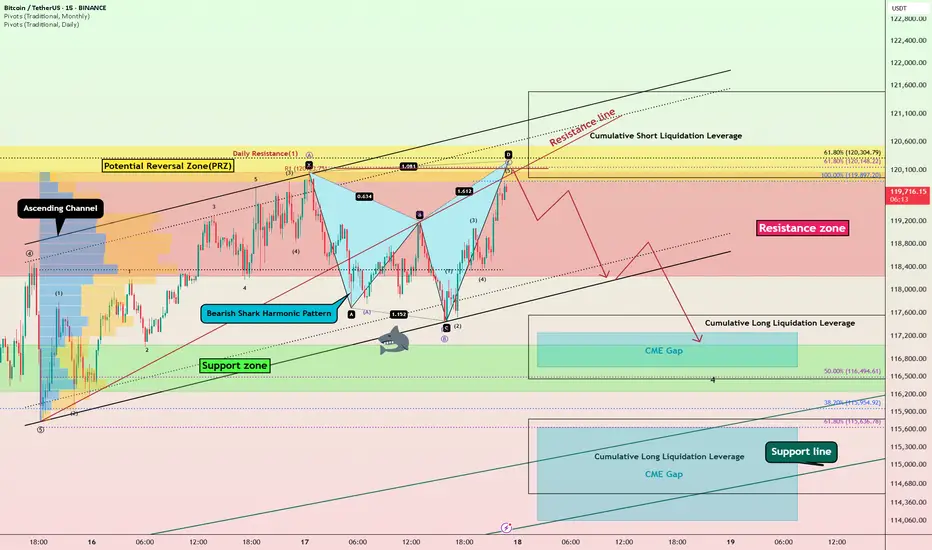
Bitcoin Bearish Shark Detected – CME Gap Below $115K in Sight?Today's analysis is on the 15-minute timeframe , following the previous analysis I shared with you on the 1-hour timeframe .
Bitcoin ( BINANCE:BTCUSDT ) is currently trading in the Resistance zone($120,100-$118,240) near the Potential Reversal Zone(PRZ) and Cumulative Short Liquidation Leverage($121,490-$119,965) .
From a technical perspective , it looks like Bitcoin is completing the Bearish Shark Harmonic Pattern on the 15-minute timeframe .
From an Elliott wave theory perspective, it looks like Bitcoin is completing the microwave 5 of wave C of the Zigzag Correction(ABC/5-3-5) .
I expect Bitcoin to start falling from the top of the ascending channel and at least decline to the lower line of the descending channel, and if the ascending channel breaks this time, we should wait for the CME Gap($117,255-$116,675)/CME Gap($115,060-$114,947) to fill.
Cumulative Long Liquidation Leverage: $117,556-$116,465
Cumulative Long Liquidation Leverage: $115,773-$114,513
Do you think Bitcoin can create a new ATH again?
Note: Stop Loss(SL)= $121,620
Please respect each other's ideas and express them politely if you agree or disagree.
Bitcoin Analyze (BTCUSDT), 15-minute time frame.
Be sure to follow the updated ideas.
Do not forget to put a Stop loss for your positions (For every position you want to open).
Please follow your strategy and updates; this is just my Idea, and I will gladly see your ideas in this post.
Please do not forget the ✅' like '✅ button 🙏😊 & Share it with your friends; thanks, and Trade safe.
Oil Futures Approaching Key Reversal Zone – Bullish HarmonicOil futures may be forming a bullish Shark harmonic pattern, with price approaching the potential reversal zone at point D. This pattern suggests a possible bounce if buyers step in around this area. If price action shows signs of support or a shift in momentum, it could offer a solid long opportunity. Look for confirmation like bullish candles or indicators turning up before entering. If the pattern plays out, it could provide a strong risk-to-reward setup.

SPY is about to dumpThere isn't much to say. Chart speaks for itself. Possible shark farming if we hit resistance at this trendline that was resistance since 2022. Not shown but its also at the 707 extension of the October '24 and April '25 low.

ABC Correction with Bullish Shark & Bat Type 1 Return Target 39KUptrend ABC Correction with Bullish Shark Retrace to .786 & Bullish Bat Type 1 Return Confirmation Higher Low. Full Fib Extension Target Top 39,000-39,600.

IREDA forming Shark pattern now towards 200 and the further....IREDA has formed shark pattern it has immediate target for 200. with SL 190.
Consecutive 3 candles close above 200 will open targets as below,
Target2: 210 / 220
Also in short term it will have possible target for 250 / 270.

Update Plan Gold next weekGold next week the main plan is to sell down. We will wait for a good entry point from there to get the shortest stop loss. If the price does not recover to sell, I will wait for a confirmation signal and accept to sell at a low price. Target is 3178

ONDO Bullish Shark to T1 & Potential Bearish BatTicker: ONDO
Timeframe: Daily
Entry: 0.84887
Stop Loss: 0.76000
Take Profit: 1.386
R/R Ratio: 6.05
Pattern: Bullish Shark & Potential Bearish Bat
DOT: 1
HSI: 46
AmpRSI: 41
This bullish shark has held up during the last few months while we form a potential bearish bat with a C point at the terminal bar of the bullish shark. While HSI and AmpRSI are under the 50 it signals that we may spend more time down here. I added a stop under the terminal bar and structure low

1000APU Shark to T11h showing bullish shark pattern. Confirmed XA level with 2 bullish dots. HSI over 50. AmpRSI under 50 but making higher lows. Stop just under C point wicks. TP at T1
Ticker: 1000APU
Entry: 0.178
Stop Loss: 0.1723
Take Profit: 0.1975
R/R Ratio: 3.83
Pattern: Shark
DOT: 2
HSI: 57
AmpRSI: 42

$NVDA - head and shoulders + possible bull shark harmonicOn my chart, NVDA appears to be potentially forming a head and shoulders pattern.
At the same time, an almost perfect bullish shark harmonic woukd comple around the target for the head and shoulders pattern.
Could be something, could be nothing.
But I'll be careful and not spend my money on NVDA just yet.
Positive earnings might invalidate this idea and send NASDAQ:NVDA to the moon instead.
Let's see what happens.

Harmonics & BTCBear Shark and break down on how to trade it. According to some sources this particular pattern has a higher win rate than most others in the harmonic family.

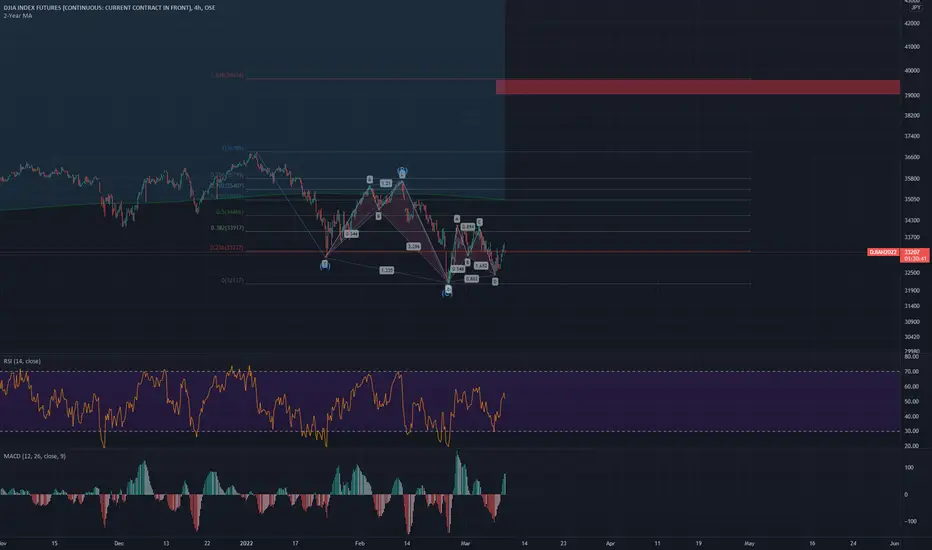
Japanese Shark Pattern Spotted!Based on the harmonic shark pattern & 0.88 Fibonacci level,
there's a Chance of a Dive from 37.8k towards Deeper targets.
📉 Stay tuned for updates!

DXY Bullish Shark PatternThe US Dollar Index is showing strength at 98.8%, poised to move decisively towards its upcoming targets.
🦈💸 Will it bite or blow bubbles?
Stay tuned for more financial drama!

The Bond Shark Attack.The bond yield has taken its first dive to the 0.88 level, and according to the ever-so-fishy harmonic shark pattern , we’re bracing ourselves for a dramatic tumble at the 1.138 level.
Now, what does this mean for the stock market? Well, think of it as a domino effect but with a flair for drama.
Investors might start sweating over higher borrowing costs, causing a ripple of caution through equities.

Golden Shark Caught in the 4-hour FVG Trap?It seems the "golden shark" is about to get tangled in the net of the four-hour FVG, meeting its bloody demise.
If this prediction holds true, brace yourselves for a dramatic plunge in gold prices—like a shark diving headfirst into a whirlpool.
Hold onto your treasure
because the waters are about to get choppy!

Bitcoin’s Wild Ride: The Shark vs. The Golden Ratio! In the previous idea, since Bitcoin was at the golden Fibonacci level, we anticipated a price correction and a downward trend.
www.tradingview.com
However, the bullish whales invalidated this expectation by breaking through and forming a green candlestick, confirming the validity of this support level.
This suggests that Bitcoin's price may now rise toward the 1.38 Fibonacci extension level before a potential decline begins.
The first target remains the golden Fibonacci level, followed by the whale's wings as the second target, and finally, the depths of the ocean as the third target.
This Idea underscores the importance of key Fibonacci levels and whale activity in determining Bitcoin's short-term price movements.

GBPUSD: Bearish Order FlowSpread out across multiple days, GBPUSD has been ranging now. Maybe it's time GBPUSD reached the peak of this distribution with this Shark Pattern. Let's see how it plays out.

Swimming Amongst SharksStarting with the boring range in February, BTC consolidated after making new ATHs on the day of President Trump's second term inauguration.
After a slow month of sideways action in February, we finally reached the apex of a symmetrical triangle and proceeded to dump, attempting at closing the breakaway CME gap @ ~76.5k. It quickly and violently bounced to 95k where we spent the next 51 days making new lows and ranging in the 80k region.
When we take a closer look at the fibonacci retracements of all of these moves, they are very technical.
When pulling a standard fibonacci retracement XA, we find that B falls perfectly within the golden pocket. Roughly 2 weeks later, we find ourselves at new range lows offering a very nice SFP reaction at point C which falls at the 1.272 fib expansion of AB.
In hindsight, this would have been the perfect place to get into a long position. But, unfortunately, I was looking for new lows around ~70k as this is where the 1.618 level was from a fib expansion of AB. This was during the time when tariffs were first being announced, causing major volatility across all markets. People were panic selling and calling for an economic crisis because of Donald Trump's tweets causing erratic behavior in markets.
We rally for the next 36 days offering no significant pullbacks to be able to get in on a long as it always seemed that we could get in on weakness as the rally produced a lot of SPs.
Now the BC expansion shows that we are nearing the end of this rally if this shark harmonic is to play out.
Waiting on confirmation of point D, but it is very possible that the high is in, and we start fulfilling this shark harmonic.
This would fall perfectly in line with the old adage "Sell in May and go away." or at least, first signs of weakness in May, and don't get chopped up.
There has also been a couple of potential events that could be classified as "black swan" that would affect the markets negatively like Coinbase announcing a user data leak, and Moody's downgrading of U.S debt.
Overall, we could see this shark harmonic be part of a HTF trend, coiling up before the next big move that breaks out near the end of summertime.
Always important to remember to practice proper risk management and that no trade is still a trade.

Harmonic Shark Pattern and Palantir's Stock CorrectionBased on harmonic analysis, specifically the Shark pattern, the price of Palantir (PLTR) stock may face a potential decline from the $129 mark.
This projection hinges on the identification of a completed Shark pattern, indicating a possible reversal zone.
Within this framework, the Fibonacci ratios of 0.88 and 1.138 are critical levels to observe.
The 0.88 retracement level suggests a potential area for a first retest and possible bounce, while the 1.138 level represents the pattern's leading edge, indicating a possible reversal point after a more significant extension.

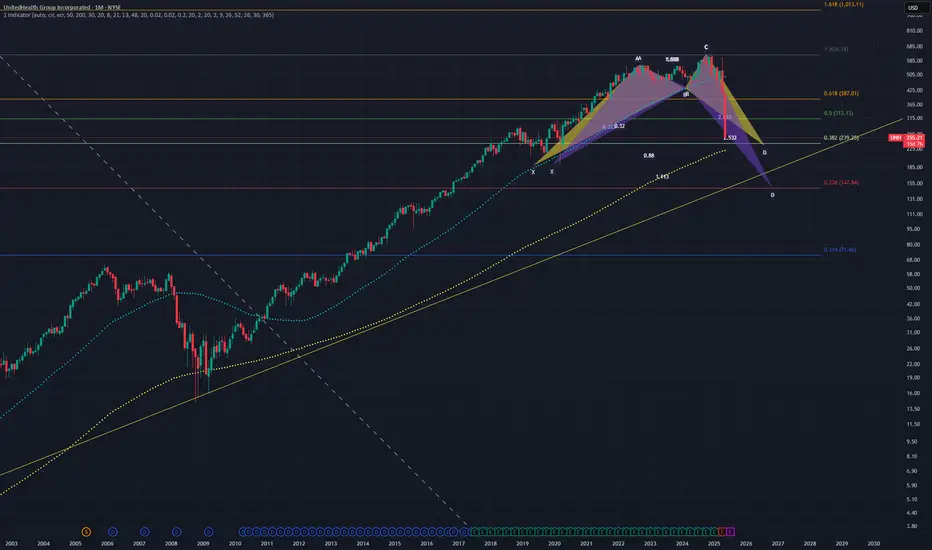
Where does the tumble stop for $UNHUNH has been in a free fall been absolute chaos for..reasons.
I see a possible Shark. Sharks can complete at the 886 or the 113. This happens to be around the 236 and 382 of the Macro fib retracement. We also have the 200 Monthly SMA.
So where does it stop tumbling? The 236, the 382 or the 200 Monthly SMA? I am betting it goes to the 236 and bounces sometime around earnings. Notice that trendline that goes back to 1998 that acts as support. I am betting it bounces around where the trendline and 236 intersect sometime around the next earnings. That's a good spot to go long.