LADYS another parabolic meme coinIf you didn't purchase LADYS when I drew comparisons to PEPE and SHIB:
Considering the chart, I anticipate a retest of the $0.0000002000 support level for price consolidation before the next significant movement.
Shib

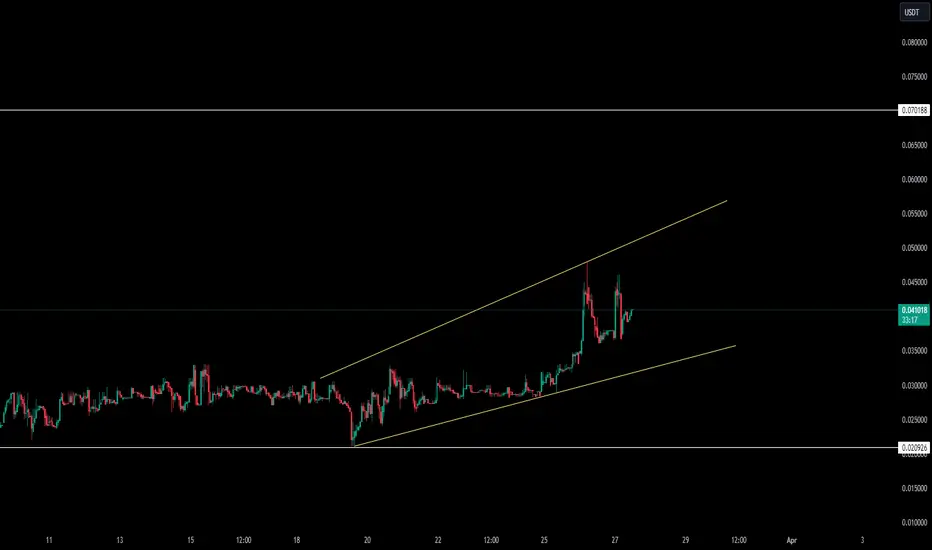
🔥INJ Is In A Massive Channel: Remember that AI BOOM❓Injective is one of the AI-related altcoins which grew by +800% after the channel breakout.
Now the price consolidating in a channel and you can buy it close to the bottom and sell at the top of the channel. The main question is at what side the channel will be broken!
Additional question, if the price have enough power to grow by 700% as the continuation of the bull flag pattern?
💥 will it repeat this time? everything depends on BTC, but it has a chance to do so.
like❤️ and follow
Check the links and get a BONUS from me👇

Will Shiba Inu coin break or bounce?The price of Shiba Inu (SHIBUSD) is currently hovering around $0.000028 , a critical support level. If the price can hold above this level, it could see a move towards $0.0000310 to $0.0000320 .
However, if the price breaks below $0.000028, it could pull back to $0.0000260 or even $0.0000230 .

SHIB Shiba Inu Technical Analysis PLUS Risk Management ConceptsIn this video, we analyse a potential trade idea for Shiba Inu. We delve into the trend, examine price action, evaluate market structure, and identify a potential entry point based on favourable conditions outlined in the video. Additionally, I discuss my risk management strategy. Traders who lack a robust risk management plan expose themselves to high risk and often have negative trading experiences. It's crucial to incorporate sound risk management into your strategy, as we emphasize in the video. As always, please note that this information is strictly for educational purposes and should not be construed as financial advice.

Shiba Inu (SHIB) - Bearish Short TermShiba Inu (SHIB) has fell below the 20-day EMA (£0.000022) on April 2, indicating that the bears remain active and the price could likely push Shiba down towards the £0.000019 mark near the 50-day EMA.
If the price rebounds off this level, the bulls will attempt to push the price to £0.000026. A break and close above this level will be the first sign that the bulls are on a comeback. The momentum may then attempt a rally to £0.000030.

🔥ID is Another TOP Altcoin on BinanceSpaceID fell by -85% from it's highs. That's much more then most of fresh altcoins on Binance (which has a top growth potential): WLD, ARKM, EDU etc.
It means that not to much people to pay attention to this altcoin and don't want to buy it now...still. The retailers want to buy such altcoins when it pump by 3-4x which is end of the growth.
The same pattern with Aptos supposes these target for ID:
1. $0.36 (+97%) - the key level
2. $1.05 (+457%) - the local high
💥 The bull market is alredy in action and will take just 1-2 years. Please use this time to your advantage!
like❤️ and follow
Check the links and get a BONUS🎁 from me👇

🔥SOL Is Close To The Buy Side And Trend Line SupportThe SOL price makes a local pump after test of the trendline. The biggest price support for Solana is at $16 (channel bottom and trendline).
Also pay your attention to the BUY and SELL side. If you open a trade at the bottom of the channel it would be better to close at least 30-40% at the top of it.
💥Bitcoin will show the direction for alts. So pay much attention to #1 crypto and Solana support levels.
If you bought it at the bottom of the channel and still hold, I would recommend you to not sell coins for now. At least 1 wave of growth will be soon.
like❤️ and follow
Check the links and get a BONUS🎁 from me👇

🔥SEI Is In Accumulation Area: The Rocket Will Launch SoonSei Network is one of the fresh altcoins on Binance with a huge growth potential. As it happened to many fresh altcoins, it follows the Aptos scenario.
The closest target is at $0.17 (+60%) and $0.37-0.4 (+251%). As fara s you understand there are just local targets. I expect 20-40x on a bull market at least.
💥$220M for altcoin is just a grain of sand in the desert. That's why fresh low-cap altcoins grow so high.
like❤️ and follow
Check the links and get a BONUS🎁 from me👇

SHIB INU SHORT SETUP FOR FEW DAYSAll major alt coins ate dumping hard, shib can be taken as short as given here.

Alikze »» KAVA | The trigger pullback is brokenIn time W1, after exiting the density and pulling back to the dynamic trigger, it will now have the ability to grow up to the red box area, and if it fails, it will succeed in continuing the upward path to the specified goals.
»»»«««»»»«««»»»«««
Please support this idea with a LIKE and COMMENT if you find it useful and Click "Follow" on our profile if you'd like these trade ideas delivered straight to your email in the future.
Thanks for your continued support.
Sincerely.❤️

SHIB, IS IT TIME TO TAKE SHIB BEHIND THE BARN? PREP FOR DIPPotential SHIB trade.
Would look something like this if it was to occur.
Chances that it looks this clean (orange arrow) is not likely.
However, if price rides a steep trend down, and we catch some mega support under some previous support, we're likely to have a very favorable trade.
Basically, this chart is prepping for a potential drop on the yellow circle trend breaks. SHOULD we see a drop, there is no reason to panic, as theoretically, if you viewed this chart, you should be prepared to buy this dip.
Now, does it go as low as .000007 or can it hold .000009. IMO, it is more likely to favor the lower price target.
This price target catching (Maybe even on a wick, within the week, or day), implies favorable odds all the way over .00001
Should this dip not occur, the price targets and trends are still relevant, however, the chart is primarily for prep of the potential drop showing on the charts.
If we reject off our top price target in our trade window, we'd look to buy the dip right around .0000098, waiting to see if we catch more support and see some higher numbers building.

SHIB's Bullish BreakoutRecent market analysis of SHIB indicates a bullish sentiment as the pair experiences an upward trajectory. The price action has shown a positive change, complemented by significant trading volume, pointing towards sustained interest and potential for further gains. The Bollinger Bands suggest a close watch, as the price approaches the upper band, typically a sign of overbought conditions. However, the confirmation of trend direction should be sought with additional indicators.
The MACD supports the bullish outlook, with the histogram above zero and the MACD line crossing above the signal line, indicating increasing bullish momentum. Additionally, the RSI sits below the overbought threshold, currently leaving room for further upward movement without being overextended.
A recent breakout above a key resistance level could signal the continuation of the bullish rally for SHIB, although it's important to seek further confirmation to validate this trend. Moreover, it's crucial to consider the correlation with Bitcoin's price movements, as shifts in the leading cryptocurrency often impact altcoins like SHIB.

Under PressureThe SHIB 4-hour chart indicates that SHIB is in a phase of equilibrium, with the indicators collectively suggesting a market in search of direction. The price is trading just below the simple moving average (SMA), which typically suggests a balance between buyers and sellers, but also signals that the bulls have not yet gained full control to push the price upward with conviction.
The proximity of the price to the upper Bollinger Band, while not touching it, implies that there is some buying pressure, but not enough to break the solid resistance. The volume is quite substantial, which sometimes can precede a significant move, but for now, it hasn't translated into a breakout, which is what traders might be watching for.
The Stochastic Oscillator and the Relative Strength Index (RSI) are both in neutral territory. This alignment shows that while there has been recent buying and selling activity, neither side is dominating, leading to a consolidation pattern on the chart.
Given that the MACD line is at parity with the signal line, as indicated by the histogram at zero, there's no immediate momentum favoring either a bullish or bearish move. This, combined with the RSI and Stochastic Oscillator’s neutral readings, paints a picture of a market that is currently undecided.
Overall, SHIB is in a holding pattern, with the indicators waiting for a catalyst that could define the next clear move. The key levels to watch are the solid resistance above and the strong support below. A break above the resistance could signal a shift to a bullish sentiment, while a drop below the support could usher in bearish momentum. For now, the indicators suggest watchfulness and caution as SHIB navigates this zone of indecision.

CENNZ NEW INCREASE VOLUMECentrality (CENNZ) shows a new increase in volume, which could be confirmed in the coming time frames.
We will follow the coin to see if it's able to confirm.
The reason for the volume is the trend data that this coin shows.
This coin is at basic choice on daily trends.
This coin can have stable volume in the start
🔥MEME Copy APT Before +300% Pump: Will It Happen Again❓🔥 MEME is a fresh altcoin on Binance and very popular Twitter account with 2.3M of followers. This is a very huge community which will pump the price after its pullback.
MEME can make a pullback by -60-70% and it should be a signal for you to pay the attention to this memecoin. Previously, Aptos, Worldcoin, Pepe, Shib (fresh altcouns) was pumped after such pullback by 100-400%.
💥 Altcoin with such audience and popularity as MEME will be a top gainer at a euphoria phase of a bull market.
like❤️ and follow

DOGE Dogecoin May Be In For A Deeper CorrectionShort term Doge looks like its in trouble. It looks like a big move down is imminent. Bearish pennant, bearish cross 50 over the 100. A significant move down in Doge and the whole market is about to happen in my opinion. I could be wrong and this is a fake out and we blast to the upside but look at Litecoin and what happened when the 50 crossed over the 100 just recently and now the 50 is crossing over the 200 on Litecoin. If Bitcoin drops to 50s then expect this to happen 100% and possibly even lower targets as the new people who just got in with their rent money sell at the bottom. Could be a fire sale if a person is in the right place at the right time. Not financial advice just my opinion , Good luck out there
A closure above the 100 SMA blue line and then the previous high on a 4 hour candle would invalidate this whole thing and Doge will continue its rally to crazy new all time highs. Im leaning towards a correction on this one.
WEAR AN EXTRA SHIRT IN CASE YOU LOSE THE FIRST ONE :)

#SHIB possible breakoutIf we see a daily candle above the white trendline we can see a good rally for #SHIB
I'm looking at easy 25% without leverage.
This is only IF the price breakout from the trendline.
DYOR and stay safe! Follow if you enjoy my ideas. Thanks!

Cryptolean Shiba Inu SHIB UpdateNot much changed since the last update, since Shiba Inu found a support at $0.00002399-$0.00002509.
It is struggling to break through the resistance of $0.00002769 for the last 5 days though.
A bullish break-out of $0.00002769 will result in a move to re-test $0.00003107.
However, a bearish break-out of $0.00002399-$0.00002509 will push SHIB price lower towards $0.00002171 and $0.00001911.

SHIBAUSD 6HSHIB ~ 6H 📈
CRYPTOCAP:SHIB Make a purchase after successfully breaking this resistance line or buy after Retesting the nearest support. with a minimum target of 15%+

ETH Ethereum Possible Long Term OutlookETH looks just like Luna Classic before the drop in a massive rising wedge, kinda like SOL too before its dump to $20. Bearish divergence on the weekly. I dont know what would cause this drop but iI think ETH days are nearing an end. Its clunky and fees are too hard for the everyday person to use. Something will take its place or a tweak to the blockchain crashes the whole thing. Im not sure but i like to speculate on what the news will be to make the chart pattern do this. I saw this in the LUNA chart when it was at highs and people thought I was crazy when I said its going to under a dollar. Go back and look at it. Same thing with SOL I called the last top almost perfectly.
Also think of how many people stuck in staking if this happens, they wouldnt have time to get out. Ask yourself why institutional investors dont stake their ETH. :) Not financial advice just my opinion. Good luck out there.

SHIB Monthly Close Above $0.000027 Key to Potential GainsShiba Inu (SHIB) is showing signs of life on the monthly charts. I am closely watching the price action, with a potential breakout hinging on the upcoming monthly close.
Crucial Level: $0.000027
A monthly close above $0.000027 could be a bullish catalyst for SHIB. If this level is breached, I project a price surge towards a range of $0.000037 to $0.000045. This represents a potential upside of 37% to 67% from current levels around $0.000024.
Downside Risks Remain
However, caution is advised. A monthly close below $0.000025 could trigger a sell-off, pushing SHIB down to the $0.000018 support level. This translates to a potential decline of 25% from current prices.
I recommend DYOR before trading and investing it.

SHIB look bearishConsidering the lower L's, it seems that SHIB intends to move towards the specified demand
By maintaining the supply range, it can drop the demand side.
Closing a daily candle above the invalidation level will violate this analysis
Note that the financial market is risky, so:
Do not enter any position without confirmation and trigger.
Do not enter a position without setting a stop.
Do not enter a position without capital management.
When we reach the first TP, save some profit and try to move the stop continuously in the direction of your profit.
If you have any comments please post them, comments will help us improve our performance
Thanks

Look Like Shib is ready to goLook Like Shib is ready to go because shib break his trend line and now look like shib prepare to boost now .
lets see if you see this post suites you then hit the follow and boost button
