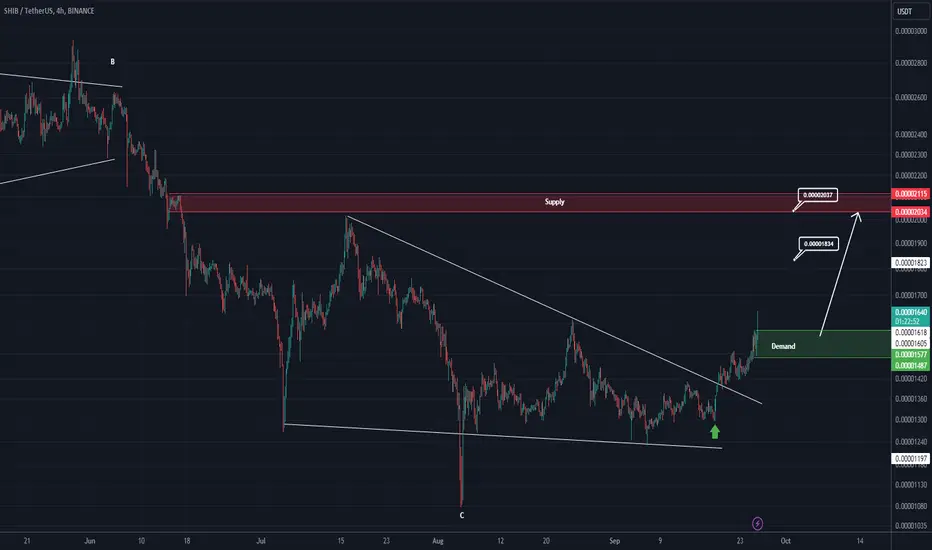
SHIB buy/long setupAn important trigger line has been broken on the chart. I have a bullish iCH chart. The larger structure is bullish.
We should look for buy/long in the support ranges.
We are looking for buy/long in the specified range of demand.
Closing a daily candle below the invalidation level will violate this analysis
Do not enter the position without capital management and stop setting
Comment if you have any questions
thank you
Shibusd

SHIB looks bullish (1D)SHIB seems to be bullish. From where we put the red arrow on the chart, it looks like a triangle is formed, and we are now in wave E of this triangle.
By hitting the green range, we expect another pump from SHIB.
The targets are marked on the picture.
Closing a daily candle below the invalidation level will violate this analysis.
For risk management, please don't forget stop loss and capital management
When we reach the first target, save some profit and then change the stop to entry
Comment if you have any questions
Thank You

#SHIB/USDT#SHIB
The price is moving in a bearish channel on a 4-hour frame and is adhering to it to a large extent
The price rebounded well from the green support area at the support level 0.000022000, which is a strong level.
We have a trend to hold above the Moving Average 100, which is strong support for the rise
We have very strong oversold resistance on the RSI indicator to support the rise, with a downtrend about to break higher
Entry price is 0.00002350
The first goal is 00.00002570
The second goal is 0.00002700
The third goal is 0.00002900

SHIBUSDT Price Breaks Flag Pattern!SHIBUSDT has broken out of a bullish flag pattern on the 1H chart and is trading above the 100 and 200 EMAs. The price surged by 60% after breaking through the resistance zone and has been forming a bullish flag pattern over the last 5 days. Today, the price broke through the flag's resistance, and after a minor pullback, a significant bullish move is expected.

Analyzing the Impacts of Shiba Inu's Ambitious US Hub Plan
Shiba Inu's Bold Vision for a US Blockchain Hub
Shiba Inu, the popular meme coin, has recently made headlines with its ambitious plan to establish a strategic blockchain innovation hub in the United States. This bold move, proposed by lead developer Shytoshi Kusama, has sent ripples through the crypto community, leading to a significant 23% surge in the price of SHIB.
A Silicon Valley for Crypto
Kusama's vision is to create a "Silicon Valley for crypto" within the US, fostering innovation, job creation, and economic growth. The proposed hub aims to attract top talent, startups, and investors to the United States, solidifying its position as a global leader in blockchain technology.
The proposed hub, dubbed S.H.I.B., is estimated to cost several billion dollars over a 5-10 year period. However, Kusama believes the long-term benefits far outweigh the initial investment. The hub is expected to generate significant economic activity, create thousands of jobs, and attract numerous blockchain projects to the United States.
Key Components of the S.H.I.B. Plan
• Infrastructure Development: The hub will invest in state-of-the-art infrastructure, including high-speed internet, data centers, and research facilities.
• Economic Incentives: The plan includes tax breaks, grants, and other incentives to attract businesses and talent to the hub.
• Talent Development: The hub will focus on education and training programs to develop a skilled workforce in blockchain technology.
• Regulatory Framework: The hub will work closely with regulators to create a clear and supportive regulatory environment for blockchain businesses.
• Sustainable Practices: The hub will prioritize sustainability, incorporating green energy solutions and eco-friendly practices.
The Impact on SHIB
The announcement of the S.H.I.B. plan has had a significant impact on the price of SHIB. The cryptocurrency has experienced a 23% surge in value, reflecting investor enthusiasm for the project. This surge highlights the potential of the Shiba Inu ecosystem and its ability to drive innovation and growth in the blockchain industry.
The Broader Implications
Shiba Inu's ambitious plan is not only significant for the cryptocurrency but also for the United States as a whole. By attracting top talent and fostering innovation, the hub could help the US maintain its competitive edge in the global technology race.
Moreover, the S.H.I.B. initiative could have a positive impact on the broader cryptocurrency industry. By creating a supportive ecosystem for blockchain businesses, the hub could accelerate the development of new technologies and applications.
Conclusion
Shiba Inu's proposal for a strategic blockchain innovation hub in the United States is a bold and ambitious endeavor. If successful, the hub could transform the US into a global leader in blockchain technology, creating significant economic and social benefits. The 23% surge in SHIB price reflects the market's optimism for the project and its potential to drive future growth.

SHIB IS PRIMED FOR A MASSIVE 123% MOVE HIGHERCRYPTOCAP:SHIB
SHIB IS BREAKING OUT AND IT'S A BUY RIGHT NOW!
ITS A #HIGHFIVESETUP MEANING THE FOLLOWING:
1.) BULLISH uptrend on MACD (blue over orange
2.) BULLISH uptrend on RSI (higher lows)
3.) BULLISH uptrend on Stoch (red over yellow)
4.) We have a volume shelf with a volume gap
5.) Breakout on the symmetrical triangle pattern
Price Targets for this Weekly chart:
PT1: 0.000029584
PT2: 0.000044097

Shiba Inu breaking upward from channel; over halfway to targetSheba is blasting off so quick by the time I got around to posting a chart about it t’s already 3/4ths of the way to the breakout target. *not financial advice*

SHIB/USDT: Bullish Inverse Head and Shoulders Pattern Breakouthello guys.
Pattern Formation: The inverse head and shoulders pattern, with a well-defined neckline, indicates a bullish reversal signal.
Breakout Confirmation: Price has broken above the neckline, a key resistance level, which suggests a continuation toward higher targets.
Price Targets: If the bullish momentum holds, the next major resistance is around $0.00003700, with the potential to reach $0.00005700.
Risk: Failure to maintain above the neckline could result in a pullback, potentially re-testing lower levels before any further bullish movement.

Is SHIB (Shiba Inu) the Next Big Player in the 2024 Bull Market?
Shiba Inu (SHIB), the popular meme coin, has been making significant strides in the cryptocurrency market. While it may not be as widely recognized as Bitcoin or Ethereum, SHIB has garnered a dedicated following and has shown remarkable resilience. As the 2024 bull market unfolds, several signs suggest that SHIB could emerge as a dominant force, potentially triggering a 90% price surge.
1. Strong Community and Social Media Presence:
One of the most significant factors driving SHIB's potential is its passionate and active community. The SHIB Army, as they are known, has been instrumental in promoting the coin and generating significant buzz on social media platforms. This strong community support has helped SHIB maintain its relevance and attract new investors.
2. Technical Analysis and Chart Fractals:
Technical analysis provides valuable insights into potential price movements. Chart fractals, which are recurring patterns in price charts, can be used to identify potential future price trends. Recent analysis of SHIB's chart suggests that the coin may be forming a bullish pattern, similar to historical patterns that preceded significant price surges.
3. Layer-2 Solutions and Ecosystem Expansion:
Shiba Inu has been actively exploring Layer-2 solutions to enhance its scalability and transaction speed. By leveraging these technologies, SHIB can address the limitations of its underlying blockchain and attract a wider range of users and developers. Additionally, the expansion of the Shiba Inu ecosystem, including the development of new projects and partnerships, can further fuel its growth.
Potential Challenges and Risks:
While the future of SHIB appears promising, it is essential to acknowledge potential challenges and risks:
• Market Volatility: The cryptocurrency market is inherently volatile, and sudden price swings can occur without warning. Investors should be prepared for potential price fluctuations.
• Regulatory Uncertainty: The regulatory landscape for cryptocurrencies remains uncertain, and any unfavorable regulatory developments could negatively impact the price of SHIB.
• Competition: The meme coin market is highly competitive, and the emergence of new and innovative projects could divert investor attention away from SHIB.
Conclusion:
Shiba Inu's strong community, promising technical analysis, and ongoing development efforts position it as a potential breakout candidate in the 2024 bull market. However, investors should approach SHIB with caution and conduct thorough research before making any investment decisions. By understanding the risks and rewards, investors can make informed choices and maximize their potential returns.
Disclaimer: This article is for informational purposes only and should not be construed as financial advice. It is important to conduct thorough research and consult with a financial advisor before making any investment decisions.

Is Shiba Inu Poised for a Bull Run Amidst Meme Coin Craze?Is Shiba Inu Poised for a Bull Run Amidst Meme Coin Craze?
Shiba Inu (SHIB), the popular meme coin, maintained its steady price trajectory on Wednesday as the broader cryptocurrency market experienced a rebound. While most meme coins, including Dogecoin (DOGE), bounced back from recent declines, SHIB held its ground, hinting at a potential bullish trend.
Golden Cross on the Horizon
One of the most intriguing developments for SHIB investors is the looming golden cross pattern. This technical analysis indicator occurs when a short-term moving average (MA) crosses above a long-term MA, signaling a potential bullish trend reversal. In the case of SHIB, the 50-day MA is approaching a crossover with the 200-day MA, which could ignite a significant price surge.
Why SHIB Might Soar Higher
Several factors could contribute to a potential rally in SHIB's price:
1. Increased Burn Rate: A recent surge in the SHIB burn rate, which involves permanently removing tokens from circulation, has boosted investor sentiment. As the supply of SHIB decreases, its potential value could increase.
2. Community-Driven Initiatives: The strong and active Shiba Inu community continues to drive innovation and support the project. Community-led initiatives, such as SHIB: The Metaverse, can attract new investors and fuel price growth.
3. Market-Wide Bullish Sentiment: A broader cryptocurrency market rally, fueled by positive news and regulatory developments, could benefit SHIB and other meme coins.
4.
Analyst Predictions and Potential Upside
Cryptocurrency analysts are increasingly bullish on SHIB's future. Some experts predict a 10-fold surge to its yearly peak, while others anticipate a massive bullish wave following recent price gains. These optimistic forecasts highlight the potential upside for SHIB investors.
Cautious Optimism
While the technical indicators and analyst predictions are promising, it's essential to approach investing in SHIB with caution. The cryptocurrency market is highly volatile, and meme coins are particularly susceptible to sudden price swings. Investors should conduct thorough research and consider their risk tolerance before making any investment decisions.
Conclusion
Shiba Inu's steady price action amidst a broader market recovery and the impending golden cross pattern suggest a potential bullish future. Increased burn rates, community-driven initiatives, and a positive market sentiment could further propel SHIB's price. However, investors should exercise prudence and diversify their portfolios to mitigate risks.

SHIB, Preppin for BIG MOVES, and that's an understatement!SHIB is starting to register massive net buy volume this week -- and we're only half way of the week. Based on metrics, the coin is starting to shift trend on longer time spectrum with surging net positions in play.
SHIB is currently sitting at 1.0 FIB LEVEL. This is beyond bargain/discount factoring in longer timeframe -- which makes the current level more appealing price entry-wise.
It is currently hovering at a 2-year longstanding strong major support of 0.0000070-0.0000080 level. This should be a firm base for the incoming series of ascend.
Histogram gap jump height is unusual -- conveying anticipation of a significant upside price valuation.
Bubble up volume (bottom indicator) re-appeared after almost 3 months, first one since April 2023. Price movements are thinning out -- ripe for break.
Spotted at 0.0000080
TAYOR.
Safeguard capital always.

SHIBA - Bearish Signal | Weekly TimeframeShiba Inu has formed a bearish double top candle stick pattern in the weekly timeframe.
This will likely lead to a drop, especially considering that a key diagonal support has been lost - marking the first invalidation of higher highs, in other words short term BEARISH:
We've seen something similar previously, leading to a near -60%drop. Although I really doubt we'll see that kind of pullback (considering it was in the heart of the bearish cycle) I do think a -10% to -15% is possible:
_______________________
BINANCE:SHIBUSDT

SHIB Shiba Inu Potential breakoutIf you haven`t bought SHIB before the previous rally:
nor sold the top:
Analyzing Shiba Inu’s chart, it appears to be entering a phase of accumulation following the conclusion of a falling wedge pattern, which is often a bullish signal.
Given this setup, I anticipate a potential upward movement in SHIB over the next two weeks as buying pressure builds.
The price action suggests growing momentum, and I’m targeting the next key resistance level at $0.00001500.
This zone could act as a pivotal point for the next leg higher if the bullish sentiment continues to strengthen.

ShibaInu SHIB price at critical zoneJust look who decided to wake up - it's our sweet #ShibaInu
CRYPTOCAP:SHIB price is near the upper boundary of the falling channel, it can break through to $0.000020-0.000021
But a safe medium-term purchase, after the OKX:SHIBUSDT price breaks out and fixes outside the channel and closer to $0.000015
This is depicted schematically with a blue zigzag)
_____________________
Did you like our analysis? Leave a comment, like, and follow to get more

Doge - 4H correction phaseBINANCE:DOGEUSDT Doge has completed a 40% rally in just a few days, grabbing liquidity above a key high. Now, we can expect a pullback from this resistance zone. Keep an eye on price action for potential corrections.

SHIB SHORT IDEA - 1000SHIB FUTURES SHORTPrice hit to supply zone and looks pretty heavy imo. LTF market structer shifted and it gave me confident to enter short side. I am also awaiting bitcoin to drop a litle (see my bitcoin chart on my profile) so they can work together.
Targets can be seen on the chart.
Nothing i share is financial advice. Education purposes only.

SHIB 25-28% Gains imminentAccending triangle formed,
support formed at .1706+- level,
Needs to hold over .1720 +- over the next day or so and continue up the trendline.
Resistance at .1840 level,
Second key level of resistance at .2000,
Target price .2100
Timeframe over the next 10 days,

shibusdt → a short positionhello guys!
I suppose Shiba hunted the last level!
it is a risky position but I will sit on the short position for this situation!
___________________________
✓✓✓ Always do your research.
❒❒❒ If you have any questions, you can write them in the comments below, and I will answer them.
❤︎ ❤︎ ❤︎And please don't forget to support this idea with your likes and

SHIB Is BullishFrom where we put the green arrow on the chart, it looks like a big bullish triangle is over.
By maintaining the green range, it can move towards the targets.
The targets are marked on the chart.
Closing a daily candle below the invalidation level will violate the analysis
For risk management, please don't forget stop loss and capital management
When we reach the first target, save some profit and then change the stop to entry
Comment if you have any questions
Thank You
SHIB Major Trend. 09 2024Logarithm. Time frame 1 week.
Line chart , without market noise.
Secondary trend. Channel Zone.

SHIB/USDT Secondary trend. Channel. 14 months accumulation.Logarithm. Time frame 1 week for clarity of the channel range. 3 weeks ago, there was an exit of the price under the support of the accumulation channel by a large percentage. Many long positions were liquidated.
The chart shows the percentages from this reversal zone to the channel resistance, as well as the average profit percentage when exiting this accumulation channel from the average set price to the significant first resistance.
This is what the chart of this cryptocurrency looks like on a line chart without the “market noise” volatility.
Accumulation Zone. Pump/Dump and compliance with risk and money management.
Remember, this is a pamp/dump meme cryptocurrency, which even at -93% down from peak pumping and with a set zone of about 14 months (!) is at an inadequate profit. That's why follow risk management in your work.
It is more rational to work on such cryptocurrencies, not with stops (high volatility, slippage at high %, high probability of beaten out before price increase, the large value of stop is meaningless, they can beat out at -2% and -40%), and work from average buy/sell price (only spot!) with reasonable observance of money management.

Can SHIBA have its 2020/21 DOGE moment??Shiba Inu (SHIBUSD) is making a strong bullish case this week as not only did it break above its 1W MA50 (blue trend-line) for the first time since mid-August but is also testing the Top of its 7-month Channel Down, all while being supported by the 1W MA200 (orange trend-line).
This Channel Down is, on the larger scale, nothing but a Bull Flag, the kind of pattern that precedes aggressive rallies and bullish extensions. In fact if we compare Shiba's Cycle since its October 2021 Top, we see strong similarities with Doge's (DOGEUSD) true expansion Cycle in 2018 - 2021, where it achieved its strongest recognition/ adoption. An (a) top led to a (b- f) Channel Down that priced the Cycle's bottom and after a 1W Golden Cross, it formed the Bull Flat that SHIB is in right now, which initiated its hyper aggressive parabolic rally to the Cycle Top.
As a result, being still below its 0.5 Fibonacci retracement level, Shiba is massively undervalued in cyclical terms and technically if the Bull Flag breaks to the upside, the rally that will follow can target the 1.5 Fibonacci extension at 0.00035, just like Dogecoin did in January 2021.
Do you think it will replicate this pattern or the market cap would be unrealistic?
-------------------------------------------------------------------------------
** Please LIKE 👍, FOLLOW ✅, SHARE 🙌 and COMMENT ✍ if you enjoy this idea! Also share your ideas and charts in the comments section below! This is best way to keep it relevant, support us, keep the content here free and allow the idea to reach as many people as possible. **
-------------------------------------------------------------------------------
💸💸💸💸💸💸
👇 👇 👇 👇 👇 👇

SHIB: Struggling to Break Key ResistanceSHIB has shown a consolidation pattern in the last several hours, trading at $0.00001365, with both the 1H and 4H data indicating weak momentum and slight bearish tendencies. Recent whale activity and general meme-coin market interest have supported SHIB’s price, but technicals show a need for stronger momentum to push the price higher.
1H Chart Breakdown: Weak Momentum and Consolidation
On the 1-hour chart, SHIB has been hovering near its Bollinger Band Basis of $0.00001376, unable to gain significant bullish momentum. The RSI at 38.52 signals a slightly oversold condition, while the Stochastic Oscillator (%K at 3.85) is deep in oversold territory, hinting at a potential short-term bounce. However, the MACD is flat, and the ADX at 11.46 indicates a weak trend, suggesting the price might remain in a tight range unless there’s a volume spike.
Resistance: $0.00001387 (Upper BB)
Support: $0.00001365 (Lower BB)
4H Chart Breakdown: Bearish Momentum Building
The 4-hour chart is showing more caution, with SHIB sitting slightly below the Bollinger Band Basis ($0.00001369). The RSI at 49.70 is neutral but points toward a weakening bullish trend, while the Stochastic Oscillator (%K at 25.76) is still in oversold territory, suggesting potential for a brief upward correction. However, the MACD histogram is negative, indicating growing bearish momentum, while the ADX at 12.22 suggests the trend is still relatively weak.
Resistance: $0.00001411 (Upper BB, Parabolic SAR)
Support: $0.00001327 (Lower BB)
Support and Resistance Levels (Across Timeframes):
Immediate Resistance (1H & 4H): $0.00001387 - $0.00001411 (Upper BB, SAR level)
Immediate Support: $0.00001327 - $0.00001365 (Lower BB)
Actionable Strategy: Range-Bound Trading with Weak Momentum
Bullish Scenario:
If SHIB breaks above $0.00001387 (1H Upper BB), it could attempt a push toward $0.00001411 (4H resistance and SAR level). For traders seeking quick entries, look for a bounce confirmation with rising volume.
Bearish Scenario:
A failure to hold support at $0.00001365 could see SHIB testing the $0.00001327 level (Lower BB on 4H), and a break below this could open doors to more significant downside toward $0.00001280.
Action Point: Given the weak ADX and neutral momentum, consider range-bound trading strategies, setting tight stop-losses around $0.00001327 and aiming for modest profit-taking near $0.00001387.
