SHIB - Bullish Price Setup for December & JanuarySHIB is getting support at a key region between 2900-3300, which has been a strong resistance region in the month of October. Turning this resistance into support should give us a great few months ahead for the Shiba Army and SHIB Bulls. The key price targets are the red line (which has been giving us strong resistance in the past and yellow line (the previous all time high).
Shibusd

SHIB/USD - Reversal Postponed by Bears. Try Again. 😋Shiba Inu seemed prime for a more considerable move upwards but was halted as the entire market declined.
Key Support levels: $0.000030, $0.000022
Key Resistance levels: $0.000034, $0.000037
SHIB found support on the $0.000034 level and seemed primed to move higher when the bears took over the market. This level was turned into resistance as SHIB’s price fell with the overall market. For this reason the new support is now found at $0.000030.
SHIB was very close to completing a bullish crossover on the daily MACD, but this recent drop stopped it from happening. It could make another attempt later when the overall market conditions are more favorable. Either way, the price is stuck in a large descending channel and a break above it is necessary to reverse the bearish trend.
Trading Volume: The volume remains low and interest will only return to SHIB once the price action becomes more exciting.
RSI: The RSI marked a higher low during this most recent drop on the daily timeframe. This shows that buyers are keen to return to SHIB if market conditions allow.
MACD: The daily MACD is trying to curve up in preparation for a bullish crossover. With a bit of luck, SHIB may be able to do so and bring much needed volume and momentum back.
Bias
The bias for SHIB is neutral in the short term, but it’s important to keep a close eye on the MACD.
Short-Term Price Prediction for SHIB
Even if SHIB manages to rally, it’s important to remain mindful of the larger structure represented by the descending channel which will likely act as resistance to any bullish move. Only a break above this channel will give sufficient confidence in such a rally. Otherwise, SHIB may continue to bounce between the key levels as it strives to stop the downtrend.
Like and follow if you liked my idea!

SHIBUSDT - UP TO 60% GAINS IN THE SHORT TERMEmissary over here.
Hello again everyone.
Today we take a look at Shiba Inu.
Price has been inside a big demand zone (red box), inside a bid bullish triangle. Whales have been buying a lot at this price.
Buy while you can at this level. After breakout you can still buy at 0.00003799 retest, thi scenario I think is very likely to happen.
Next important offer zone is at 0.00005338.
If you like my work give it a thumbs up and leave a follow for more everyday analysis. Remember the message never sleeps.
Also I'd like to hear your opinion in the comments.
Remember this is no financial advise, DYOR and trade at your own pace and risk.
Farewell

SHIB still holding strong, large whale purchases to note. Large volumes of SHIB being bought and a breakout finally underway. I have an upper target to focus on but please watch BTC on small to medium time frames for guidance. NFA, DYOR
Buy shiba after breakout 🚀Shiba has been moving inside a huge falling wedge for a long time which is a bullish pattern.
Buy after breakout
Good luck

SHIBUSDT - 3 TPs for this pumpBINANCE:SHIBUSDT
1H trend chart
-
SHIB is pumping after retesting Fib 0.382 and breaking out the downtrend line.
Therefore, we can set TPs for it with Fib, trading strategy as below.
-
Profit Targets:
a) 0.3878----Fib(1)
b) 0.4130~0.4232----Fib(1.272~1.382)
c) 0.445----Fib(1.618)
Stop losses:
a) 0.3377-----Red horizontal ray
-
If you like this analysis, smash the "like button" and leave a comment below to share your thoughts
or let me know what crypto you want to see!
Trading is a reflection of yourself. Learn more daily and be ready for every opportunity.
Have a nice trading!

Its all up to this level... If this level doesn't hold there will be further downwards movement... and instead of losing another 0 we will end up gaining another 0 which will be a big problem...

Putting in a Buy Limit Order on Shiba Inu Coin @.00002937Traders,
Shiba Inu looks to have almost reached my target down. I am putting in a Buy Limit order at .00002937 and hoping to capture the re-entry here either tonight or Sunday night. If I don't catch it on one of these nights, I will cancel my order and re-assess.
You can view my current target sell areas (subject to change) on the chart.
Best of luck traders!

SHIB's healthy consolidation! Establish a range between .xxxx29 and .xxxx44! This will likely consolidate in a pennant for another few weeks, don't expect a spike back to the highs just yet. I'm not gonna use hard stops on this beast but below 29, I'll likely exit. Let me know any thoughts about possible divergence anywhere. (I'm also building a position in ELON and DOGE once again, let's see what these puppies can do within the next six months.) Cheers mates!

Shiba Inu Coin Offering a Buy Opportunity Before Leaping 11xShiba Inu token (SHIB-USD) has finally pulled back in a more complete Wave II after a powerful, mania-inducing Wave I. This Wave II pullback, shown in GREEN, may be over or it may have lower to go, but at any rate, once the I-II are set, we can make much more confident projections on where the extensions will take us. That said, it is a great time to buy SHIB, but it may be best to dollar-cost-average over the next several days to avoid any emotional attachment. This is a very high-risk play as this crypto has very little history, so please size your buys appropriately!
Once our pullback is complete, look for a Subwave 1 to take us between 0.00009 and 0.00017 for a 2x return. Expect the subsequent Subwave 2 to be sharp and deep before the Subwave 3 targets between 0.00053 and 0.00105 for an 11x return! Subwave 5 could eventually get us to 0.00159 to 0.00310, the returns for which I'm not even going to calculate right now.
Unlike with the other cryptos I track on my channel, I'm expecting SHIB to move very quickly and not align with the more established cryptos. As Elliott Wave patterns are fractal in nature, the time-duration ratios seen historically within SHIBUSD may repeat. If that is the case, expect the full wave structure to take 3x longer than the initial 5-wave impulse for Wave I, which would place the top around early February 2022. But of course, Elliott Waves are all about PRICE, not TIMING, so please take with a grain of salt! While I've pointed out several inflection points and targets, the rally may come and go before you realize it! So for that reason, be mindful of position size and keep an on this dog!
I use Elliott Wave analysis to project price levels for different assets and asset classes. EW is a form a technical analysis that is absolutely NOT based on fundamentals. Please be aware that this video is not intended to act as financial advice. I am not a trained or certified financial professional. You may invest based on a strategy tailored to your own skill and risk-tolerance levels.
#shibainu #shibainucoin #shibatoken #cryptocurrency

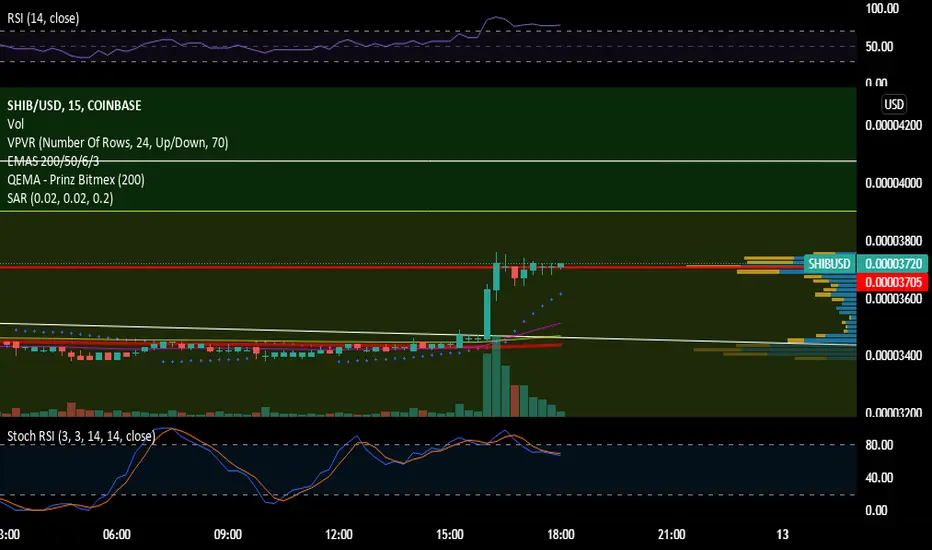
SHIB Shiba Inu: Staying Above The Support LineHello friends, today you can review the technical analysis on a 4H linear scale chart for Shiba Inu (SHIBUSD), a cryptocurrency.
Quick Analysis:
1) The price is supported by a multi-month trendline.
2) Recently the price broke out of a Falling Wedge Pattern and is currently moving upwards.
3) The price is headed into a heavily traded area as shown by the VPVR.
4) Volume is still low.
5) RSI (relative strength index) has room for growth. It recently completed a Double Bottom Pattern and is headed higher.
6) Please review the chart in detail as many of the analysis points are already shown on the chart.
What are your opinions on this?
If you enjoy my ideas, feel free to like it and drop in a comment. I love reading your comments below.
Disclosure: This is just my opinion and not any type of financial advice. I enjoy charting and discussing technical analysis. Don't trade based on my advice. Do your own research! #cryptopickk

Shiba's bright futureAs you can see, Shiba has been in a triangle for a long time. Given the recent great fundamentals for this currency, I expect good growth before Christmas.
A bright future awaits this currency. Be a holder
Other currencies are on their way, and bitcoin can no longer stop them from growing.
-----------------------------------------------------------------------------------------------------
Support area: 0.000032 to o.000034
TP1: 0.000045
TP2: 0.000058
TP3: 0.000088
TP4: 0.00011


SHIB/USD - At a crossroad, can it break the downtrend? 😱Shiba is in a massive descending channel as shown by the chart. Lower lows and lower highs have been a constant in the past weeks.
However, there are some early signs on the indicators that we may be preparing to pump soon.
The RSI has been making HIGHER LOWs despite price falling lower = BULLISH divergence.
MACD histogram is also painting a bullish divergence.
These are early signs that a possible reversal or at least a stop in the downtrend is imminent. If Shiba can stop the bleeding and sit above the current support at $0.000034, then bulls will have a great base for a rally.
The first signal that this downtrend is over will be given if Shiba can leave this channel and break again above $0.000047. That will be a clear confirmation of the trend reversing.
Right now that appears far away, but don't be too disappointed. Price is curving nicely on this support and we all know Shiba can pump fast... so a reversal can be quick.
Also watch out for BTC and ETH as they will impact Shiba. See my ideas linked below.
Shiba bias is mildly bullish on this price action and a high risk / high reward play is buying the current support with a good stop under it.
Like and follow if you liked my idea!

SHIB/USDTPump coming , buy some and HODL , Targets $ : 0.000043 , 0.00005 , 0.00006400 , 0.000087 Shib has not need to any fundamental , all people in world know that , just should focus on technical . moon coming ...........................................................................................................................................................................................................................................................................................................................................................................................................................................................

SHIBAOn a 4-hour TF, after a long time, SHIBA was able to break its downward trend line, and it is going for higher resistance levels.

SHIBThis area is between 0.618 and 0.718 fib and there is divergence. an other thig is there are more than 1 billion holders, you can see in CoinMarketCab

Don't obsess over the ups and downs of the Bitcoin.Hello friends,
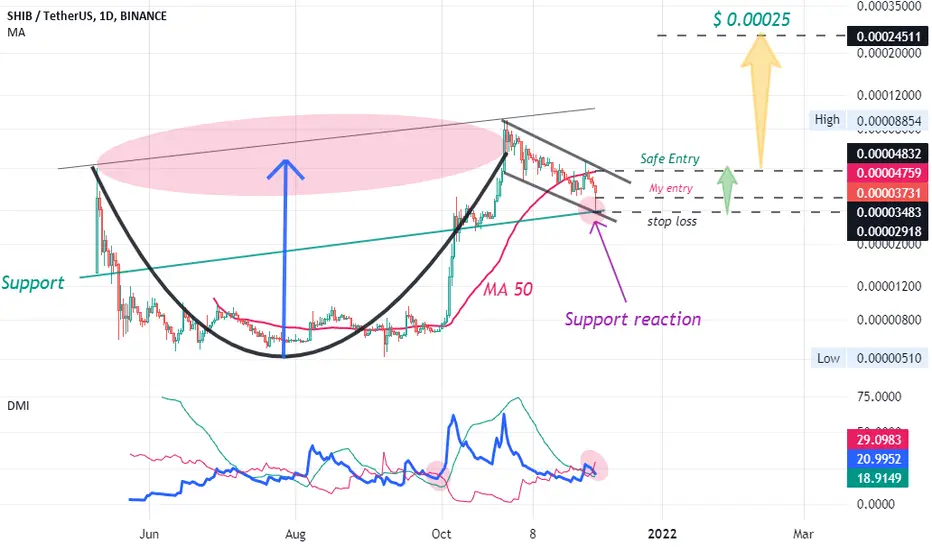
Shiba Inu coin was created anonymously in August 2020, According to the SHIBA INU (SHIBA INU Rank #13) website, SHIB is the “DOGECOIN KILLER” . A Possible scenario is shown in the chart.
1- The Cup and Handle is a bullish reversal chart pattern.
2- Safe Entry: Price over 50-day moving average (just for SHIB).
3- Take-Profit (final): When the price reaches an increase equal to the height of the cup.
Every hear the saying, "Buy low, sell high", relative levels!
Market Cap SHIB Dominance:
Investing 10%:
Start with 10 percent (of your money) and aim to gradually increase that amount over time (Max 20% Total).
Shib Buy Setup Shib breakout confirmed in 4h chart and expecting a good upward move from here after retesting 0.000036 .
SHIBUSDT
Spot Trade
Entry Inbetween =0.00003776 - 0.00003431
TP1 0.00004041
TP2 0.00004483
TP3 0.00004909
TP4 0.00005400

SHIB - Daily Chart ✅Let's see how SHIB is behaving.
This is a 1H chart.
SHIB has gone through corrections and fallen on the support levels.
The market is still showing Strong Sell volumes for SHIB, and as you can see on the chart, two support areas are strong for holding the price up.
There are also two other resistance areas pushing down on price.
The Bollinger Bands are close to each other but expanding, which is not a good sign for the short term. The price is pushing down on the lower band.
The RSI shows that SHIB is oversold, and it tries to gain volumes to go back up. But it's so weak that it's falling again.
The readings show that it was going back up to the center (50), then it got rejected and pulled down on the way up. But it's still a very week for this weekend. Watch out because more Sell volumes might appear.
If you want to know how the RSI indicator works, take a look at this Educational Idea. It'll help you have better readings:
Current Market Price: $0.00003526
Let me know your ideas.
Good luck.

SHIBUSDT , We supported from support zoneHello everybody
According to the chart you can see the price was impacted to the support zone area and we expect that can support and go up until the target area and reach to them
If it can break the area of resistance trendline we expect the 3rd target and next resistance zone is on our way
Previous analysis :
Good Luck
Abtin

SHIBUSDT trade target hit. NEXT strategy?SHIBUSDT trade hit overall 1500% profit. Now its going into area of accumulation period. Final entry for buy position will be between 38% -23% fib level. Trade will boost up as it crosses final resistance.
We publish precise and compact information which give you quick glimpse for comparative analysis. if you have any question or want to ask about analysis of other pairs or you have any confusion about analysis then feel free to ask us. Don't forget to support by share your ideas and hit like and subscribe button.

Shiba Inu (SHIB) - December 5Hello?
Welcome, traders.
If you "follow", you can always get new information quickly.
Please also click "Like".
Have a nice day.
-------------------------------------
(SHIBUSDT 1W Chart)
If the price is maintained above the volume profile section that is being formed at the 2613 Satoshi point, it is expected to create a new wave.
If it falls from the 2613 Satoshi point, there is a possibility that it will touch near the 1808 Satoji point, so you should think about how to deal with it.
The wave is not complete and requires careful trading.
------------------------------------------
We recommend that you trade with your average unit price.
This is because, if the price is below your average unit price, whether the price trend is in an upward trend or a downward trend, there is a high possibility that you will not be able to get a big profit due to the psychological burden.
The center of all trading starts with the average unit price at which you start trading.
If you ignore this, you may be trading in the wrong direction.
Therefore, it is important to find a way to lower the average unit price and adjust the proportion of the investment, ultimately allowing the funds corresponding to the profits to be able to regenerate themselves.
------------------------------------------------------------ -------------------------------------------
** All indicators are lagging indicators.
Therefore, it is important to be aware that the indicator moves accordingly with the movement of price and volume.
However, for convenience, we are talking in reverse for the interpretation of the indicator.
** The MRHAB-O and MRHAB-B indicators used in the chart are indicators of our channel that have not been released yet.
(Since it was not disclosed, you can use this chart without any restrictions by sharing this chart and copying and pasting the indicators.)
** The wRSI_SR indicator is an indicator created by adding settings and options to the existing Stochastic RSI indicator.
Therefore, the interpretation is the same as the traditional Stochastic RSI indicator. (K, D line -> R, S line)
** The OBV indicator was re-created by applying a formula to the DepthHouse Trading indicator, an indicator disclosed by oh92. (Thanks for this.)
** Support or resistance is based on the closing price of the 1D chart.
** All descriptions are for reference only and do not guarantee a profit or loss in investment.
(Short-term Stop Loss can be said to be a point where profit and loss can be preserved or additional entry can be made through split trading. It is a short-term investment perspective.)
---------------------------------
