SHIBA - bearish attitude. Falling to supportThe mood of the coin is a bit negative; after a deep false breakout, the price should go down according to the principles of price movement. given the crisis around the world and in all markets, we are likely to see a drop.
If:
the price will return to the support level 0.00003602 and will break it, then the chance of a breakout is great
I am waiting for a breakdown and a fall in the price to support 0.00002893
Shibusd

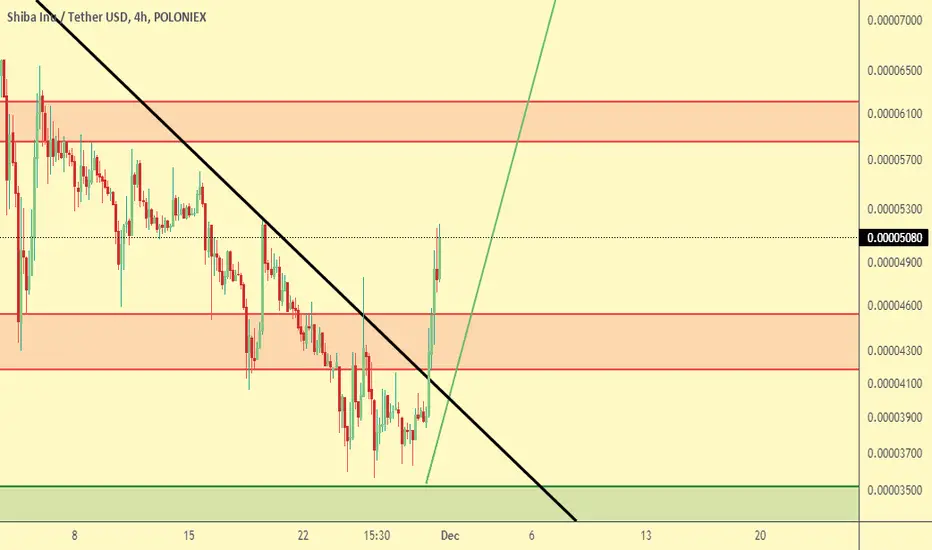
SHIB - Daily Chart ✅Let's see how SHIB is behaving.
This is a 4H chart.
SHIB has gone through corrections and fallen on the support levels.
The market is still showing Sell volumes for SHIB, and as you can see on the chart, two support areas are strong for holding the price up.
There are also two other resistance areas pushing down on price.
The Bollinger Bands are expanding, which is not a good sign for the short term.
The RSI is showing that SHIB is oversold, but we can't tell when exactly it's going back up to open long positions for now.
The readings show that it was going back up to the center (50), and then on the way up, it got rejected and got pulled down. But it's still a very week for this weekend. Watch out because more Sell volumes might appear.
If you want to know how the RSI indicator works, take a look at this Educational Idea. It'll help you have better readings:
Current Market Price: $0.00003733
Let me know your ideas.
Good luck.

SHIB to break-outI'm bullish on SHIB. Shiba Inu has been trading in an extremely bullish pattern for the last few days and actually months if we talk about the bigger channel in pink. It did break out of the pink pattern once on last Tuesday but has been correcting since. Now SHIB is literally on the verge of 3 important patterns, 2 bullish patterns (big and small) and an extreme resistance level of 0.000036. I believe it can moon and reach the closest target of Fibonacci 62% at 0.000065. It's already on its dip, so there's a little to lose even if it doesn't but remember this is NOT a financial advice.

it is worthless ButtI hate these meme coin but it seems market doesn't and I love market! here is a simple setup on this token SHIBA.
Entry : limit order on 0.00002803
Stop-Loss : 0.00001587
Take-profit : 0.00008821
Position Size : 10% of entire trading capital (Never use leverage on these tokens)

SHIBUSD there will be a strong Sell Off SHIBUSD - A Strong Sell signal on the corner and this may bring this coins in the range of 0.00003241 to 0.00002011. Be very, very careful before buying this in a huge lot.

SHIB on track for 0.00007400If you haven`t bought at this first call, when SHIB was 0.00000684:
or when the retracement was completed:
then you should know that SHIB is still on track for 0.00007400usd.
i have determined that value by using the Fibonacci extension tool and choose the Fib 0.618 as my main target.

Sheiba at a crossroadsShiba inu has a chance of pumping to target 1 or 2 if it passes the last red candle. And if it loses support 0.000040, it has a chance to return to support 0.00035. Not an investment offer.

Very Good For LongShib very good for hold and trade mac.d signal on for buy rsi next 1 and 3 days go to high i think shib very good for hold 20 to 30 days

Great opportunity for KING SHIBAfter breaking the downward trend line with high strength, we needed a pullback to climb, which is now a nice pullback and is returning from this point.
Other indicators also promise the beginning of an upward trend for Shiba.
(Stick to your #SHIB, which is a big rally is on the way)

Shib Starting the next set of Waves on the Hourly, BULLISH!!!Goodmorning everyone, I've taken off of work today because of a badddd toothache, but the gains will help negate that lol. I'm still very bullish on shib, looks like we just completed a Whole Elliot wave on the hourly and we are staring the next WAVE 1 Now.. Which means that on a higher timeframe we are just now starting wave 3 of the overall larger picture. My prediction is that the overall wave will touch the ATH again soon, retrace back to the .00006-.00007 area then create a new all time high from there..
Not Financial advice, this is just what I currently see going on at the moment, all of my shib calls seem to have been correct in the last few days.. this post may not age well so dont come at me lol.. Have a great day yall, Happy Trading!


SHIBUSD 1H - 14% move upOur view on SHIBUSD on the 1H if you a Day trader and looking to hold for 24hours to Break even and let it run!
Follow and Like to Receive more Great Set-Ups.
Thank you :)
The Humble Trader :)

SHIBUSDT LONGDescending wedge outbreak on the daily + Daily MACD crossover. Shib is facing cloud resistance at 0.000047.

SHIBA INU HAS FINISHED ITS SELL OFF AND READY FOR ANOTHER PUMP!Shiba Inu has finished its sell off and it is ready for another pump. The old weekly resistance level (0.00003597) has turned itself to a strong support level and hence we have a clear demand zone now. SHIBA INU now just need some more time to accumulate before the next pump. NFA!

SHIB, you should buy, the path is different before the new ATHshib (the futures price shows 1000 times). Currently there are two possible paths, which will be resolved after the second wave of expected rise.
The first wave of uplift has been completed. Currently stepping back to the 47-42 range.
After stepping on, the target area for the second wave is 62-66.
Then, it depends on whether the stepping 54 is supported. Use this as the criterion for distinguishing the two paths.
The process is just different. If it breaks, it may go back to the 36th outsole and step on it again-most likely it will be stepped on.
The mid-line target remains unchanged, 122-142 after the new high.
In short, you should buy now, try to hold to 62-66, the contract will close a part of the position and stop loss in place, or spot the principal.

SHIB - Buy only after that !!!Shiba Inu has been moving in a downtrend for a long time. The price has already corrected by almost 60% from its high. This is quite a lot and it is already worth looking for turning points.
Locally, the price broke the important level of 0.00004$, the next important level is 0.0000353$. I don't know if the price will reach the big value area, but if it does it would be the best buying opportunity.
You should also pay attention to the trend line, if the trend line breaks, this could be a good buying opportunity.
Write in the comments all your questions and instruments analysis of which you want to see.
Friends, push the like button, write a comment, and share with your mates - that would be the best THANK YOU.
P.S. I personally will open entry if the price will show it according to my strategy.
Always make your analysis before a trade.


SHIB - Daily Chart ✅SHIB has broken the resistance in the past few hours, and now it's going back at support to get more volumes.
The market is showing Buy Volumes for this coin right now, so don't open any short positions without more confirmation.
There are two resistance levels on the way up and two support areas on the way down, which help hold the price up to consolidate.
Use this chart as your trade setup for now; I'll keep it updated.
Current Market Price: $0.00004710
Let me know your ideas.
Good luck.

They took it to the vetInstead of putting the dog down the caring owners seem to have taken it to the vet for some expensive fur baby treatment instead. This last gasp keeping Dogcoin millionaire dreams alive is based on rumors of listing at a new exchange (Kraken). Remember, just because it is listed doesn't mean people will buy it there...
This sets up a good short opportunity for a mean reversion trade. Targeting the region of the last pump.

Shib deciding factors coming into play!!Are we going to form a head and shoulders pattern or break higher on the next wave up?? Have a great day everyone, happy trading!!
Btw sorry I did this analysis on mobile lol

SHIBA - Downtrend situation!In a 4-hour timeframe, as it has been said many times that I do not see Shiba's condition ascending yet. According to the long-term downtrend line, if it can break this line and also find a price stabilization above the 4400 range, we can expect it to climb. If the 3240 support is broken, we will see a further fall.

6 year old's Chart Analysis SHIBI think SHIB is too much fun haha... I've sold some today to buy ELON and DOGE again (same shitcoin category?). This SHIB dip seemed too calm, I guess the old heads were waiting to see a flush down. I'm not convinced that we are out of the woods yet, but if it's going up, I won't fight it. Kraken kids seem to have a lot of money lol.

SHIBA INU RESULTshiba inu has experienced 44% of growth after my last analysis.
check the link below to see the previous analysis.