CRYPTO INVERTED HAMMER/SHOOTING STAR STRATEGIES This is the Shooting Star version of the strategy. Inverted Hammer just opposite.
Step #1: Attach the Chaikin Money Flow Indicator on your Preferred Time Frame
Start first by preparing your charts ready for the battle. Simply attach the Chaikin Money Flow indicator on your favorite time frame. This is the only additional technical tool we’re going to use to confirm the validity of the bearish shooting star pattern.
Using the CMF indicator, we accomplish one major thing.
The validity of the bearish shooting star will be confirmed or invalidate instantly as soon as the bearish inverted hammer develops on our Bitcoin candlestick chart. This means that the price won’t move any further from the ideal entry price.
Step #2: The Shooting Star Candle should come after a strong bullish trend
The location, or where the shooting star candlestick develops, matters a lot.
This whole ingredient is what makes the bearish shooting star candle performs with such a high degree of accuracy. We need a strong uptrend that has two important features:
The first part of the trend is a slow and steady move to the upside
The last part of the uptrend, prior to the shooting star candle, needs to be more volatile.
Basically, we’re looking for a full-blown market top where the bulls are exhausted and reach a climax point.
Step #3: The CMF indicator must be below the 0 lines once the bearish shooting star candle develops
Chaikin Money Flow is a great tool to read and measure institutional accumulation-distribution activity in any market. Basically, a CMF reading below the zero line shows that the sellers have the upper hand and they took control of the market.
Notice that the bearish shooting star spotted satisfies all the requirements of a bearish inverted hammer. The shadows are at least two times longer than the body, small body, and very little lower shadow. This candle would have been more powerful if the closing price is below the opening price.
But it’s still a good pattern to trade due to all the other features.
Now, it’s time to highlight how to find the right entry point for bearish shooting star candlestick.
Step #4: Sell once we break the low of the Shooting Star Candle
Simply place a limit sell order below the low of the shooting star. Nothing complicated about our entry strategy. It’s in line with the textbook rule.
Step #5: Hide SL above the high of the Shooting Star Candle.
Simply hide your protective SL above the high of the shooting star pattern. You can add a buffer of a few pips if you wish to protect against possible false breakouts.
The full-blown top creates the necessary space where the bears would find no level of support to stop the drop. The last stage of a trend has been always more volatile. When combined with the reversal shooting star pattern, it makes for a killer trading strategy.
Step #6: TP when we get inside the slow part of the prevailing trend.
In this regard when the price reaches the portion where the prevailing uptrend was moving slow, we take profits. That’s where the price will find some hostility to advance further on the downside. We want to clear out our position when that happens.
Conclusion – Best Shooting Star Strategy
The best shooting star strategy is one of the most reliable and efficient ways to trade trend reversals. This single candlestick pattern can offer you one of the most attractive risks to reward ratios. You can risk between 10 and 30 pips and look to gain between 200 and 300 pips which gives you a profit of 20x or 30x the risk taken.
Take that into consideration next time when you’re able to find a shooting star candle that satisfies all the rules outlined in this trading strategy guide.
A lot of traders will warn you against reversal trading. However, finding tops in the market and trading reversals can be done successfully if you have a proven methodology like our shooting star candle strategy.
Shooting Star

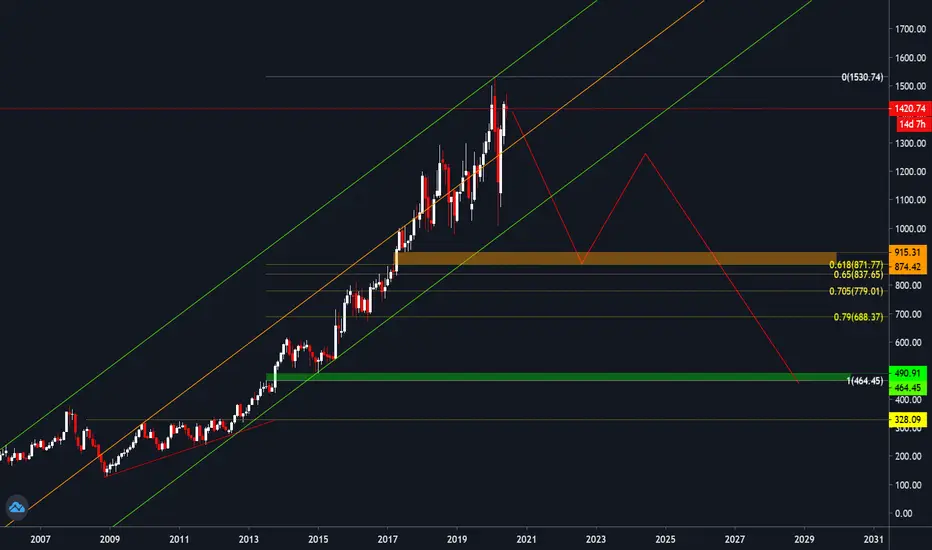
#Google - Uptrend might comes to an end but wait!! Google has been trading inside Huge longterm Uptrend channel however this is all based on monthly candles so WAIT FOR MONTHLY CANDLE CLOSE!!
this is a long term analysis & smaller timeframe moves won't affect it, we have been in an uptrend since 2012 after breaking out of multiyear ascending triangle, now we are looking at a possible Double top on monthly chart also a Bearish Shooting star candle close
Double Top :-
If we does create a double top & have bearish candle close then I expect a deep correction at least to 0.618 Fib level mentioned on the chart (Orange box)
we surely will have a bounce from there either to continue upside or reject down to much lower towards the Green Box.
As I said in beginning this is a Multiyear trading idea so this should only concern to SWING TRADER & INVESTORS!
Will keep updating timeline as we have more PA.
AUDUSD - Intraday Analysis - H1 - Possible Bearish ReversalAUDUSD - Intraday Analysis - H1 - Possible Bearish Reversal - SHORT
We have a bullish Parallel Channel on the H4 & H1 chart, price made a new high and
touch the upper trend line of the parallel channel.
We have a shooting star on the H4 that shows us that the buyers are taking their profits,
so we have a possible bearish reversal.
Now we are waiting for a little pullback at a key zone 0.6655 to enter short.
Our first target will be @ 0.6605 and second target the 0.236 Level0.6555
■■■■■■■■■■■■■■■■■■■■■■■■■■■■■■■■■■■■
Entry: 0.6655 | Stoploss: 0.6680 | Takeprofit1: 0.6605 | Takeprofit2: 0.6555 |
■■■■■■■■■■■■■■■■■■■■■■■■■■■■■■■■■■■■
■■■■■■■■■■■■■■■■■■■■■■■■■■■■■■■■■■■■
If you like this idea please click the like button to support this channel, thanks.
■■■■■■■■■■■■■■■■■■■■■■■■■■■■■■■■■■■■■
Disclaimer: All information and ideas provided is for educational purposes only. It is not a recommendation to buy or sell.
■■■■■■■■■■■■■■■■■■■■■■■■■■■■■■■■■■■■■


GBPJPY - H1 - Double Top - SELLGBPJPY - H1 -Double Top - SELL
We have a breaish trend on the H1 chart and price made a Double Top with a Pullback under the 200 MA,
with long wicks candles: a Hammer and a shooting star this tell us that de Bears are taking the lead.
We enter short @ 130.75.
■■■■■■■■■■■■■■■■■■■■■■■■■■■■■■■■■■■■
Entry: 130.75 | Stoploss: 131.25 | Takeprofit1: 130.05 |
■■■■■■■■■■■■■■■■■■■■■■■■■■■■■■■■■■■■
■■■■■■■■■■■■■■■■■■■■■■■■■■■■■■■■■■■■
If you like this idea please click the like button to support this channel, thanks.
■■■■■■■■■■■■■■■■■■■■■■■■■■■■■■■■■■■■■
Disclaimer: All information and ideas provided is for educational purposes only. It is not a recommendation to buy or sell.
■■■■■■■■■■■■■■■■■■■■■■■■■■■■■■■■■■■■■

EURTRY weekly bearish bat and shooting star combination shortEURTRY has been approaching its all time high and hit into the bearish bat.
Here we got a weekly shooting star broke to the downside, I would kinda love to take some short this week.
Tiny position would be fine to try to hold as long as possible as a carry trade.
Let's see how it goes yo!

SandStorm Gold - Shooting Star SignalThe combination of a shooting star (on an upward trend) combined with a red volume, signals a short-term reversal.

Monthly Chart of USDINRMonthly Chart of USDINR:
As seen from the Monthly Chart of USDINR, the currency is trading in the Rising Channel pattern since 2013 to till date.
In the month of April-2020 the currency has hit the Upper part of Channel around the levels of 76.50-77.00 and retraced.
The currency has formed a Shooting star Candlestick pattern around the resistance levels on Monthly chart.
If this pattern is to hold then we may see appreciation in the Currency.
1st Support lies around the levels of 74.00-74.50 and if it is broken then 2nd support lies around the levels of 72.00-72.50.
Resistance lies around the levels of 76.50-77.00
For educational purpose

The infamous Sell in May and Go Away.We are afraid of the famous “Sell in May and Go Away”, and that’s always good to put some senses in our heads. Let’s see what the chart can tell us.
Today the bulls reacted, after a very nice and healthy pullback to the 21 ema. That’s very normal and is still a bull trend, although there’re some signs of danger here, and I’ll talk about them latter.
Let’s see the hourly chart now:
SPX did a Head & Shoulders pattern and now it seems it’s doing a pullback to the 21 ema, and that’s a decisive point. If the price loses the 2800 (black line), SPX can slip further down, and the bears will dominate for a while. And that’s a real possibility here, especially if we look the weekly chart:
Last week it did very classic bearish patter called Shooting Star, just when it reached the 61.8% fib retracement and the 21 ema. To sum up, a very classical bearish sign in a resistance zone. That’s what scares the most the bulls here, and they should be very aware of this.
Let’s see how the bulls are going to react now.
Remember to follow me, I’m a trader who uses the classic technical analysis (barely any indicator, just the candles and the volume). Like this idea if it helped.
Thank you very much.
* LIKE this idea and FOLLOW me, because:
- Here, you will see clean charts;
- Trades with clear risk management;
- The best of Dow Theory, Price Action and Candlestick psychology;
- Chart patterns with statistics. *
* My name is Nathan, I'm a trader and portfolio manager and I'm here to LEARN. Leave your COMMENT and FOLLOW me to keep in touch. *

Multiple TimeFrame Analysis AT&TAT&T stock look likes it ready to make a huge move to the downside =.
It appears to have shown several sell signals, informing that there is a lot of bearish pressure.
I have analysis of several different time frames, like comment and follow.
I'm open to all differing opinions, maybe you see something I don't, if so feel free to drop a comment !

Tata chemical - Sell side - Fall below 280 take the price to lowTata chemical - Sell side - Fall below 280 take the price to lower level of 255 and 243 . Forms shooting star and Open=high on daily candle which is indication of bearishness.

Colpal Sell idea - Sell below 1463 for short term target of 1442colpal forms shooting star in weekly and open=high on daily candle .
Sell idea - Sell below 1463 for short term target of 1442

Multiple Time Frame AUDJPY SHORT
Weekly Time Frame
Price retested the former low on the weekly timeframe, and met resistance
Price also respected the 61.8 fib level
Price formend a shooting star/bearish hammer candlestick pattern
Daily Time Frame
-Thursday candle closed as an indecision candle (showing the possible rally was coming to an end.
-Friday candlestick was a large bearish candle further confirming the end of the rally and retesting the double top
- waiting for price to pull back and then i'll enter a short
4 Hour Time Frame
-Price ended with an indecision candle after a strong move to the downside
-I'm expecting a short lived rally to the 69.20-69.50 area, that's where I have a sell order placed.
AUDJPY also has a strong positive correlation with SPXUSD and i'm also bearish on that (check my SPXUSD idea, posted yesterday)

LINDE IDEA Weekly shooting star + correction wave elliot - LINkey points to have in mind:
1- Weekly bearish shooting star candle
2 - H3 time frame have completed 3black crows pattern
3- H3 indicating MACD crossover
4- 5 wave of elliot competed time for correction bringing taking the price to potentially break the flag and drop for ABC elliot correction

TSLA - Shortsorry fan boys this looks like bitcoin in early 2018.
***Not financial advice I hope I am wrong I like Tesla and rather see this stock go to $4,000.
I do think Tesla comes out of this bear market as the number 1 auto company in North America.


GBPUSD SHort for 400 pipsCandle stcik formation, Channel Breakdown, Head and Shoulders, To many technical and structural reasons to sell this pair.

XAUUSD ShortWe got a double top at many time frames and also a rejection candle "shooting start" in weekly time frame
Now is expected some confirmation for a good sell entry

EURNZD [LONG]Hello traders,
Trendline breakout
Retracement on Fibonacci level 61.8% + 1 Month Support
Shooting star + Bullish Engulfing
Comment your opinion on this pair!!
+ Follow me to get updates on all my setups

Short $MCHP.Shooting star bearish pattern. As well as recent uptrend accompanied by rather sideways (arguably downard) OBV.

S&P500: bull trap?Technically speaking, yesterday S&P500 closed with a shooting star candlestick pattern on daily chart, which was a warning signal for bulls...
...today the market continues going higher and it might produce better price to short the equity market.
The COVID-19 pandemic is still out there killing people and lot's of industries (e.g. airlines, hotels or cruise lines, etc.) are not working properly...
...companies cut dividends, while people loose their jobs (more than 6,6 million initial jobless claims in US came out last week).
If you ask me, whether I think the price formed on 23rd of March this year (around 2200) is the bottom for the equity market, my answer would be: definitely not.
What's happening now, seems to me more like "FOMO correction" move, rather than "V" shape economic recovery.
Hopefully I am wrong, but in one thing I am pretty sure: "building - is not breaking"...
...so joining bears from around 2780-2800 price zone seems logical for me.
Keep in mind, that it's important to follow predefined goal and rules when trading.
//
I would very much appreciate if you support my work by hitting like .)
Feel free to share your opinion/position via comment and follow me to stay updated

Shooting StarForm shooting star near resistance in an uptrend! Wait for confirmation candle! Price Action analysis!

MES1! could head down to 2800-2750 zonePeople wanna blame the Corona virus, I just trust the candles. Pink lines show weekly levels here on this 4 hour chart.Speaking of the weekly chart, take a gander and see that this weeks candle is a huge shooting star following the largest bearish weekly candle in years. The bulls can enjoy the bounce for a bit more but in the next coming weeks, I think we'll see 2800 tested. If not, price should head back up to 3200 zone then head down, but in my opinion, that's not likely.
Anyway, be careful out there and happy trading everyone!
