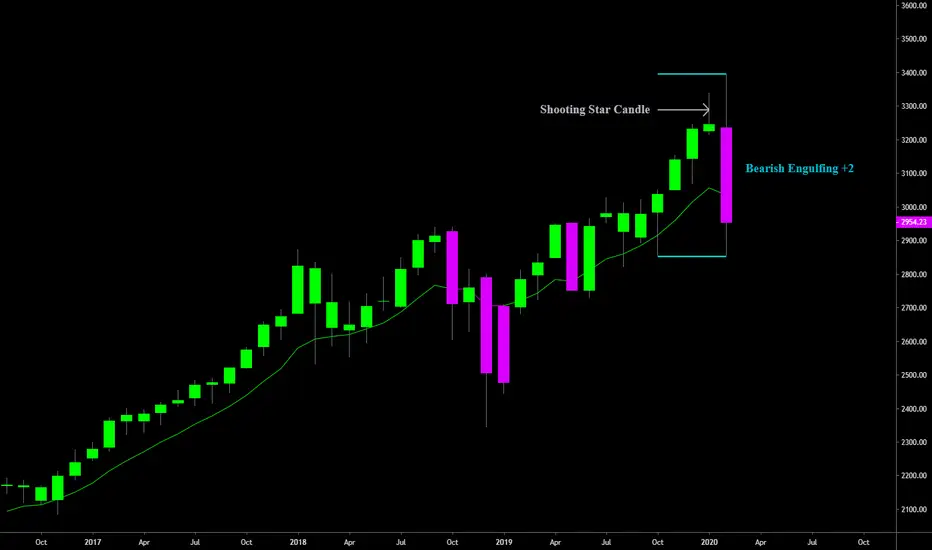
S&P 500 Bearish Engulfing+2 Following Shooting StarA closer look at the month of February shows that we had a bearish engulfing candle + 2. A bearish engulfing candle is one where the high of the candle and low of the candle completely engulfs the previous candles high and low(shown with blue lines) and indicates a potential reversal to the downside. The +2 indicates that the bearish engulfing candle not only engulfed the previous candle, but also engulfed the two candles before the preceding candle as well. February’s low was .10c above October 2019’s low which kept this from becoming a bearish engulfing +3. While this bearish engulfing candle on its own is bearish, a trend reversal isn’t confirmed until/unless we see a price move lower on the following candle(March 2020). If March price moves and closes lower than February’s low it can be viewed as a trend reversal and end of the 10-year bull market rally.
February’s bearish engulfing candle comes on the heels of a shooting star candle created in January of 2020. A shooting star candle is a bearish candlestick with a long upper wick with little or no lower wick. Shooting stars appear after an uptrend in price. The distance between the highest price of the candle(top of the upper wick) and opening price(top of the candle body) must be twice the distance of the candle’s body to be considered a shooting star; the upper wick must be twice the length of the candle body. Shooting star candles are most effective when they occur after a series of three or more consecutive rising candles, which this chart shows.
We now have two bearish candles on the chart with last months shooting star and this months bearish engulfing, both of which indicate that a top in price has likely been made.
Shooting Star
MSFT monthly candle is set to be a shooting starLast month was the 6th time in SP500's history that it was closing with a monthly shooting star candle. This month it's #MSFT's turn

XRP Bearish short term, Bullish long term!!!Just following up on yesterday's post.
1) I noticed the shooting star (Did you) on the weekly closing, this is a cause for concern for the bulls.
2) We currently got rejected from the major resistance that's been acting as support for the longest time, so breaking through that will require much effort! (godspeed to anyone going long right now).
3) Refer to previous post on price action.
4) We are likely not to go to $0.40 (elliot wave) right away, but it is inevitable and possible after we bounce off $0.20.
If you like this idea, please leave a comment or follow
Thank you

Nikkei Struggling At Key Resistance as Revised Coronavirus Data Optimism crept back into the market earlier this week, with market participants speculating that cases of 2019-nCoV may peak by the end of February.
However, a revision of the counting methods used to identify infections led to a 15,000 case jump in the Hubei province; with the WHO stating many of these cases date back up to three weeks.
This has seen doubt creep back into the market with the Nikkei FOREXCOM:JPXJPY pegging back most of its gains from earlier in the week, after failing to break key resistance at the 24000 handle.
Early formation of a shooting star candle, a potential triple-top reversal pattern and RSI divergence highlights exhaustion in the recent uptrend from late August 2019, and could see price begin to pull back to retest the 2020-low (22637) and 38.2% Fibonacci (22525).
Break of support & sustained momentum to the downside could see price push towards significant uptrend support ,extending back to June 2016, and confluence with the 61.8% Fibonacci (21509). FOREXCOM:JPXJPY

Tezos possible shooting star on 1HTezos $XTZBTC possible shooting star on 1H, volume is getting lower, we could see retracement to 0.00022 - 0.00020

Shorting USDCAD on a Wedge patternBearish formation on USDCAD
Shooting star and few divergences (AO, MACD, RSI)
Risk / Reward: 1 / 4.5
Risking 0.30% of Capital
Happy Trading!

USD/CHF Daily - Bearish ContinuationTuesdays close gave us a lower high from January 10. Depending on how Wednesday closes we might see a continuation to the downside.
Strategy:
Looking for a close lower than Tuesdays high of 0.97415. This would give us a shooting star signaling a reversal.
A close below that on Thursday would be confirmation.

Hanging man has been presented!! BTC 8000 may be coming!!!To be short, you can see weekly candlestick did shooting start and following with Hanging man candlestick patten and lower high in big time frame. Therefore, short is good idea for now with stop loss at 8850. Good luck for all of you and be happy!!!

Bitcoin , short term drop, shooting star on 1hrWe have a shooting star forming on the hourly. This could lead to small drop, w/RSI over extended on 4hr on down.

USD/JPY at Major resistance level - one to watchUSD/JPY has recently closed on a major resistance level, indicating that there will be a break or bounce around this area.
The most recent daily candle is in the form of a 'shooting star' which indicates a bear reversal from the recent bullish trend from the 6th-9th January. This candlestick pattern along with the initial bounce at the resistance area indicates that there will be a bearish reversal in the near future. However I will be watching the candlesticks over the next few days to see a confirmation move, break or bounce.
This resistance area also sits on the 50% Fibonacci retracement level between the swing high of 1st October 2018 and the swing low of 31st December 2018 indicating that this is a major resistence zone, a bounce here will be a hard bear - equally a break through at this level will indicate a strong bull.
Fundamental analysis: Asias stock prices have recently lowered with Japan's benchmark Nikkei 225 stock index fell by 1.3%, and Hang Seng in Hong Kong was down 0.8%, and China's Shanghai Composite was 0.9% lower.
Equally though JPY has been strong through the start of the year even with world anxieties . Apple blaming China for slowing of sales which has prompted a drive of safe haven flows to JPY. Along with this JPY is at a 10 year high against AUD.
With strong fundamental analysis on each side at this point of major resistance it is clear that a break or bounce will be a big move.
Follow, like, share and keep up to date for following analysis. These are just the ideas of a salmon, nothing more, nothing less. Do not take these ideas for gospel.

USDJPY - SHORT price has rejected off the descending trend line with a shooting star on the weekly chart also a bearish engulfing candle indicates alot of selling pressure in this pair. wait for a retest of support and look for clear signs of rejection before entering a short position


NZDUSD Big Short Opportunity ComingNZDUSD has been in a widening wedge pattern and has formed a shooting star candle on the daily timeframe. These are both signs of a reversal. Multiple confluence list:
1. Daily shooting star with 3rd test of trendline
2. Daily RSI overbought with 4 Hr RSI bearish divergence
Entry around 0.66150 with stop above high at 0.66450. TP1 0.65550 TP2 0.64550
This is for educational purposes only. This is in no way intended to be financial advice. I am not a financial advisor.

USDCHF rejection on the up-channelUSDCHF reached the top of an ascending channel that we've been monitoring for the past 2 weeks.
Sellers had a nice reaction, with a shooting start, followed by a bearish engulfing pattern.
Risk to reward ratio is very good for this trade, so it's worth a try.
A complete analysis of it is available on my last video on my YouTube channel.
USDZAR 0.618 and 4hr shooting star combination shortThe bullish bat worked fantastically!
Now the 2 0.618 retracements are basically both at the 15.06 spot,
which will be a good combination short to focus on!
A sell limit @ 15.06,
Out: 15.1400
1ST kick: 14.9800
TP2: 14.7500
Let's see how it goes yo!


EURJPY - Short #Forex #ForexTrader EURJPY - Short
(I'm short already due to the shooting star candle on the 2nd top)
BUT THERE IS STILL OPPORTUNITY TO ENTER!!!
Some people wait for the break of the low on the double top before entering or a retest of that level.
So just bringing it to your attention.
Any questions feel free to ask via message or comment

BTC SHORT - Printing a 1hr Shooting StarWatch out for the shooting star I am opening a short here.
Coach


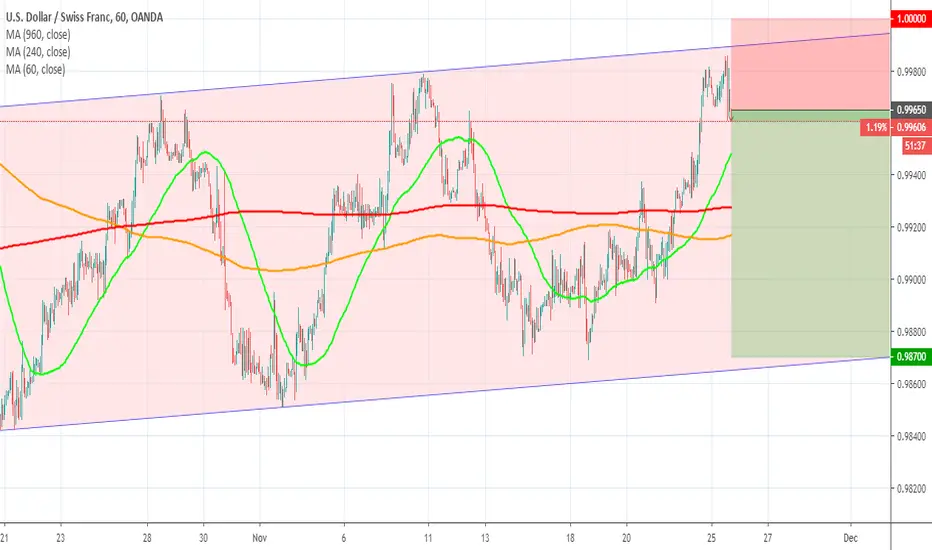
USDCHF Shooting Star at Resistance LevelAfter a strong bullish run through to 0.99800, USDCHF is now testing a key resistance level formed over the past week. Price action shows that the resistance is being rejected and thus I have the bias that there may be some downside momentum due to arrive in USDCHF towards 0.98940.
I will be looking to short this pair if price forms a shooting star that is broken to the downside.

NZDUSD #Forex #ForexTrader #ForexTrading #ForexChartWith the overall trend being down on the Daily TF
There have been numerous test of this 0.64 level and there is a nice shooting star candle followed by an engulfing candle.
IF this current 4HR candle can finish like this then i will be taking a short trade along with other reasons for my entry
Any questions feel free to ask

Rebound1)Price is in the main resistance area
2)Evening star candle pattern
3)R/R 1:3
+adding after the last Shooting star day.

XAUUSD Daily Double Top, Weekly Shooting Star.On the daily chart: Gold has formed a double top pattern and could possibly form a head and shoulders pattern.
On the weekly chart: Gold has a shooting star. Indicating trend reversal. This week has tested the resistance level and followed through with the trend reversal.
We should be seeing a break of 1500 and 1490.
TP 1: 1500
TP 2: 1490
TP 3: 1480
