Short-term

Short Term Bitcoin Falling Wedge Long Position Term: Short term 1-3 day trade
Buy: $36,240
Stop: $34,580
Take profit: $38,150
Please trade with caution this weekend as there may be high chances of price manipulation as there should be low volume trading.
Have a great weekend and stay blessed!


Small pull back before heading back up.Okay lol, So it looks like my first analysis was correct and we are indeed either going to touch the first fib lvl or we may dip a little below it then kinda go up and down until we see a break out to either the upside or the downside (only see this scenario if bad news hits). So yeah, just HDLE if you bought in if you're waiting to reenter or even enter wait for it to reach the first fib or maybe just below it.

EURGBP Short Trade SetupIf the blue C is the end of the running flat, the downward movement should be the reversal impulse, and we may have a complete correction. After the yellow C, we got a sharp drop and now, I'm waiting for a correction to place a pending order. My minimum target will be a new low, while the main target 0.84700.

BTC - Inverse Head and Shoulders - M15 Break OutHere we see Bitcoin has followed this inverse head and shoulder pattern nicely and looks to complete the right shoulder and break out to the upside pushing up to the next resistance zone between $41,500 and $43,000 USD. Larger Head and Shoulder pattern is in play on larger timeframes, indicating a push down from the highlighted SELL ZONE. Two scenarios are on the table. The first is a push back down beneath the SELL ZONE indicating a correction down to complete the larger right shoulder with opportunity to buy back in. The second scenario will see Bitcoins price push beyond the $43,000 resistance in which case upon the re-test of the SELL ZONE providing a nice confirmation BUY with strong upside potential from this point.

BTCUDST - Short-termif btc follow green line, buy btc when btc back test or 38-40k.
Take profit 43k5, 48-49k.


Bullish Reversal On Weekly Chart Of Axis Bank.NSE:AXISBANK
Last week (17th May 2021) closing of AXISBANK weekly candle indicating good reversal or one can even say beginning of up move after retracement.
If we get any follow through to this weekly candle even on daily chart its will be good confirmation for AxisBank to be making new lifetime high.
For short term or long term investors AxisBank have good support near 560-530.
As far as targets are concerned I always prefer to use Fib Extension tool when there is no background remain for any stock. And as per Fib Extensions level of 1.618 AXISBANK may reach 1270 within a period of 3-6 months.
Thanks for Reading and sorry there is not much to say in this chart. Its looks too simple.
|| Hari Om ||

AUDUSD - DXY cause to understand a short-termDepend on NZD RBNZ report a correction in trend is inevitable but the trend is upward till arrow point.


NVAX NOT WORTH $5The vax includes SM 102 a toxic flammable liquid causes cancer, toxicity to organs, and skin issues. Doesn’t make income and has no products that are profitable. Worth no more than $5.

Short / Long position on the ADA forcastSo it looks like we did fall under the support which has now flip to resistance. I am taking a short position and then I will be taking a long position once we figure out which way we are headed but for now there isn't another support until 1.05 so enter at you're own risk but I am going to sit it out until we have a confirmation that we are indeed heading back up towards the 50 & 61.8 fib levels.

Ebay Short Term View UPDATEThe Fibonacci Extensions at the top represent possible resistance points where profit taking may occur.
The Fibonacci Retracement drawn at the bottom represented ideal entry points into a long position.
The 50 and 100 Moving Averages should offer support in the short term.
Ebay is trading at a low Price/Earnings ratio of 15.
The current price level, though not an ideal entry point, still remains attractive.

ADA falling to $1.74 - $1.55 levels.From what I can see on the daily chart, the hourly charts, the 15min chart $ADA is looking to fall back down to around $1.74 - $1.55 area for the short-term pull back I expect a very large pump back up to challenge the $2.49 ATH once we hit the bottom of this downward pressure. But if you have any opinions please leave you're comments down below and I will get back to you as soon as I can.

EUR/USD Scalp Opportunity There will be a healthy pullback to the 0.38 level of the Fibonacci although it is a Bullish trend :)
Thanks

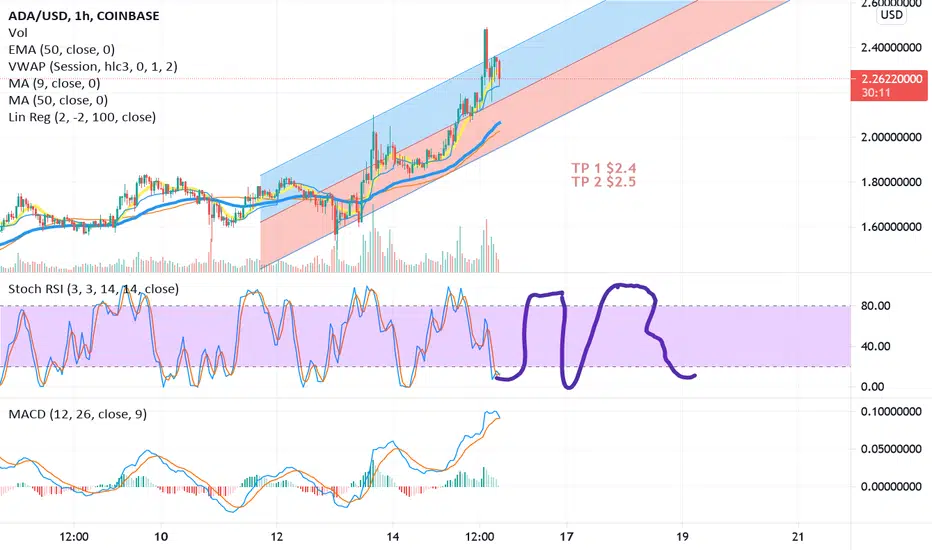
ADA Short term target $2.5 ADA has had an amazing run current price ATH $2.47
Right now we see the MACD average a slight underturn but the Scholastic RSI shows that ADA could reach $2.4 in the next target soon up to $2.5
In this short trade idea
Entry 2.22. TP 1 $2.4
Entry 2.22 TP 2 $2.5
PNL= 10%

Dogecoin Short Term ViewDogecoin did not find support at the 200 moving average and is trending downward.
The trend could reverse in the longer term, though it is more like to consolidate before doing so which means the downtrend should continue in the short term at least.
Fibonacci extensions offer possible areas of support.

Very Short Term BTC Bitcoin Scenario Be Rich...
Everything is ahead!
when you lose - someone Earn.
Be rich. be honest
Be in Love!
Cheers

ZEN one of the bestI expect this digital currency to slowly surge in demand and easily hit its 100% long-term target.
Short-term goals are also on the way, depending on which you can trade

The future of BTTwe can expect really good targets for BTT in Long & Short term future and you should have some of that in your basket
Red price Label & flags is our short term targets
Blue price Label & flags is our long term targets

CADCHF BUY Hi All,
We have an inverse H&S pattern forming on this pair and we embarking on a long positions with short term targets marked.
Entry and Sl Marked.
Comments and likes welcome.
Many Thanks
