Short-term

BITCOIN - Bakkt’s & VanEck’s ETF - Part 1A Bitcoin sell off does not always mean it is trending, it is all a matter of perspective. If you focus on one hour charts, you will see a trend!
For those who do not realize yet, losing is part of this game. When I was a beginner, I hated losing and used to make the mistake of letting my performance determine the value of my self worth. Back then, a colleague of mine used to always remind me that in order to win, you have to be able and willing to lose. It took years for me to fully appreciate those wise words. If you can't lose, you can NEVER win. Losing provides opportunities to develop, improve and grow if your level of emotional intelligence brings them to light. Over time these opportunities will lead to experience that will contribute to developing a personal process.
We follow a process that allows us to make the best use of our time and attention while participating in broader movements when the market cooperates. In other words, once the criteria lines up, and we are triggered into a trade, it is up to the MARKET from there. We DO NOT react to noise, over think or second guess. As long as our risk is defined, it is up to the market to do the rest.
Many may be over reacting to the bearish movement and assuming a trend. They will use trend following strategies, while over looking the fact that Bitcoin is still gyrating within a broad range (14K high to 9K low). Since price has not made any progress outside of this range, we continue to view it as a consolidation UNTIL it proves otherwise. Proof will have to come in the form of a break out, either below 9K or above 14K. We don't predict, we adjust and prepare.
What if price breaks lower? The 9K area is the extreme support where a fake out can most likely occur. We trade the long side only, so this is an error that we automatically avoid, but many will get sucked in. IF price can clear 9K decisively, ONLY then will we consider the 8500 support level in play. For our investment strategy (SEPARATE from swing trades), the 9K to 8500 - 7500 area is attractive when it comes to accumulating more inventory. In summary, Bitcoin is fluctuating around the lower region of a broad range, it is NOT trending on the degree to which we place the most weight on. For our swing trade strategy, this means the probability of the location favors long setups. We make every effort to remove ourselves from the equation and let the MARKET determine when to enter and exit a trade. Reacting is what often leads to errors and losses compared to letting the market present and trigger a trade idea.
What are your rules? How do you define a market that is in a trend? Or in a range? How do you measure your risk and reward relative to the current price structure? If you can't answer these questions clearly and decisively, then you should not be risking real money. Most new traders and investors come to this arena focused on profit, and overlook the value of consistency. Risk is the only variable we can truly control which is why our process begins with a defensive mindset. This is why we can be right less than 50% of the time, yet still produce a positive return overall.
BTC Back in Business
Hope you all had a restful labor day! Nothing quite like a respite from the usual to hit the reset button and start the week fresh.
Speaking of fresh starts, BTC found renewed vigor as it unexpectedly jumped from $9,400 up to $10,700. The run-up from $9,600 was particularly vigorous. Ascending volume matched bitcoin’s rising price tag tit for tat before topping out in a stride.
The latest move confused anyone seeking logic behind it. However, it correspond very nicely with the news that VanEck SolidX is offering a limited bitcoin ETF to institutional investors.
In the short term we have:
• VanEck’s unexpected ETF offering
• Bakkt’s bitcoin futures live date on the 23rd
• Final ETF decision arriving mid-October
The takeaway is that we’re entering a precarious time rife with potential for extreme volatility. Remember, volatility is not just to the downside, but to the upside as well.
Bitcoin’s obvious strength over the past couple of days tells us that with only an additional bit of fuel thrown in the fire, we may find ourselves firmly breaking out of the descending triangle in the chart below.
A move up towards $11K may be nothing more than a fake out attempt at breaking from the triangle, but banking on that by being short now is more risk than we’re willing to stomach. After all of these weeks spent sideways and slipping lower
We’re monitoring the situation closely and will keep you up to date.

BCHABC/USDT - Bitcoin Cash Trending UpHello Tradies!
There's so many people focused on BTC it's getting a bit boring.
As promised to Purple Crypto members, here is my analysis for BCHABC/USDT (or Bitcoin Cash). It is showing positive signs of an uptrend on multiple charts. On this 12H chart:
- rising Stoch RSI
- rising TRIX
- rising MacD
- some selling activity and
- a steep rise in the stoch RSI on the 1D chart - it has yet to hit the peak.
I shared my initial private analysis with Purple Crypto Premium members 2 days ago - great prep for a buy. This one was drawn up at that time for the purposes of Wave 1. Note that it will overshoot the top trend line if it continues upwards.
I believe that we have just completed Wave 1 of this round. The good news is if this is Wave 1, it doesn't look like an extended wave...so we know what's coming. :)
FYB (benefit), I've marked out on the chart where I believe we are in comparison to a similar previous rise.
Signals were provided on Purple Crypto Premium which generated a 7% profit on the first rise in under 12 hours...with more to come!!
Diversify, diversify, diversify....
________________________
(I don't see anyone talking about BCH right now so let's see who copies my chart/idea - I'll be adding a link to this chart to every single "Top" copycat's chart...lol).
Cheerio!

Bitcoin Bouncing Off Resistance, Key Short Term Levels to Watch!Good Afternoon traders!
Bitcoin is at it again. At time or writing, Bitcoin is trading at $10,682 and it just bounced off of resistance towards support, here are some key levels we may want to keep an eye on.
The daily chart shows Points of Control(POC's) at $10,700 and $10,598, and, the most prominent POC on the daily, $10,400. If we zoom in on the hourly, we can see that since about 8:00am(EST) this morning on 9/3/2019, BTC has been trading between $10,700 and $10,598. We just saw it test $10,700 almost exactly, but it bounced. We are still in this nice and small range, and these levels should be watched carefully if you are in BTC currently. If $10,598 does not hold, then we may see a test of our strongest POC on the daily, $10,400. If $10,400 does not hold, our next resistance POC is at $10,115, which was formerly the strongest POC on the daily until the last day or two (and is definitely the second strongest POC on this chart.) If we can surpass $10,700, however, we will face resistance POC's at $11,382, $11,715, and $11,868.
Disclaimer: This is NOT trading advice! These are merely my opinions that I have posted for you to use as one of hopefully many tools for making YOUR OWN decisions. I hope you all kill it, but I am not responsible for any financial losses. Thanks for reading!

MATIC/USDT Generated a Nice ProfitUnlike some users on Trading View, I do not make every analysis public and for the benefit of my members, I only ever enter a trade where I am 100% confident it will generate guaranteed profits. I just don't see the point of posting every chart that may "possibly" uptrend. I am only focused on profit-generating cryptos!
MATIC/USDT's trend line projection analysis from August 18 has played out perfectly, exhibiting an on point trend with a 15% profit generated in the most recent rise in under 24 hours with another crypto trade in the pipeline expected to generate an additional 10%. This chart was shared privately with Purple Crypto Premium members.
And I share with you this private chart (which I used for my personal reference) predicting the downtrend:
Happy trading!
________
Follow me on Purple Crypto telegram where I share my public charts.
t.me
Message me on trading view for info on Purple Crypto Premium membership.

A month later, the situation hasn't changed.The price levels I gave you a month ago worked well because the market remained sideways. I updated the resistance and support areas by slightly changing the settings of the Kama average I use (I increased the smoothing factor from 2 to 3).
I confirm that below 8300$ thresold the trend changes from flat to bearish at least in the short term, the previous threshold value was 8500$ now revised to 8300$.

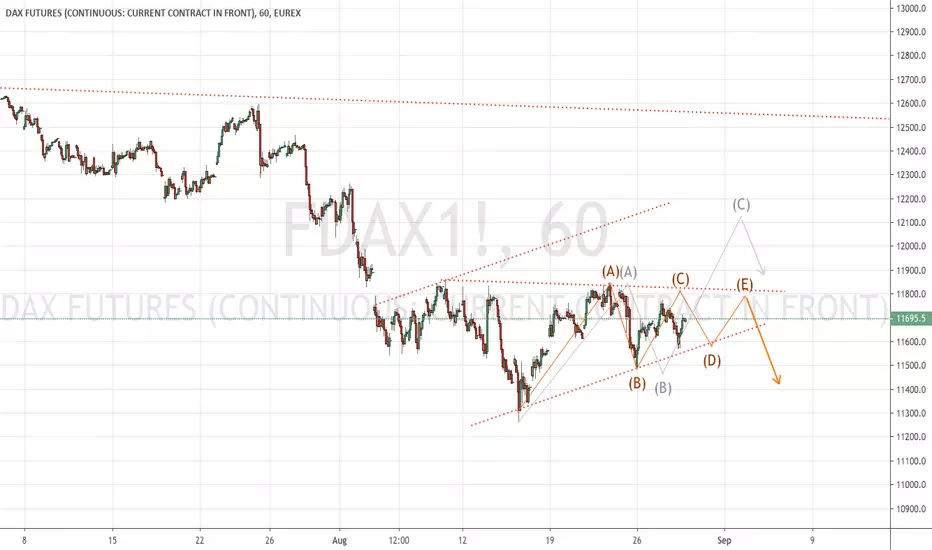
FDAX Short-Term EW Count I am expecting that the German Market will make one more lower Low target Zone should be 11000-10800. Currently we are in a corrective structure within a down trend there are two ways how this structure could play out. The first setup (orange) gives us a Short Swing Level around 11800 the second setup (grey) gives us another Short Swing Level around 12100-12200. Stay tuned for more...
Last wave in short term?Last very short-term analysis:
The price moved back and forth in this rest period. Now 1528$ (R1) may become new support to start 5th wave (green scenario) or may not and S1 act as support (orange scenario).
Note that It is a very risky situation. Price has reached medium term high and close to long term high. watch your position and set reasonable SL and TP.

Cocos ih&sCocos in a potential inverse head and shoulders pattern. If this plays out we should see it reach 25 sats in short term and maybe higher.

ALGO/USDT Breaks RSI ResistanceThe long awaited move by ALGO has begun, breaking the long resistance in stoch RSI on the 6 and 12 hour charts. It's made the biggest move since Aug 14 and all other signs are positive too.
I believe it has completed its first small wave with it currently in a small downtrend. I am expecting it to rise to the peak RSI on the 6 hr chart in the short term.
As per my previous analysis, I am expecting this to trend upwards for a while, which will a a bright light at the end of the tunnel considering BTC's performance of late.
_____
On point trade signals & premium charts on my Purple Crypto Premium telegram channel.
Follow me at: t.me
for chart analysis and ideas

EURUSD Scalping Idea - Validity +2 hoursThis is purely a technical analysis baring no changes to the current fundamentals. The idea is premised on the trending the periods and moving averages to project a short term trading idea.
This idea is not meant to be a trading advice. As with all things trading, do you own analysis and come to your own conclusions before placing trades. This is only for informational purposes only.

MATIC/USDT Bullish SignsHello everybody!
I wanted to shoot this out before I retire to bed this evening.
MATIC/USDT is showing bullish signs on the 4 hour chart. It has just crossed the 90 EMA. From history, it has sky rocketed every single time it has done this since May this year.
Based on the previous cross over on 6 August, it has the potential to rise to the 5.786 fibb mark (or 0.02054) if it continues to head up/swings up above 0. If it retreats down, its chances are slim.
MacD is turning up and there was a huge increase in volume in the last 30 minutes. 90EMA on the 12 hr and 1D charts are also starting to turn up with the 1D Heikin-Ashi candlestick just turned green (again could change while I'm asleep).
Please comment your ideas. I look forward to updating tomorrow morning. Cheerio!
---------
Follow me on telegram:
t.me

Crypto of the Day - LINK/USDTGood morning Asia! I hope you have a deserved rest over the weekend and are bright and alert for a fresh new week.
While I await a positive sign/change from ALGO/USDT, I would like to share with you my crypto of the day - LINK/USDT.
It is showing signs of the start of a new uptrend. Retracing from the low of the previous uptrend in April this year (where the retracement has hit the .618 fibb and continued upwards slightly the last couple of weeks), it has the potential for big gains over the next few weeks, all things staying positive.
The 1D Heikin-Ashi candlestick has stayed green and bullish for the second day running.
RSI and MacD and on the way up and have yet to peak, indicating the potential start of an upturn.
Other technical analysis has also indicated the possible start of a long-term uptrend, and definitely an uptrend over the shorter-term as well.
Long-term forecast (next few weeks) - expect to hit 3.5-4.5 or higher.
Short-term forecast (next day or so) - 2.6 to 2.7 mark depending on how far it retraces back today.
This is an excellent crypto to get into today at the low of the pullback on a 4 hr chart.
-------
Follow me on telegram.
t.me

Crypto of the Day: ALGO/USDT - Long-Term ProspectGood morning to everybody in Asia and good evening to the rest of the world.
My crypto of the day is ALGO/USDT, one that has been downtrending for a very looooooong time. Based on my TA. I believe this is going to change.
Long-term analysis (as long as it can get for ALGO :) ) indicates this is heading in the same direction as BTC did when it first turned up earlier this year - EMAs, MACD, RSI (just a tiny portion of my analysis but ones that most are familiar with). All movements looking and staying the same, i.e. if it continues to move positively upwards over the next few weeks, this is going to be an excellent long-term prospect with significant gains.
Short-term traders, I expect an uptrend change coming soon lasting at least 6-12 hrs once it initiates.
Happy trading!
_________________
Follow me on Telegram for updates (premium channel for on-point trade signals).
t.me

BTC very short-termJust simple Dow theory.
Seems it will reach to purple curve. Not so sure anyway ;)

Buy the fear! $BTCBuy the panic, the fear, Closing daily as Doji, after a heavy downtrend, means a very possible reversal, at least a retest on the upside before another leg down, I would buy around here, sell/move SL if we go up around 10800/11k and wait for new moves, weekly close is key here.
Always DYOR, if you follow this shitty trade and make some sweet sweet moneeeeey.
Tip me :D 15k38oQ2sC2EnJLFS78MfKAxqL6jz5i8rw

MATIC/USDT on the rise again? Odd.MATIC/USDT has turned up again in the last few hours (while I had the most beautiful, peaceful sleep after 3 days of international client meetings which entailed waking up in the wee hours to provide trade signals on my premium telegram channel - a 53% ROI in the last MATIC run).
Based on the previous run which ended somewhat disappointingly (yes, I wasn't happy with 53%), there is a slight flat-lining to the trend. If it continues in this manner, I envisage an even more disappointing third run up.
It is currently too soon to tell if this early rise is going to be another wave or a devious correction. Stay tuned for updates.
On another note, I was delighted to find on my return that I have provided inspiration to some long-time posters who are now using a replica of my chart layout.
I'm glad people are noticing me - it's a sign that I am doing something right. Although, I do hope they realise that my charts are only skimming the surface of the very deep technical analysis I conduct. ;)))))


BTC SHORT-TERM BULLISH SINCE AUGUST 2019Like I said Long-term we are still in the bull market.
Short-therm on the 1h chart we are also in the bull market since July 31, 2019.
In my personal opinion, it is a good time to open long positions.
Good Luck!

support lvl?only my thoughts.. just to help me learn..but i am seeing a support level hitting.. possible 50 pip or more bounce.

Expecting a Bullish Impulse (STA)All these predictions are made by Quantitative Analysis Algorithms following short term trends. These Quantitative Analysis Algorithms will calculate maximum correction relative to previous impulses.
Relative to previous bullish impulse we are now in a bearish correction. So algorithm expecting a short term bullish impulse.

USD/CAD way DownwardsFX:USDCAD
Bearish Bat Pattern Spotted On the Weekly chart, also EUR is stronger in next week which will impact on correlations of Dollar so it simply means that USD/CAD is going short this next week.

Back Above Daily KamaThe market is still flat although the bitcoin has managed to return above the Kama average in a position of strength after several weeks below it.
A break above the resistance zone (above 12200$) would confirm the recovery of the trend.
From tomorrow i'm on holiday, see you in September, there will be updates only in case of emergencies:)
