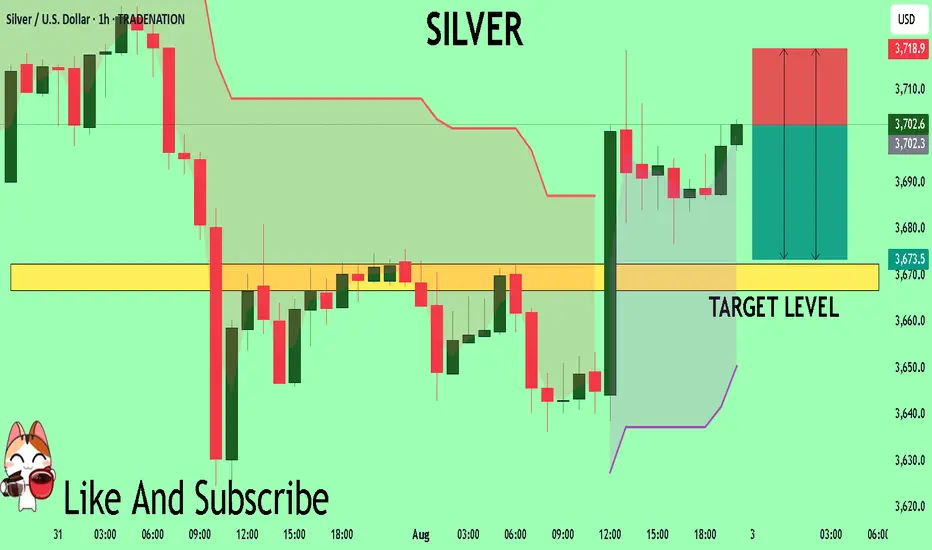
SILVER My Opinion! SELL!
My dear friends,
Please, find my technical outlook for SILVER below:
The price is coiling around a solid key level - 37.026
Bias - Bearish
Technical Indicators: Pivot Points Low anticipates a potential price reversal.
Super trend shows a clear sell, giving a perfect indicators' convergence.
Goal - 36.725
Safe Stop Loss - 37.189
About Used Indicators:
The pivot point itself is simply the average of the high, low and closing prices from the previous trading day.
Disclosure: I am part of Trade Nation's Influencer program and receive a monthly fee for using their TradingView charts in my analysis.
———————————
WISH YOU ALL LUCK
Short
EUR/CHF SHORT FROM RESISTANCE
Hello, Friends!
EUR/CHF pair is in the uptrend because previous week’s candle is green, while the price is obviously rising on the 5H timeframe. And after the retest of the resistance line above I believe we will see a move down towards the target below at 0.926 because the pair overbought due to its proximity to the upper BB band and a bearish correction is likely.
Disclosure: I am part of Trade Nation's Influencer program and receive a monthly fee for using their TradingView charts in my analysis.
✅LIKE AND COMMENT MY IDEAS✅

EUR/NZD BEARS WILL DOMINATE THE MARKET|SHORT
Hello, Friends!
EUR/NZD pair is trading in a local uptrend which we know by looking at the previous 1W candle which is green. On the 12H timeframe the pair is going up too. The pair is overbought because the price is close to the upper band of the BB indicator. So we are looking to sell the pair with the upper BB line acting as resistance. The next target is 1.929 area.
Disclosure: I am part of Trade Nation's Influencer program and receive a monthly fee for using their TradingView charts in my analysis.
✅LIKE AND COMMENT MY IDEAS✅

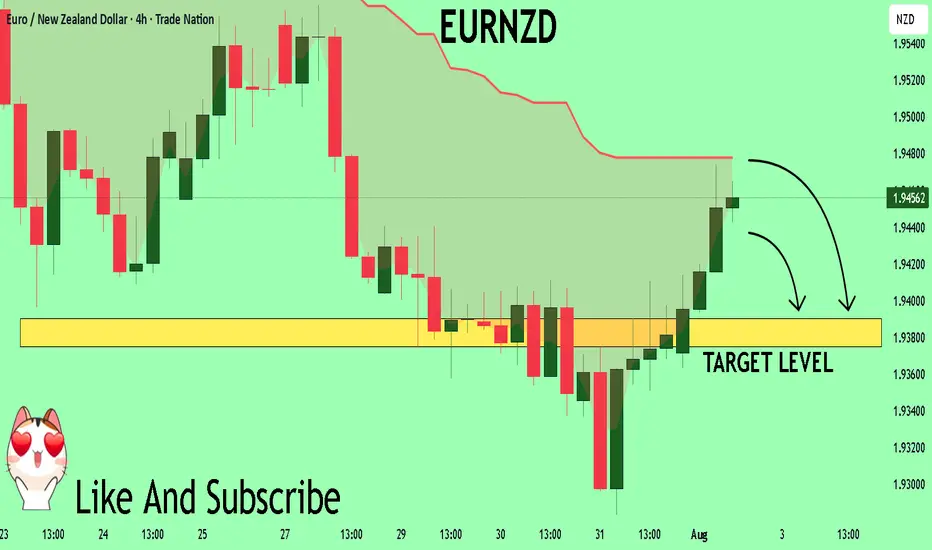
EURNZD Set To Fall! SELL!
My dear subscribers,
This is my opinion on the EURNZD next move:
The instrument tests an important psychological level 1.9459
Bias - Bearish
Technical Indicators: Supper Trend gives a precise Bearish signal, while Pivot Point HL predicts price changes and potential reversals in the market.
Target - 1.9390
About Used Indicators:
On the subsequent day, trading above the pivot point is thought to indicate ongoing bullish sentiment, while trading below the pivot point indicates bearish sentiment.
Disclosure: I am part of Trade Nation's Influencer program and receive a monthly fee for using their TradingView charts in my analysis.
———————————
WISH YOU ALL LUCK
EURJPY: Short Trade Explained
EURJPY
- Classic bearish formation
- Our team expects pullback
SUGGESTED TRADE:
Swing Trade
Short EURJPY
Entry - 171.66
Sl - 172.11
Tp - 170.81
Our Risk - 1%
Start protection of your profits from lower levels
Disclosure: I am part of Trade Nation's Influencer program and receive a monthly fee for using their TradingView charts in my analysis.
❤️ Please, support our work with like & comment! ❤️

GOLD Buyers In Panic! SELL!
My dear friends,
Please, find my technical outlook for GOLD below:
The instrument tests an important psychological level 3309.2
Technical Indicators: Supper Trend gives a precise Bearish signal, while Pivot Point HL predicts price changes and potential reversals in the market.
Target - 3296.9
Recommended Stop Loss - 3316.4
About Used Indicators:
Super-trend indicator is more useful in trending markets where there are clear uptrends and downtrends in price.
Disclosure: I am part of Trade Nation's Influencer program and receive a monthly fee for using their TradingView charts in my analysis.
———————————
WISH YOU ALL LUCK

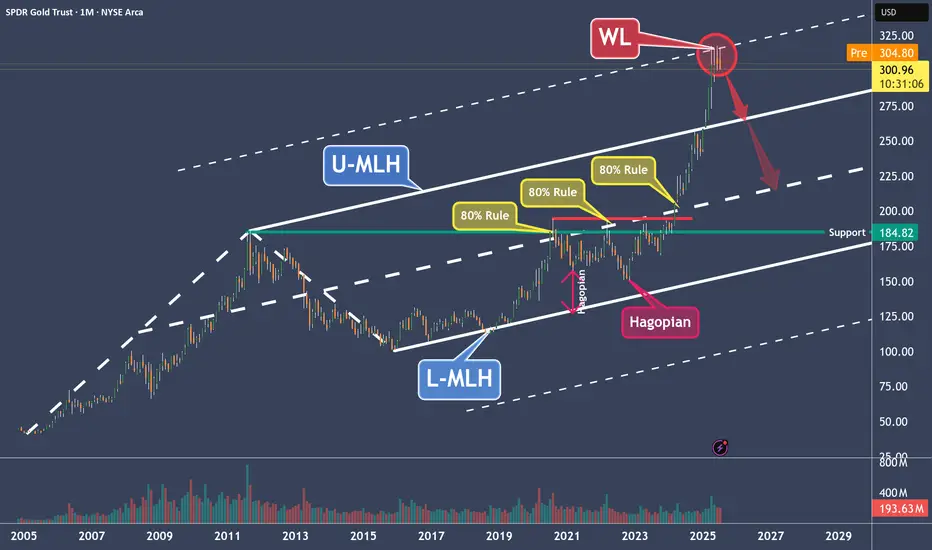
GLD – Why Gold Is a Clear Short to MePrice moved from the Lower Median Line (L-MLH) up to the Centerline, fulfilling the 80% rule.
Then we had two Hagopians, which sent price right back to the Centerline.
After the breakout above the Centerline, the next target was the Upper Median Line Parallel (U-MLH), which was reached rather quickly.
Finally, price broke above the U-MLH and was pulled up toward the Warning Line (WL).
Is this the end of the happy story?
I think so—because Gold has now reached its 2nd standard deviation, and there’s probably no more gas left in the tank.
The Trade:
- A logical target is the U-MLH.
- A secondary target is the Centerline.
At the very least, if you're long, this might be a good time to take some profits—because no tree grows to the moon.
For further details, I will follow-up with a Video explanation - See my Signature.
USDCHF Will Go Down From Resistance! Short!
Take a look at our analysis for USDCHF.
Time Frame: 9h
Current Trend: Bearish
Sentiment: Overbought (based on 7-period RSI)
Forecast: Bearish
The market is approaching a key horizontal level 0.813.
Considering the today's price action, probabilities will be high to see a movement to 0.806.
P.S
We determine oversold/overbought condition with RSI indicator.
When it drops below 30 - the market is considered to be oversold.
When it bounces above 70 - the market is considered to be overbought.
Disclosure: I am part of Trade Nation's Influencer program and receive a monthly fee for using their TradingView charts in my analysis.
Like and subscribe and comment my ideas if you enjoy them!

AUDUSD Will Go Lower! Sell!
Please, check our technical outlook for AUDUSD.
Time Frame: 9h
Current Trend: Bearish
Sentiment: Overbought (based on 7-period RSI)
Forecast: Bearish
The market is approaching a significant resistance area 0.645.
Due to the fact that we see a positive bearish reaction from the underlined area, I strongly believe that sellers will manage to push the price all the way down to 0.637 level.
P.S
Overbought describes a period of time where there has been a significant and consistent upward move in price over a period of time without much pullback.
Disclosure: I am part of Trade Nation's Influencer program and receive a monthly fee for using their TradingView charts in my analysis.
Like and subscribe and comment my ideas if you enjoy them!

GOLD Will Move Lower! Sell!
Here is our detailed technical review for GOLD.
Time Frame: 9h
Current Trend: Bearish
Sentiment: Overbought (based on 7-period RSI)
Forecast: Bearish
The market is testing a major horizontal structure 3,337.68.
Taking into consideration the structure & trend analysis, I believe that the market will reach 3,280.02 level soon.
P.S
The term oversold refers to a condition where an asset has traded lower in price and has the potential for a price bounce.
Overbought refers to market scenarios where the instrument is traded considerably higher than its fair value. Overvaluation is caused by market sentiments when there is positive news.
Disclosure: I am part of Trade Nation's Influencer program and receive a monthly fee for using their TradingView charts in my analysis.
Like and subscribe and comment my ideas if you enjoy them!

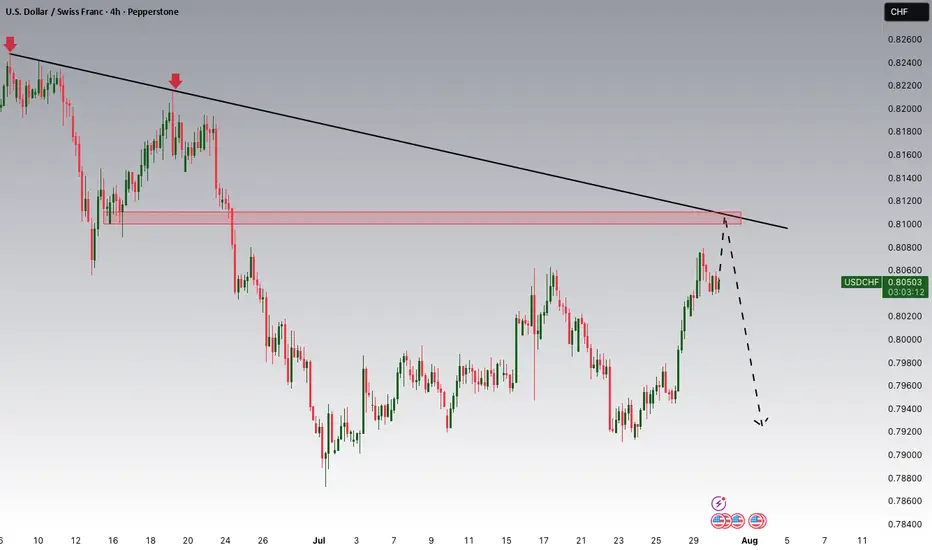
#015: USD/CHF SHORT Investment OpportunityHello readers, I'm Forex Trader Andrea Russo, and today I'd like to share this SHORT investment opportunity I've identified in the USD/CHF pair.
In recent days, USD/CHF has exhibited typical technical exhaustion behavior near key dynamic resistance. The area between 0.81300 and 0.81650 represented a significant supply zone, previously tested with an extended spike and immediately rejected.
The price violated the 200 EMA with an apparent breakout, but without real institutional volume to support the move. This was followed by a rapid retracement below the mean and a sideways movement, suggesting ongoing manipulation and liquidity building.
Meanwhile, global retail sentiment shows a significant anomaly: over 70% of retail traders are long. This imbalance increases the likelihood that market makers are preparing a bearish reversal to target the most fragile positions and restore equilibrium.
The 0.81420 level has been identified as a key point for a possible price reversion to the manipulative zone before the actual directional move. If the price reverts to this level, a technical spike is likely to be executed to complete the hunt for stops before the downtrend begins.
The trade targets a decline towards the 0.80000 area, which represents the first significant level of technical support and a realistic target if the reversal is confirmed.

USD/CAD SHORT FROM RESISTANCE
Hello, Friends!
It makes sense for us to go short on USD/CAD right now from the resistance line above with the target of 1.376 because of the confluence of the two strong factors which are the general downtrend on the previous 1W candle and the overbought situation on the lower TF determined by it’s proximity to the upper BB band.
Disclosure: I am part of Trade Nation's Influencer program and receive a monthly fee for using their TradingView charts in my analysis.
✅LIKE AND COMMENT MY IDEAS✅

USD/CHF BEARS WILL DOMINATE THE MARKET|SHORT
Hello, Friends!
Bearish trend on USD/CHF, defined by the red colour of the last week candle combined with the fact the pair is overbought based on the BB upper band proximity, makes me expect a bearish rebound from the resistance line above and a retest of the local target below at 0.804.
Disclosure: I am part of Trade Nation's Influencer program and receive a monthly fee for using their TradingView charts in my analysis.
✅LIKE AND COMMENT MY IDEAS✅

NZD/USD SELLERS WILL DOMINATE THE MARKET|SHORT
Hello, Friends!
NZD-USD uptrend evident from the last 1W green candle makes short trades more risky, but the current set-up targeting 0.594 area still presents a good opportunity for us to sell the pair because the resistance line is nearby and the BB upper band is close which indicates the overbought state of the NZD/USD pair.
Disclosure: I am part of Trade Nation's Influencer program and receive a monthly fee for using their TradingView charts in my analysis.
✅LIKE AND COMMENT MY IDEAS✅

SILVER SENDS CLEAR BEARISH SIGNALS|SHORT
SILVER SIGNAL
Trade Direction: short
Entry Level: 3,820.7
Target Level: 3,794.3
Stop Loss: 3,837.9
RISK PROFILE
Risk level: medium
Suggested risk: 1%
Timeframe: 1h
Disclosure: I am part of Trade Nation's Influencer program and receive a monthly fee for using their TradingView charts in my analysis.
✅LIKE AND COMMENT MY IDEAS✅

GBPJPY What Next? SELL!
My dear friends,
Please, find my technical outlook for GBPJPY below:
The price is coiling around a solid key level - 199.08
Bias - Bearish
Technical Indicators: Pivot Points Low anticipates a potential price reversal.
Super trend shows a clear sell, giving a perfect indicators' convergence.
Goal - 198.77
Safe Stop Loss - 199.23
About Used Indicators:
The pivot point itself is simply the average of the high, low and closing prices from the previous trading day.
Disclosure: I am part of Trade Nation's Influencer program and receive a monthly fee for using their TradingView charts in my analysis.
———————————
WISH YOU ALL LUCK

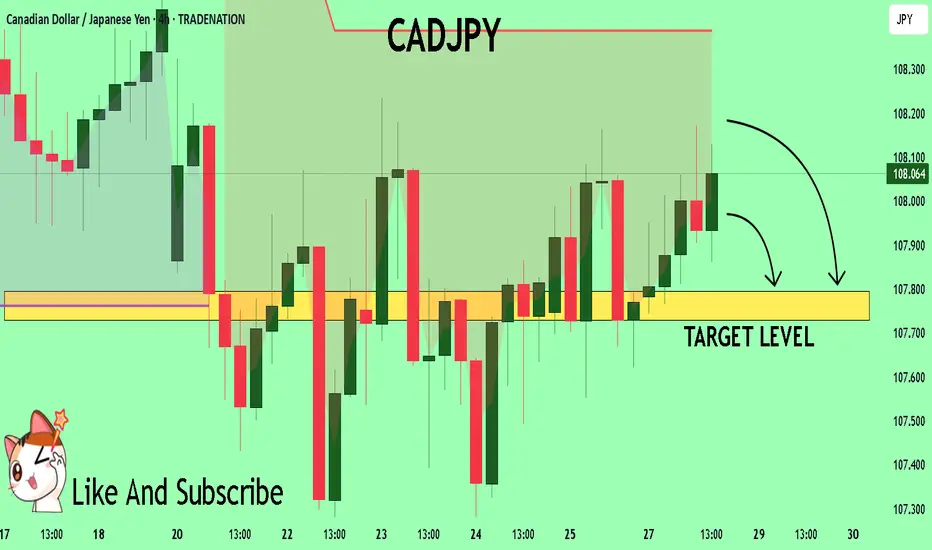
CADJPY Trading Opportunity! SELL!
My dear followers,
I analysed this chart on CADJPY and concluded the following:
The market is trading on 108.08 pivot level.
Bias - Bearish
Technical Indicators: Both Super Trend & Pivot HL indicate a highly probable Bearish continuation.
Target - 107.79
About Used Indicators:
A super-trend indicator is plotted on either above or below the closing price to signal a buy or sell. The indicator changes color, based on whether or not you should be buying. If the super-trend indicator moves below the closing price, the indicator turns green, and it signals an entry point or points to buy.
Disclosure: I am part of Trade Nation's Influencer program and receive a monthly fee for using their TradingView charts in my analysis.
———————————
WISH YOU ALL LUCK
USDJPY A Fall Expected! SELL!
My dear subscribers,
My technical analysis for USDJPY is below:
The price is coiling around a solid key level - 148.71
Bias - Bearish
Technical Indicators: Pivot Points Low anticipates a potential price reversal.
Super trend shows a clear sell, giving a perfect indicators' convergence.
Goal - 147.93
About Used Indicators:
By the very nature of the supertrend indicator, it offers firm support and resistance levels for traders to enter and exit trades. Additionally, it also provides signals for setting stop losses
Disclosure: I am part of Trade Nation's Influencer program and receive a monthly fee for using their TradingView charts in my analysis.
———————————
WISH YOU ALL LUCK

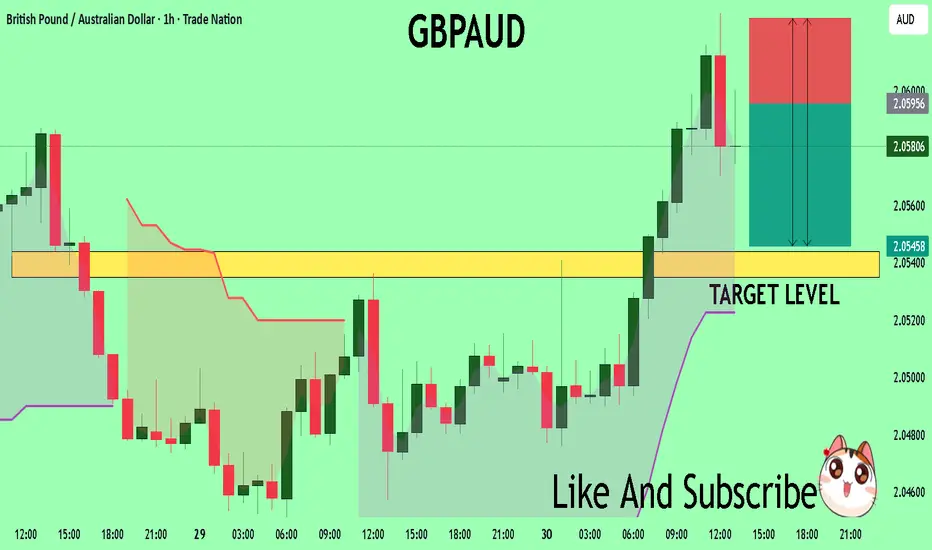
GBPAUD Massive Short! SELL!
My dear subscribers,
My technical analysis for GBPAUDis below:
The price is coiling around a solid key level - 2.0596
Bias - Bearish
Technical Indicators: Pivot Points Low anticipates a potential price reversal.
Super trend shows a clear sell, giving a perfect indicators' convergence.
Goal - 2.0543
My Stop Loss - 2.0626
About Used Indicators:
By the very nature of the supertrend indicator, it offers firm support and resistance levels for traders to enter and exit trades. Additionally, it also provides signals for setting stop losses
Disclosure: I am part of Trade Nation's Influencer program and receive a monthly fee for using their TradingView charts in my analysis.
———————————
WISH YOU ALL LUCK
USDCHF Potential DownsidesHey Traders, in today's trading session we are monitoring USDCHF for a selling opportunity around 0.81000 zone, USDCHF is trading in a downtrend and currently is in a correction phase in which it is approaching the trend at 0.81000 support and resistance area.
Trade safe, Joe.
GOLD: Bearish Continuation & Short Trade
GOLD
- Classic bearish pattern
- Our team expects retracement
SUGGESTED TRADE:
Swing Trade
Sell GOLD
Entry - 3331.7
Stop - 3334.0
Take - 3327.0
Our Risk - 1%
Start protection of your profits from lower levels
Disclosure: I am part of Trade Nation's Influencer program and receive a monthly fee for using their TradingView charts in my analysis.
❤️ Please, support our work with like & comment! ❤️

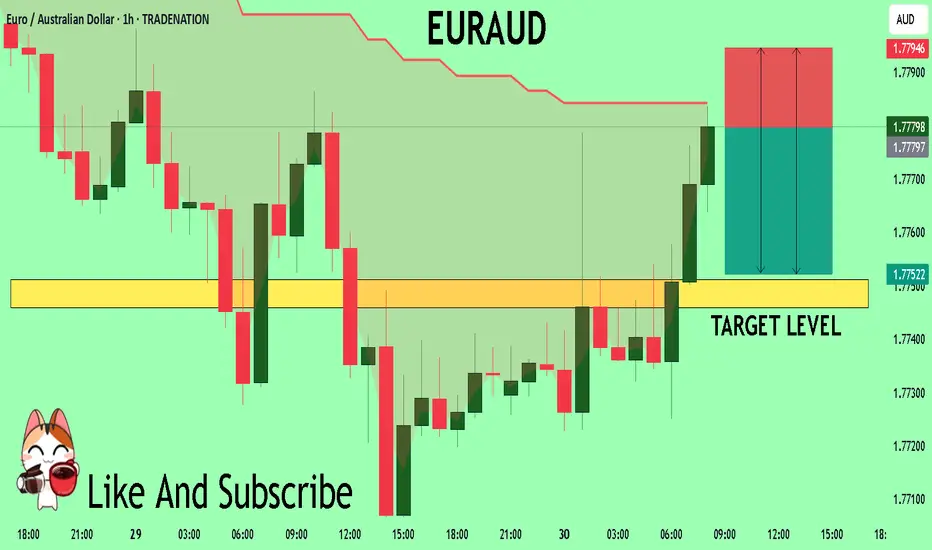
EURAUD Under Pressure! SELL!
My dear followers,
I analysed this chart on EURAUD and concluded the following:
The market is trading on 1.7780 pivot level.
Bias - Bearish
Technical Indicators: Both Super Trend & Pivot HL indicate a highly probable Bearish continuation.
Target - 1.7751
Safe Stop Loss - 1.7794
About Used Indicators:
A super-trend indicator is plotted on either above or below the closing price to signal a buy or sell. The indicator changes color, based on whether or not you should be buying. If the super-trend indicator moves below the closing price, the indicator turns green, and it signals an entry point or points to buy.
Disclosure: I am part of Trade Nation's Influencer program and receive a monthly fee for using their TradingView charts in my analysis.
———————————
WISH YOU ALL LUCK
USDCAD Is Bearish! Sell!
Please, check our technical outlook for USDCAD.
Time Frame: 7h
Current Trend: Bearish
Sentiment: Overbought (based on 7-period RSI)
Forecast: Bearish
The market is trading around a solid horizontal structure 1.377.
The above observations make me that the market will inevitably achieve 1.369 level.
P.S
We determine oversold/overbought condition with RSI indicator.
When it drops below 30 - the market is considered to be oversold.
When it bounces above 70 - the market is considered to be overbought.
Disclosure: I am part of Trade Nation's Influencer program and receive a monthly fee for using their TradingView charts in my analysis.
Like and subscribe and comment my ideas if you enjoy them!
