AUD/JPY BEARS WILL DOMINATE THE MARKET|SHORT
Hello, Friends!
We are now examining the AUD/JPY pair and we can see that the pair is going up locally while also being in a uptrend on the 1W TF. But there is also a powerful signal from the BB upper band being nearby, indicating that the pair is overbought so we can go short from the resistance line above and a target at 88.446 level.
Disclosure: I am part of Trade Nation's Influencer program and receive a monthly fee for using their TradingView charts in my analysis.
✅LIKE AND COMMENT MY IDEAS✅
Short

GBP/CAD SENDS CLEAR BEARISH SIGNALS|SHORT
Hello, Friends!
It makes sense for us to go short on GBP/CAD right now from the resistance line above with the target of 1.836 because of the confluence of the two strong factors which are the general downtrend on the previous 1W candle and the overbought situation on the lower TF determined by it’s proximity to the upper BB band.
Disclosure: I am part of Trade Nation's Influencer program and receive a monthly fee for using their TradingView charts in my analysis.
✅LIKE AND COMMENT MY IDEAS✅

GBPUSD Technical Analysis! SELL!
My dear followers,
This is my opinion on the GBPUSD next move:
The asset is approaching an important pivot point 1.3290
Bias - Bearish
Technical Indicators: Supper Trend generates a clear short signal while Pivot Point HL is currently determining the overall Bearish trend of the market.
Goal - 1.3252
About Used Indicators:
For more efficient signals, super-trend is used in combination with other indicators like Pivot Points.
Disclosure: I am part of Trade Nation's Influencer program and receive a monthly fee for using their TradingView charts in my analysis.
———————————
WISH YOU ALL LUCK

NATGAS Will Collapse! SELL!
My dear friends,
My technical analysis for NATGAS is below:
The market is trading on 3.787 pivot level.
Bias - Bearish
Technical Indicators: Both Super Trend & Pivot HL indicate a highly probable Bearish continuation.
Target - 3.487
Recommended Stop Loss - 3.956
About Used Indicators:
A pivot point is a technical analysis indicator, or calculations, used to determine the overall trend of the market over different time frames.
Disclosure: I am part of Trade Nation's Influencer program and receive a monthly fee for using their TradingView charts in my analysis.
———————————
WISH YOU ALL LUCK

US30 SHORT1. This is the deciding factor as it is at the high created last week and should have a lot of resistance
2. M15, M30 and H1 are overbought and there is a double top with divergence
3. This is a type 2 pattern on H4 however there is a smaller pattern on M15 below
4. Stop loss of 200 pips

Bitcoin can drop from wedge to 100K pointsHello traders, I want share with you my opinion about Bitcoin. After consolidating for an extended period within a triangle pattern, the price eventually broke out with strong bullish momentum. The move was supported by a solid rebound from the buyer zone and a clean breakout above the 92800 - 94200 support area. This breakout initiated a steep climb, forming a new upward wedge structure, defined by narrowing trend lines and rising local highs. Currently, the price is trading near the resistance boundary of the wedge, around the 104000 - 105000 zone. This zone has already triggered one rejection and is showing signs of weakening bullish strength. Given the rising wedge geometry and the fading impulse strength, the risk of a correction is increasing. The current structure typically leads to a pullback, especially after such a steep rise. I expect that BTC may rise to the resistance line of the wedge and then drop below the support line, thereby exiting from this pattern. That's why I set my TP 1 at the 100K points. Please share this idea with your friends and click Boost 🚀

GBPJPY Will Go Lower From Resistance! Sell!
Take a look at our analysis for GBPJPY.
Time Frame: 2h
Current Trend: Bearish
Sentiment: Overbought (based on 7-period RSI)
Forecast: Bearish
The market is on a crucial zone of supply 195.398.
The above-mentioned technicals clearly indicate the dominance of sellers on the market. I recommend shorting the instrument, aiming at 194.206 level.
P.S
We determine oversold/overbought condition with RSI indicator.
When it drops below 30 - the market is considered to be oversold.
When it bounces above 70 - the market is considered to be overbought.
Disclosure: I am part of Trade Nation's Influencer program and receive a monthly fee for using their TradingView charts in my analysis.
Like and subscribe and comment my ideas if you enjoy them!

BITCOIN BEARS ARE GAINING STRENGTH|SHORT
BITCOIN SIGNAL
Trade Direction: short
Entry Level: 103,219.31
Target Level: 92,838.77
Stop Loss: 110,139.67
RISK PROFILE
Risk level: medium
Suggested risk: 1%
Timeframe: 1D
Disclosure: I am part of Trade Nation's Influencer program and receive a monthly fee for using their TradingView charts in my analysis.
✅LIKE AND COMMENT MY IDEAS✅

GBP/JPY SELLERS WILL DOMINATE THE MARKET|SHORT
GBP/JPY SIGNAL
Trade Direction: short
Entry Level: 193.409
Target Level: 190.219
Stop Loss: 195.512
RISK PROFILE
Risk level: medium
Suggested risk: 1%
Timeframe: 1D
Disclosure: I am part of Trade Nation's Influencer program and receive a monthly fee for using their TradingView charts in my analysis.
✅LIKE AND COMMENT MY IDEAS✅

GBP/AUD BEST PLACE TO SELL FROM|SHORT
Hello, Friends!
GBP/AUD is trending down which is obvious from the red colour of the previous weekly candle. However, the price has locally surged into the overbought territory. Which can be told from its proximity to the BB upper band. Which presents a great trend following opportunity for a short trade from the resistance line above towards the demand level of 2.047.
Disclosure: I am part of Trade Nation's Influencer program and receive a monthly fee for using their TradingView charts in my analysis.
✅LIKE AND COMMENT MY IDEAS✅

EUR/JPY BEARISH BIAS RIGHT NOW| SHORT
Hello, Friends!
We are going short on the EUR/JPY with the target of 163.215 level, because the pair is overbought and will soon hit the resistance line above. We deduced the overbought condition from the price being near to the upper BB band. However, we should use low risk here because the 1W TF is green and gives us a counter-signal.
Disclosure: I am part of Trade Nation's Influencer program and receive a monthly fee for using their TradingView charts in my analysis.
✅LIKE AND COMMENT MY IDEAS✅

Are you shorting the bounce or waiting for confirmation?Japan’s Q1 GDP came in worse than expected: -0.2% QoQ (-0.7% annualized). Weak consumption, soft exports, and a fading external boost despite a weak yen isn't a great combo for Asia’s largest export economy.
The Nikkei 225 reacted immediately, and the H4 chart is starting to reflect deeper structural pressure.
🔍 Technical Outlook:
- Price reversed from the high of 38,745.
- Price is testing the 50 SMA and could enter the Ichimoku cloud.
- The cloud is signalling a twist, which could be a sign of momentum fading and the trend weakening or reversing.
📊 Projection:
If the price closes below the 50 SMA and breaks through the cloud, further downside could be expected, with the target levels at
- 36,800 (last consolidation zone), and
- 35,570 (38.2% fibonacci retracement level and 200 SMA).
Alternatively, if the bulls defend the cloud, we could see the price climb to the resistance level of 40,500
This is a classic macro meets technicals moment. A weak data print is lining up against the possibility of a technical rollover.

AUDUSD Massive Short! SELL!
My dear friends,
My technical analysis for AUDUSD is below:
The market is trading on 0.6454 pivot level.
Bias - Bearish
Technical Indicators: Both Super Trend & Pivot HL indicate a highly probable Bearish continuation.
Target - 0.6420
About Used Indicators:
A pivot point is a technical analysis indicator, or calculations, used to determine the overall trend of the market over different time frames.
Disclosure: I am part of Trade Nation's Influencer program and receive a monthly fee for using their TradingView charts in my analysis.
———————————
WISH YOU ALL LUCK

GBPCHF Buyers In Panic! SELL!
My dear subscribers,
GBPCHF looks like it will make a good move, and here are the details:
The market is trading on 1.1152 pivot level.
Bias - Bearish
My Stop Loss - 1.1212
Technical Indicators: Both Super Trend & Pivot HL indicate a highly probable Bearish continuation.
Target - 1.1032
About Used Indicators:
The average true range (ATR) plays an important role in 'Supertrend' as the indicator uses ATR to calculate its value. The ATR indicator signals the degree of price volatility.
Disclosure: I am part of Trade Nation's Influencer program and receive a monthly fee for using their TradingView charts in my analysis.
———————————
WISH YOU ALL LUCK

SHORT NZD/CNH 8H Investment Opportunity
Hello, I am trader Andrea Russo and today I want to talk to you about a SHORT investment opportunity on the NZD/CNH exchange rate.
Trade Details
The trade starts at the 4.40 area with a Stop Loss (SL) at 4.44 and a Take Profit (TP) at 4.21.
Market Analysis
Currently, the NZD/CNH exchange rate is around 4.381. The recent performance of the NZD has shown some volatility, influenced by economic factors such as inflation in New Zealand and trade policies. These elements have contributed to creating a context of uncertainty that could favor a decline in the exchange rate.
Trading Strategy
The proposed strategy involves entering a SHORT position at 4.40, anticipating a decline towards the level of 4.21. The Stop Loss at 4.44 is used to limit losses in case the market moves against our prediction. This setup offers a good risk/reward ratio, making the trade interesting for traders looking for short-term profit opportunities.
Final Thoughts
This trading opportunity requires careful risk management and constant monitoring of market conditions. The volatility of the NZD/CNH exchange rate can offer good profit opportunities, but it is essential to be prepared to react quickly to changes. It is advisable to stay updated on economic news and events that could affect the market.
Happy trading!

GOLD: Short Signal with Entry/SL/TP
GOLD
- Classic bearish setup
- Our team expects bearish continuation
SUGGESTED TRADE:
Swing Trade
Short GOLD
Entry Point - 3203.1
Stop Loss - 3212.0
Take Profit - 3181.7
Our Risk - 1%
Start protection of your profits from lower levels
Disclosure: I am part of Trade Nation's Influencer program and receive a monthly fee for using their TradingView charts in my analysis.
❤️ Please, support our work with like & comment! ❤️

GBPNZD The Target Is DOWN! SELL!
My dear subscribers,
This is my opinion on the GBPNZD next move:
The instrument tests an important psychological level 2.2639
Bias - Bearish
Technical Indicators: Supper Trend gives a precise Bearish signal, while Pivot Point HL predicts price changes and potential reversals in the market.
Target - 2.2493
About Used Indicators:
On the subsequent day, trading above the pivot point is thought to indicate ongoing bullish sentiment, while trading below the pivot point indicates bearish sentiment.
Disclosure: I am part of Trade Nation's Influencer program and receive a monthly fee for using their TradingView charts in my analysis.
———————————
WISH YOU ALL LUCK

GOLD - Price can continue to decline to support levelHi guys, this is my overview for XAUUSD, feel free to check it and write your feedback in comments👊
A few days ago price reached $3075 level, broke it, and then rose a little, but soon turned around and made correction movement.
Next, price entered to triangle, where it reached support line, at once, and then made an upward impulse.
Price broke $3075 level and soon reached and broke too $3290 level, after which Gold rose to resistance line.
After this, price turned around and corrected $3290 level, but then it came back to resistance line.
But recently, Gold dropped to support line of triangle, breaking $3290 level and making a gap, after which it exited from triangle.
Now I think XAU can make a retest, after exiting, and then continue to decline to $3075 support level.
If this post is useful to you, you can support me with like/boost and advice in comments❤️

BITCOIN Will Go Down! Short!
Take a look at our analysis for BITCOIN.
Time Frame: 6h
Current Trend: Bearish
Sentiment: Overbought (based on 7-period RSI)
Forecast: Bearish
The market is on a crucial zone of supply 102,528.88.
The above-mentioned technicals clearly indicate the dominance of sellers on the market. I recommend shorting the instrument, aiming at 97,324.69 level.
P.S
Please, note that an oversold/overbought condition can last for a long time, and therefore being oversold/overbought doesn't mean a price rally will come soon, or at all.
Disclosure: I am part of Trade Nation's Influencer program and receive a monthly fee for using their TradingView charts in my analysis.
Like and subscribe and comment my ideas if you enjoy them!

EURUSD Will Move Lower! Sell!
Please, check our technical outlook for EURUSD.
Time Frame: 12h
Current Trend: Bearish
Sentiment: Overbought (based on 7-period RSI)
Forecast: Bearish
The price is testing a key resistance 1.118.
Taking into consideration the current market trend & overbought RSI, chances will be high to see a bearish movement to the downside at least to 1.090 level.
P.S
The term oversold refers to a condition where an asset has traded lower in price and has the potential for a price bounce.
Overbought refers to market scenarios where the instrument is traded considerably higher than its fair value. Overvaluation is caused by market sentiments when there is positive news.
Disclosure: I am part of Trade Nation's Influencer program and receive a monthly fee for using their TradingView charts in my analysis.
Like and subscribe and comment my ideas if you enjoy them!

CVNA - Carvana at upper extreme. I'm shorting again!I stand by my posts about CVNA.
It's fishiy and it stinks!
Chart wise, price is at the upper extreme again.
A nice short is setting up, and this time for a much larger move...I think, feel, expect.
"...but, isn't there more to say? You MUST explain WHY and WHEN...", I have people saying.
No, it's not a joke.
I leave it with that §8-)

EURJPY Will Fall! Short!
Here is our detailed technical review for EURJPY.
Time Frame: 6h
Current Trend: Bearish
Sentiment: Overbought (based on 7-period RSI)
Forecast: Bearish
The market is approaching a significant resistance area 164.491.
Due to the fact that we see a positive bearish reaction from the underlined area, I strongly believe that sellers will manage to push the price all the way down to 163.510 level.
P.S
The term oversold refers to a condition where an asset has traded lower in price and has the potential for a price bounce.
Overbought refers to market scenarios where the instrument is traded considerably higher than its fair value. Overvaluation is caused by market sentiments when there is positive news.
Disclosure: I am part of Trade Nation's Influencer program and receive a monthly fee for using their TradingView charts in my analysis.
Like and subscribe and comment my ideas if you enjoy them!

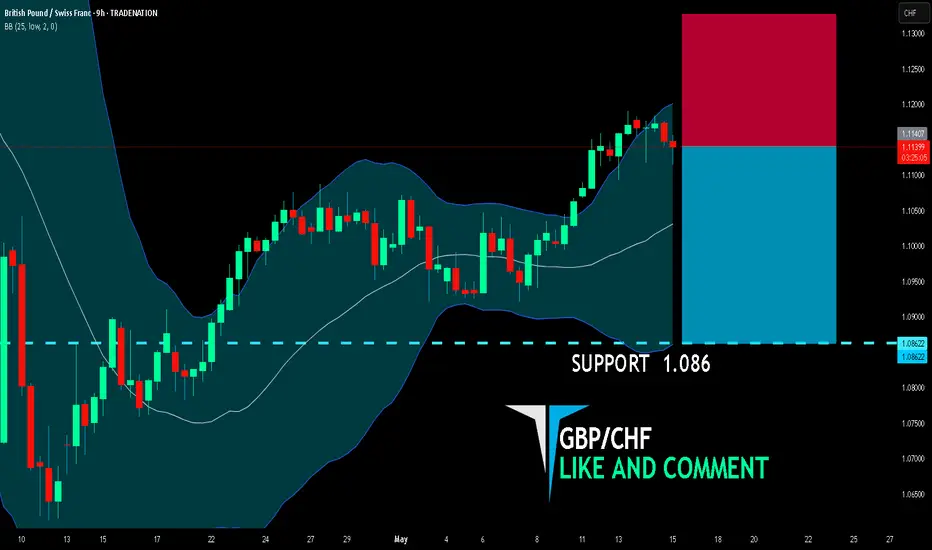
GBP/CHF SHORT FROM RESISTANCE
GBP/CHF SIGNAL
Trade Direction: short
Entry Level: 1.114
Target Level: 1.086
Stop Loss: 1.132
RISK PROFILE
Risk level: medium
Suggested risk: 1%
Timeframe: 9h
Disclosure: I am part of Trade Nation's Influencer program and receive a monthly fee for using their TradingView charts in my analysis.
✅LIKE AND COMMENT MY IDEAS✅