BTC, Selling pressure below 100K, 23 JunePlan BTC today: 23 June 2025
Related Information:!!!
Market capitalisation fell to $3.03 trillion over the weekend, likely due to speculators expecting a sell-off in response to US strikes on targets in Iran. However, the limited reaction from traditional financial markets brought buyers back to the crypto space, showing their willingness to buy at a discount and pushing market capitalisation back up to $3.12 trillion.
The cryptocurrency sentiment index dropped to 42 on Sunday, its lowest level in two months, but rebounded to 47 at the start of the new week, moving from the fear zone into neutral territory.
Bitcoin slipped to $98K over the weekend, briefly touching the classic support level at 61.8% of the April–May rally. However, by the start of the European trading session, it had already recovered to around $102K, compared to $102.7K at the beginning of Sunday. Still, last week’s sell-off broke the 50-day moving average support, weighed down by external factors. A breakout from the $96K–$105K range will likely determine the direction of the next major move
personal opinion:!!!
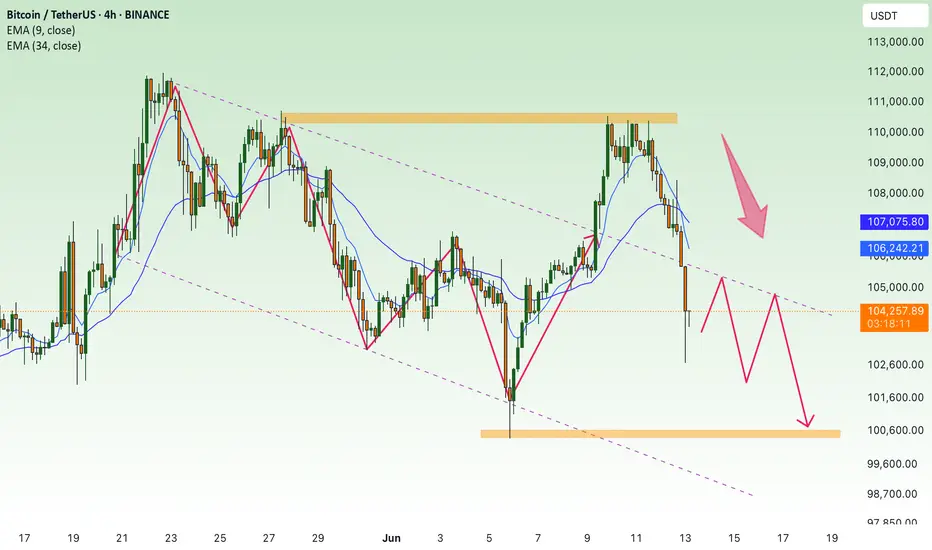
Selling pressure caused gold price to drop below 100k yesterday, macro economy has not changed much. Gold price continues to suffer selling pressure
Important price zone to consider :!!!
support zone : 100.800 ; 98.200
Sustainable trading to beat the market
Shortbtc

BTC accumulates, back to 108,500Plan BTC today: 16 June 2025
Related Information:
The price of gold is nearing its all-time high as tensions in the Middle East escalate, but analysts say they’re doubtful Bitcoin will do the same as investors prioritize other safe-haven assets.
The price of gold rose to $3,450 per ounce on Monday, just $50 shy of its all-time high of just below $3,500 in April, according to TradingView.
The usually slow-to-move asset has gained a whopping 30% since the beginning of the year, catalyzed by US President Donald Trump’s trade tariffs and, more recently, an escalation of military action in the Middle East following an Israeli missile strike on Iran on June 13, which caused Bitcoin prices to fall.
Gold prices have also been linked with inflationary pressures, as it is considered a safe haven and an inflation hedge by investors.
personal opinion:
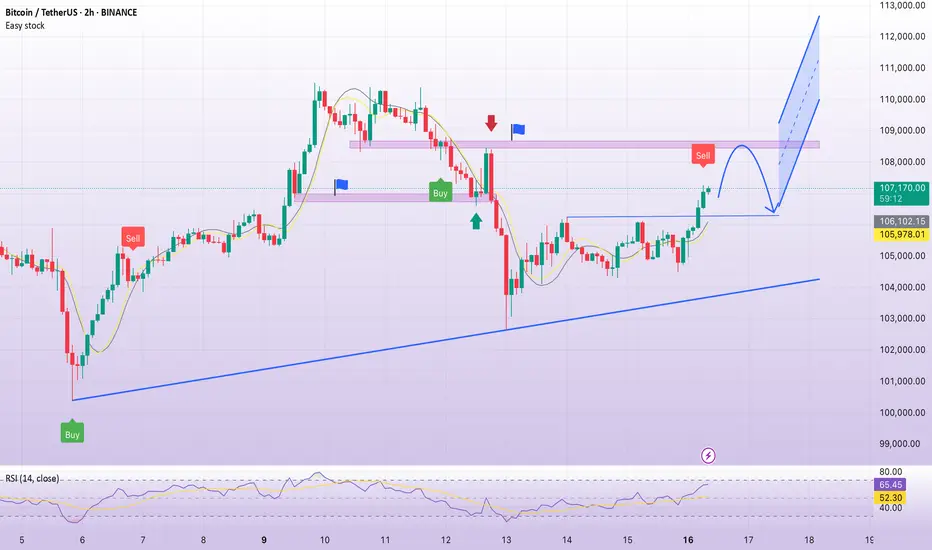
The crypto market recovered at the beginning of the week after being affected by war news. It will almost certainly continue to maintain the 4.5% interest rate, so it will be difficult to break ATH this week.
Important price zone to consider :
Sell point: zone 108.400 - 108.600 SL : 109.100
Take profit : 107.900 - 107.000 - 106.000
Sustainable trading to beat the market
BTC Short-term selling pressure due to war news💎 BTC PLAN UPDATE (June 13)
NOTABLE NEWS ABOUT BTC:
Prices of Bitcoin (BTC), Ethereum (ETH), and Ripple (XRP) slipped as rising geopolitical tensions between Israel and Iran sparked a wave of risk aversion across crypto markets. As uncertainty deepens, the three largest cryptocurrencies by market capitalization are on track to close the week in the red, with current price action signaling the potential for a deeper correction.
Bitcoin bears regain control
After failing to reclaim its all-time high of $111,980 earlier in the week, Bitcoin lost upward momentum and began a steady pullback, slipping below key support at $106,406 on Thursday. As of Friday, BTC continues its downward trajectory, hovering near the 50-day Exponential Moving Average (EMA) at $102,447.
TECHNICAL ANALYSIS PERSPECTIVE:
We successfully identified the peak at the 110K resistance level. As predicted, BTC dropped $7,000 following disappointing CPI and PPI reports. Currently, the price has fallen back into a descending channel pattern and is expected to decline further.
Bitcoin’s upward trend is under threat as funding rates become more constrained.
Earlier this week, Bitcoin hovered near its all-time high of $111,980, but market sentiment remained alarmingly cautious—likely due to uncertainty in the macroeconomic environment.
The path of least resistance is gradually shifting downward, especially as the Relative Strength Index (RSI) falls to the midline at 50 from a recent high of 64 on the daily chart. Traders will look for bearish confirmation signals from the Moving Average Convergence Divergence (MACD) indicator—signaled when the blue MACD line crosses below the red signal line.
Watch for long positions around the 100K price area, with a target back to 103K. If the price breaks below the 100K support level, we should avoid holding onto a bullish bias.
At this time, whether you’re a newcomer or experienced trader, it’s advisable to spend time practicing and reinforcing technical analysis knowledge. Explore educational posts on the channel to build a stronger foundation and avoid potential losses.
==> This analysis is for reference only. Wishing all investors successful trades!
BTC Returns to Highest ATH💎 Update Plan BTC (June 10)
BlackRock’s spot Bitcoin ETF has made history, becoming the fastest-growing exchange-traded fund (ETF) ever by surpassing $70 billion in assets under management (AUM).
The iShares Bitcoin Trust (IBIT), launched in January 2024, has achieved this milestone in record time, reflecting surging demand for Bitcoin exposure through regulated, mainstream investment vehicles. IBIT’s exceptional growth trajectory has outpaced all previous ETFs, eclipsing even established funds like the SPDR Gold Shares (GLD) in terms of asset accumulation speed.
The ETF recently returned to net inflows — posting a $274 million single-day increase — following a brief period of outflows during a broader market pullback. This rebound signals renewed investor confidence, with capital flowing in from both institutional players and retail investors alike, underscoring Bitcoin’s growing role in diversified portfolios.
Technical analysis angle
Congratulations to investors when the Plan transaction has detected the bottom of 100k and is currently the highest at 110.5k. It is a prosperous signal for investors who are holding this power currency
Another good news is that the organizers have breaked out of the decrease price channel to confirm the trend of increasing and confidence in the price increase continues to be enhanced by the Buyer.
Currently, the BTC price area is slowed by the resistance level with Fibo 0.786 around the 110k price area. We expect the adjustment of the investors to collect goods before the price area goes further around 111.5k even 115k
At this time, whether new or old, should spend more time to practice, load more knowledge about the PTKT, as well as find knowledge posts at the channel ..., to strengthen the solid foundation, as well as avoid losing money at this time offline
==> Comments for trend reference. Wishing investors successfully trading

BTC short term correction: zone 100k💎 BTC PLAN UPDATE (June 2)
NOTABLE NEWS ABOUT BTC:
Meta shareholders have decisively voted down a proposal to explore adding Bitcoin to the company’s balance sheet, signaling limited appetite for crypto exposure at the tech giant.
According to a regulatory filing dated May 28, the “Bitcoin treasury assessment” proposal garnered just 3.92 million votes in favor — representing a mere 0.08% of total shares — while nearly 5 billion votes against it.
Given that CEO Mark Zuckerberg holds 61% of Meta's voting power, as disclosed in an April filing, it is likely he played a pivotal role in rejecting the measure.
TECHNICAL ANALYSIS PERSPECTIVE
Bitcoin closed below the daily support level of $106,406 on Thursday and fell another 1.50% the following day. However, prices saw a slight recovery over the weekend. As of Monday's writing, BTC is trading below $105,500.
Assuming BTC faces resistance around the $106,406 daily level and continues correcting, it could extend the decline to retest the psychologically important $100,000 mark.
The Relative Strength Index (RSI) on the daily chart is at 53, trending down toward the neutral level of 50, indicating weakening bullish momentum. The Moving Average Convergence Divergence (MACD) also showed a bearish crossover last week. The increasing red histogram bars below the baseline further signal a potential correction ahead.
At this point, whether you are new or experienced, it’s advised to spend more time practicing and enhancing your knowledge of technical analysis. Consider exploring educational posts on the channel (…) to strengthen your foundation and avoid losses during this period.
==> This is a trend-based analysis for reference only. Wishing all investors successful trades!

continue sideways, BTC accumulates below 88K💎 BTC PLAN UPDATE (April 18)
The recovery of the D frame shows the optimistic sentiment of the market, believing that in the second quarter of 2025 the market will heat up again. The FED lowers interest rates, the group raises tariffs.
NOTABLE NEWS ABOUT BTC:
Recent trends suggest that Bitcoin ETF sell-offs during price surges often foreshadow significant market pullbacks. Notably, substantial outflows were recorded from BlackRock’s IBIT and Ark Invest’s ARKB ETFs, each losing over $113 million in assets.
Should the sell-off by seasoned U.S. institutional investors persist into Thursday, cautious sentiment may spread to strategic retail and mid-tier traders, deterring them from initiating large bullish positions. This risk-averse stance could help explain Bitcoin’s current stagnation near $84,600, even as top-performing altcoins like Solana outpace it with stronger gains over the past 24 hours.
TECHNICAL VIEW
BTC price needs to surpass 92-93K to enter the next big growth period. However, political instability and tariffs are holding back BTC's breakout. Price will continue to sideway and accumulate around 82-86K
Short time frame, sideway around 84k, slow liquidity.
==> Comments are for reference only. Wish investors successful trading

$BTC 1DBitcoin has formed a double top on the daily timeframe and failed to break above its resistance level. On the other hand, it couldn't hold its minor support either and has broken the level. I'm waiting for a pullback.
However, the price might show some reactions around the 92 level. If that level is lost, I have identified the next support level based on the weekly structure.

BTC - All the talk and hype has one reason...to lure you in to buying NOW.
Do you really think the big investors are gonna buy at these levels?
I doubt.
First, they lure you in.
Then they throw you over the Cliff and rob your bag of Bitcoin when price is tanking.
Until I see a full bar outside of the U-MLH of the red downsloping Pitchfork, I'm not adding.
But, when it comes down to the red Center-Line, then I'm ready to buy aggressively.

Countertrend Trade BTCUSDTAlthough the trend on a larger timeframe supports upward movement, short sell plays also provide a noteworthy risk-to-reward ratio. Therefore, short trades have larger reward comparing to the long trades at this moment
Trading Strategies;
1) Scale in short at only 30% of the desired positions at this moment/supply zone around 44k-44.5k
2) Move in to 100% of short position at 45k-47k
3) SL if the price goes beyond 48k
Note: Trading against trend is considered as a high risk taking trade. Please ensure to follow the plan and stop loss when required. Most importantly, understand your position sizing and accept the amount of money you can lose before going in on a trade

Mr. Bigshort back again with a huge move for the DXYGet ready for the DXY to make its accent back to the upside, 1st stop 108.35 then 119.88, inversely Bitcoin will make its decent back to the 29,850 range. Happy Trading Folk

btc short ideaI feel like BTC will correct again, maybe this is ridiculous, but it could happen.. preying and being preyed upon has become a basic need in the market.... this is not the best idea, this is also not trading advice,. .stay DYOR before starting.. ...

TEMPORARY Bearish BTC scenarioI am short on BTC, targets at 25k. we broke out of the recent bullish momentum and we are rejecting a strong liquidity zone.

SHORT TO TIMEZONE, BUY REVERSE TRENDProjected buy entry time line is between 21th April to 15th May 2023
Correction floor is expected between this timezone
Price range to expect a turning point is between 13432 to 16627
Price range must align with projected timeline for a stronger turning point.
So first trade is a sell entry with TP on any of the two projected timelines
Trade 2 is a buy and hold entry with first at 34400.
Use reasonable stoploss according to risk

BTC welcomes Bearish WeekHi all,
A big green and a red Doji on the weekly close of BTC with RSI in the overbought zone indicates that we are heading towards a bearish week.
Good day

Short on $BTCBTC$ looks like is getting weak here and might flip to bear, it needs to retest major support lines (25K) before continuing higher, sorry guys it can't just keep going higher, people lose money in this game and make sure to follow me so you don't.


Short on $BTCPrice is not respecting the important zones no retest I think it's a fake/scam pump it needs to retest if it wants to show a real move


Swing BTC daily 1D timeframe ₿BTC is in sideway from Feb 16th. We can see red high volume at zone 24785, but today I'm seeing the daily red candle close in valuable range so my plan is going to short it.
My plan is really simple. Price can move down to zone 22884 or 21405
22884 is really a strong support for now.
21405 zone will be the next support for BTC if buyers at 22884 zone could not protect their positions.
Let see how BTC goes :)
Happy trading guys :) B

Short BTC/USDT 1H Hello everybody
Shhhhhort smart idea
1h TF
SL 25250
TP 23500-22800
Have nice day
GLHF
NFA

BTC we are not in bull market.Hello Birdies,
You heard it right! we are not in bull market it is just a relief rally and nothing else.
Finally, BTC is making 3 drive patterns with bearish divergence on every drive.
One final drive is left the high top is 24,387 but that is too obvious right. Wait for a fakeout around 25,200 - 25,250 is a good idea.
Trace it and Trace smart guys!

wait for short on BTChello
the target has been reach.
but consider that dont open any long position .because this is very important support zone and you should not open a long position before break out
so we predect short for BTC and market in this time frame and daliy time frame but we will update when we will be sure of onchain.
good lock
The information provided on this Page does not constitute investment advice, financial advice, trading advice, or any other sort of advice and you should not treat any of the website's content as such. this page does not recommend that any cryptocurrency should be bought, sold, or held by you. Do conduct your own due diligence and consult your financial advisor before making any investment decisions
