NasdaqAs said before, nasdaq going down, can take out highs then plummet, but time will tell. PS: my previous posts got removed. View auto supply and demand zones indicator. Dm me free for a month free. (It draws snd zones).
Shorts

A quick sell and easy profit on XAUUSDI believe you can get two short positions at the marked area,
Please check first and wait for approval then enter.


LINK SHORT It seems like a lower high has now formed. Following the trend positioning into a short position makes sense here.

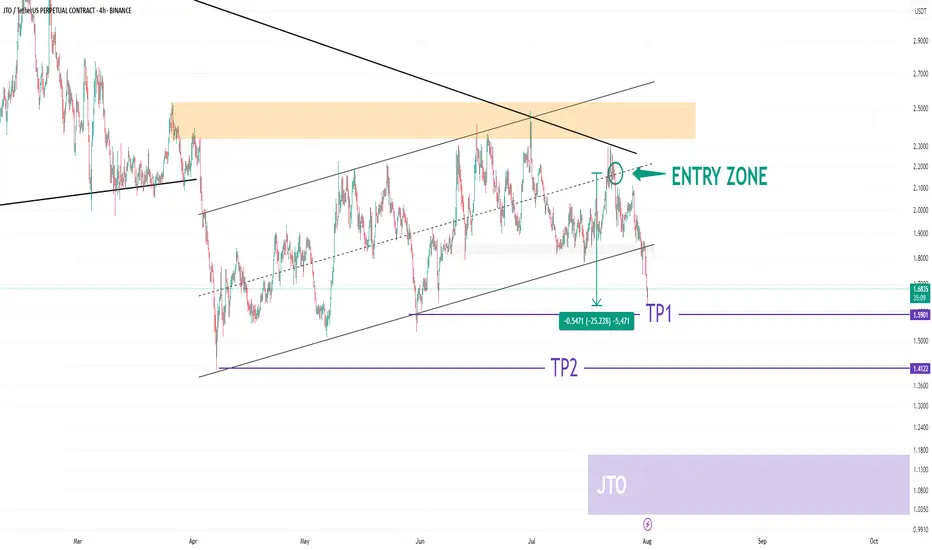
JTO USDT UpdateHELLO 😍
JTO Update
💁♂️ -25% 🔥
I shared this analysis when it was in the entry section. It would be nice to have an update of this analysis.
The JTO cryptocurrency has corrected 25% since the entry zone.
We saw a very good analysis together. What do you think? 😊💖
You can save some profit from the position in this area. 🐱
Please don't forget to like, share, and boost so that I can analyze it for you with more enthusiasm. Thank you. 💖😍
Get out now! Bullmarket might be over This is LMACD applied to GC with reduced lag. If this time is not different we just had our cycle top ~123k. Sell some coins and buy back around 2026 ~44K

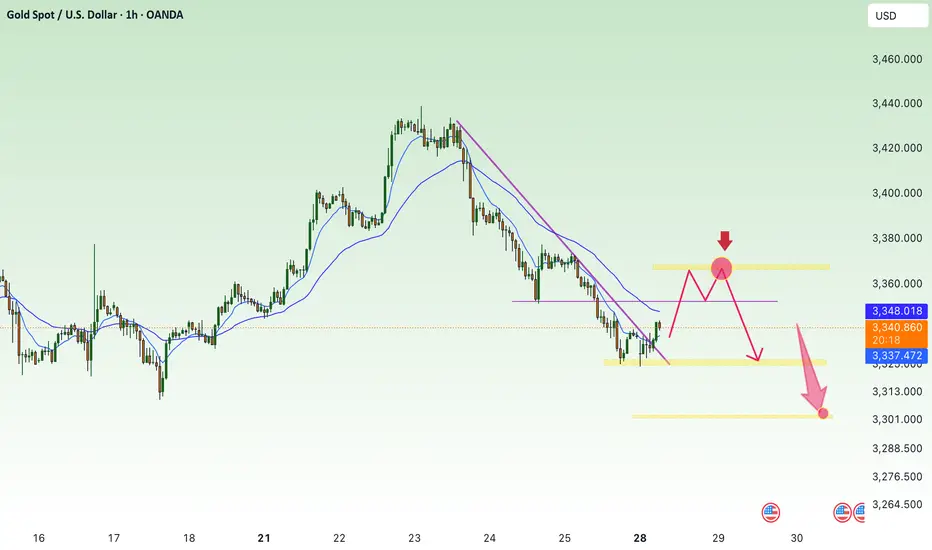
downtrend below 3300 , after ADP-NF⭐️GOLDEN INFORMATION:
The Federal Reserve’s policy statement noted that economic activity has slowed in the first half of the year, although the unemployment rate remains low and inflation is still “somewhat elevated.” The Fed reaffirmed its commitment to achieving maximum employment and returning inflation to its 2% target, while also acknowledging that “uncertainty around the economic outlook remains elevated.”
Earlier data showed that U.S. GDP grew in the second quarter, but underlying details painted a softer picture. Consumer spending cooled, and business investment declined significantly. According to Reuters, most economists now forecast full-year GDP growth at 1.5%, below the Fed’s 1.8% projection.
⭐️Personal comments NOVA:
Gold prices reacted negatively as the FED kept interest rates unchanged and Chairman POWELL's hawkish stance. Selling pressure below 3300 is being maintained.
⭐️SET UP GOLD PRICE:
🔥SELL GOLD zone: 3360- 3362 SL 3367
TP1: $3350
TP2: $3340
TP3: $3330
🔥BUY GOLD zone: $3249-$3247 SL $3242
TP1: $3258
TP2: $3270
TP3: $3285
⭐️Technical analysis:
Based on technical indicators EMA 34, EMA89 and support resistance areas to set up a reasonable SELL order.
⭐️NOTE:
Note: Nova wishes traders to manage their capital well
- take the number of lots that match your capital
- Takeprofit equal to 4-6% of capital account
- Stoplose equal to 2-3% of capital account

Get liquidity at the beginning of the week, continue to decrease⭐️GOLDEN INFORMATION:
Gold (XAU/USD) continues to lose ground, slipping to around $3,335 in early Asian trading on Monday. The metal is on its fourth straight day of declines as easing geopolitical tensions and trade progress weaken safe-haven demand. Investors are now turning their focus to the upcoming FOMC policy decision on Wednesday.
Market sentiment has improved following a breakthrough in US–EU trade talks, with both sides agreeing to a uniform 15% tariff on traded goods, effectively ending months of stalemate. The new tariffs will come into effect on August 1. Meanwhile, the US and China are reportedly planning to extend their tariff truce for another three months, according to the South China Morning Post. The renewed risk appetite continues to pressure gold, traditionally favored in times of uncertainty.
⭐️Personal comments NOVA:
Short-term recovery in Asian session, gold price takes liquidity and continues to accumulate below 3369
⭐️SET UP GOLD PRICE:
🔥SELL GOLD zone: 3369- 3371 SL 3376
TP1: $3360
TP2: $3350
TP3: $3340
🔥BUY GOLD zone: $3305-$3303 SL $3298
TP1: $3314
TP2: $3330
TP3: $3342
⭐️Technical analysis:
Based on technical indicators EMA 34, EMA89 and support resistance areas to set up a reasonable SELL order.
⭐️NOTE:
Note: Nova wishes traders to manage their capital well
- take the number of lots that match your capital
- Takeprofit equal to 4-6% of capital account
- Stoplose equal to 2-3% of capital account
GBPUSD SHORTSPrice closed the week bearish. There’s a daily head and shoulders pattern as well. Looking for price to continue bearish towards daily support. I’d like for price to retrace and create a LH before looking to get back into shorts.

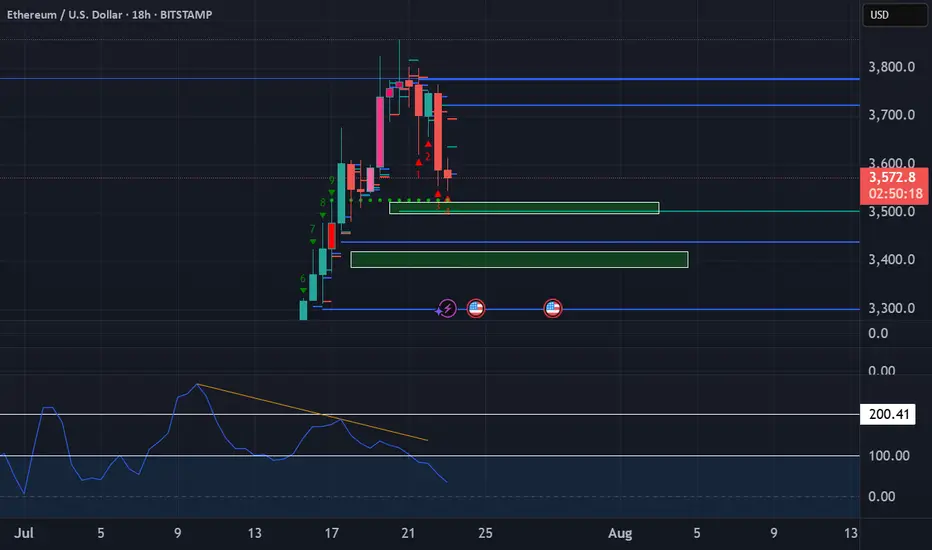
Ethereum short updateDon't be surprised to see some buying coming into play at the POI's highlighted below.
Hedging involves entering into a trade that is expected to perform in the opposite direction of an existing position, effectively protecting against potential losses.
sideways in weekend downtrend⭐️GOLDEN INFORMATION:
Gold prices (XAU/USD) struggle to extend Thursday’s recovery from the $3,309 region—a one-week low—consolidating within a tight range during Friday’s Asian session. The US Dollar (USD) continues to retreat from its peak since June 23, pressured by dovish signals from Federal Reserve (Fed) Governor Christopher Waller.
Additionally, growing concerns over US President Donald Trump’s unpredictable trade policies and their potential consequences for global growth are keeping investors cautious, supporting demand for the safe-haven metal. These factors collectively help limit deeper losses in Gold, though the metal lacks clear bullish momentum for now.
⭐️Personal comments NOVA:
Gold price is moving sideways, accumulating in the downtrend line, not much fluctuation in weekend news
⭐️SET UP GOLD PRICE:
🔥SELL GOLD zone: 3381- 3379 SL 3386
TP1: $3370
TP2: $3360
TP3: $3350
🔥BUY GOLD zone: $3293-$3295 SL $3288
TP1: $3308
TP2: $3318
TP3: $3330
⭐️Technical analysis:
Based on technical indicators EMA 34, EMA89 and support resistance areas to set up a reasonable SELL order.
⭐️NOTE:
Note: Nova wishes traders to manage their capital well
- take the number of lots that match your capital
- Takeprofit equal to 4-6% of capital account
- Stoplose equal to 2-3% of capital account

downtrend, back to 3300 gold price⭐️GOLDEN INFORMATION:
Gold prices (XAU/USD) inch higher in early Asian trading on Wednesday, recovering part of Tuesday’s sharp decline to multi-day lows, though follow-through buying remains limited. Lingering uncertainty surrounding US President Donald Trump’s trade tariffs, combined with expectations that the Federal Reserve (Fed) will maintain elevated interest rates, continues to dampen risk appetite. This weaker market mood is providing modest support to the safe-haven metal.
Meanwhile, the US Dollar (USD) eases slightly after Tuesday’s surge to its highest level since late June, which is helping gold stabilize. However, persistent speculation that the Fed may delay rate cuts, following a slight uptick in US inflation, continues to bolster the greenback and could cap further gains in gold. Traders remain cautious and await today’s US Producer Price Index (PPI) release for clearer direction.
⭐️Personal comments NOVA:
Selling pressure, break 3340 downtrend line continues. Economic news is helping DXY recover
⭐️SET UP GOLD PRICE:
🔥SELL GOLD zone: 3381- 3383 SL 3388
TP1: $3370
TP2: $3360
TP3: $3350
🔥BUY GOLD zone: $3306-$3304 SL $3299
TP1: $3318
TP2: $3330
TP3: $3343
⭐️Technical analysis:
Based on technical indicators EMA 34, EMA89 and support resistance areas to set up a reasonable SELL order.
⭐️NOTE:
Note: Nova wishes traders to manage their capital well
- take the number of lots that match your capital
- Takeprofit equal to 4-6% of capital account
- Stoplose equal to 2-3% of capital account

Bitcoin Eyes $200K: Why a Correction Could Come FirstAs Bitcoin continues its remarkable run, optimism is high that we could see BTC break the $200,000 mark this year. The momentum is there, with bullish sentiment across the crypto and traditional finance spaces. Yet, it’s important to acknowledge a potential short-term correction ahead before new highs are reached.
Why a Correction May Happen Soon
Several factors point to a volatile period in the weeks ahead:
Upcoming Tariffs: On August 1st, the new round of tariffs announced by President Trump is set to take effect. Trade disputes historically introduce uncertainty into global markets and can sap risk appetite, even in alternative assets like crypto.
Federal Reserve Policy: The Federal Reserve has not yet begun lowering interest rates. High rates continue to pressure both equity and crypto markets by making cash relatively more attractive and increasing the cost of leverage.
Geopolitical Tensions: Ongoing instability in the Middle East adds another layer of unpredictability. Geopolitical flare-ups often lead to market volatility as investors act defensively.
The Takeaway
While Bitcoin is on track to reach unprecedented levels this year, investors should remain mindful of the broader market context. Short-term corrections are part of any healthy bull run and can be driven by macroeconomic and geopolitical events. Staying informed and maintaining a disciplined approach will be crucial for navigating what promises to be an exciting—and eventful—rest of the year.
Not Investment Advice!
#crypto #bitcoin #short #correction #dump #uncertainty #volatility #war #news #bearish

GBPAUD Weekly Trade Setup–Parallel Channel Breakdown Opportunity1. Overview of GBPAUD Technical Setup
As of 15th July 2025, the GBPAUD 4-hour chart reflects a price currently positioned at a critical support level around 2.0470–2.0480, which has held multiple times since early April. The price action leading to this point has formed a classic descending parallel channel, with price making lower highs and testing horizontal support with increased frequency.
Key observations:
Price is well below the 200 EMA (currently around 2.0794), confirming a bearish long-term bias.
The resistance zone at 2.1070–2.1120 has proven strong over time, pushing back multiple rallies.
Price is compressing — getting squeezed into the lower boundary of the channel with shorter pullbacks, often a precursor to breakout.
The setup is aligning for a high-probability short trade, with a potential move toward the next major demand zone around 2.0100.
The Breakdown Thesis – What We See on the Chart
The current structure of GBPAUD tells a very clear story:
After a rally in early April, price has been trading within a consolidation range, failing to make higher highs.
The support around 2.0470 has now been tested repeatedly with lower bounces each time.
Price recently made a lower high and returned to support with momentum, increasing the probability of a breakdown.
We are expecting a bearish breakout of this support level, followed by a re-test of the broken zone, and then a strong downside continuation.
Risk Management Strategy
Every trade setup — no matter how technically perfect — must begin with a strong risk management plan.
For this GBPAUD setup:
Entry Trigger: Breakdown below 2.0470 and successful re-test rejection with bearish candle confirmation
Stop Loss: Above re-test high; ideally, just above 2.0530 (~66 pips risk)
Target 1: 2.0300 (170+ pips)
Target 2: 2.0200
Target 3 / Final: 2.0100 (potential 370+ pip move)
This gives us an excellent Risk:Reward ratio of ~1:5 or more, allowing traders to be wrong several times and still remain profitable over time.
Opportunities in the market don’t come from guessing — they come from waiting. The GBPAUD parallel channel setup is a brilliant example of structure-based trading that combines logic with discipline. Whether you're a full-time FX trader or a part-time swing participant, setups like these are where consistency is built.
Watch the breakdown. Wait for the re-test. Execute only when the market confirms your plan.
Happy Trading!
=================================================================
Disclosure: I am part of Trade Nation's Influencer program and receive a monthly fee for using their TradingView charts in my analysis.
=================================================================

Accumulated above 3300, market is sideways⭐️GOLDEN INFORMATION:
Gold prices posted modest gains on Wednesday, supported by a pullback in US Treasury yields, even as the US Dollar remained firm against major currencies. Market sentiment continued to be driven by trade developments, while the Federal Reserve’s latest meeting minutes revealed that policymakers are still leaning toward a rate cut in 2025. At the time of writing, XAU/USD is trading at $3,312, up 0.31%.
The FOMC minutes indicated that the majority of Fed officials believe a rate cut this year would be appropriate, with a few members open to the possibility of initiating a reduction as early as July—provided the economic data continues to align with expectations.
⭐️Personal comments NOVA:
Gold price recovered to 3320, mainly still accumulating, waiting psychology on current tariff situation of countries
⭐️SET UP GOLD PRICE:
🔥SELL GOLD zone: 3358- 3360 SL 3365
TP1: $3345
TP2: $3332
TP3: $3320
🔥BUY GOLD zone: $3245-$3247 SL $3240
TP1: $3256
TP2: $3269
TP3: $3280
⭐️Technical analysis:
Based on technical indicators EMA 34, EMA89 and support resistance areas to set up a reasonable BUY order.
⭐️NOTE:
Note: Nova wishes traders to manage their capital well
- take the number of lots that match your capital
- Takeprofit equal to 4-6% of capital account
- Stoplose equal to 2-3% of capital account


H4 Gold AnalysisThis is my set up,
this is what i look.
always DYOR
always protect your equity and use a risk management

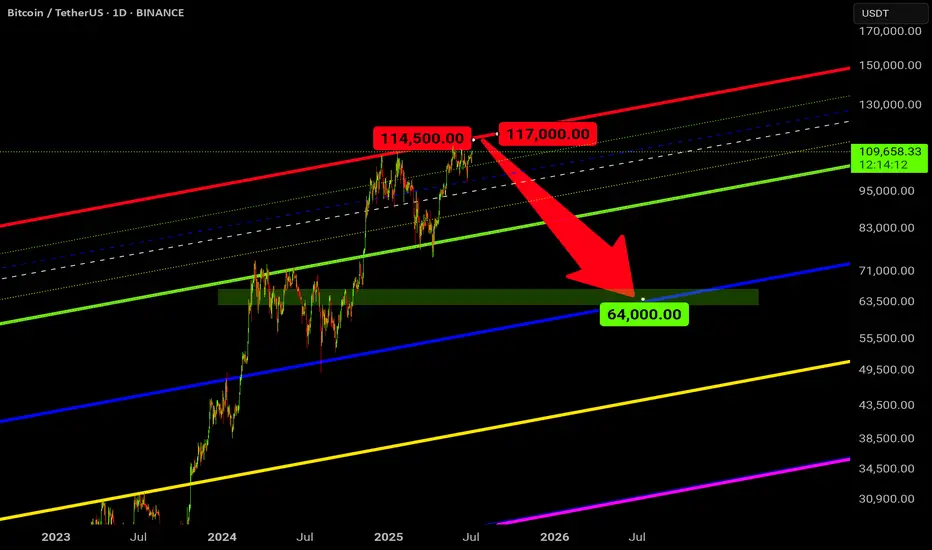
BTC Sell ShortThis is how I see Bitcoin in a year's time : the beginning of a bear market and the end of a bull market .
Short idea: INMB (WILL NOT WORK)Inmune Bio originally focused on using a dominant-negative TNF protein (DN-TNF) for cancer immunotherapy, which failed to show efficacy. Now, they’ve pivoted to neurology—repurposing the same molecule (XPro1595) for Alzheimer’s. The science behind targeting neuroinflammation is still early, and their approach lacks robust clinical validation.
They're in Phase 2, but data is sparse, the trial is small, and biomarkers—not clinical outcomes—are the main readout. With limited cash (~$20M as of last filing) and a high burn rate, they’ll likely need to raise before any real catalyst hits. High risk of dilution, weak scientific precedent, and a recycled failed asset = recipe for another disappointment.
Conclusion: This Alzheimer’s pivot feels like a Hail Mary. Market’s giving them credit for a turnaround that probably won’t work again ❌

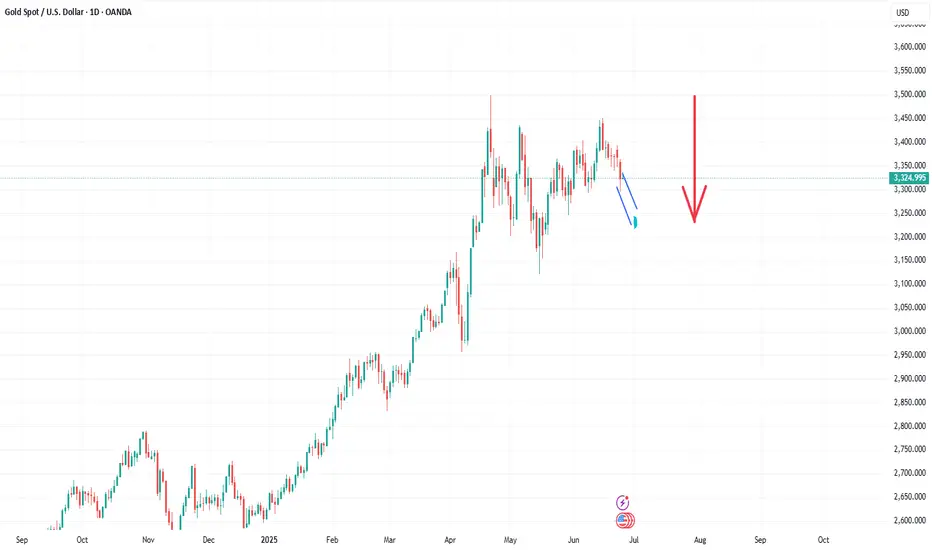
Gold (XAUUSD) – Preparing for a Sharp Pullback🟡 Market Outlook – Late June 2025
📉 Geopolitical Shift
Recent diplomatic progress has eased tensions between Iran, Israel, and the U.S. A ceasefire is now in place, reportedly supported by U.S. mediation efforts. Iran is also signaling openness to resuming nuclear discussions — a major shift that reduces geopolitical risk in the region.
📈 Risk-On Mood in Markets
Traditional markets have responded strongly:
Nasdaq-100 reached all-time highs
S&P 500 up ~1.1%
Dow Jones gained over 500 points
These are clear signs that investor sentiment is shifting away from fear and toward risk assets.
🛢️ Oil Prices Cooling
Crude oil has dropped significantly:
Brent and WTI are both down 6–7%
This drop reflects reduced concerns about a supply shock and confirms that energy markets are not pricing in a wider conflict.
🥇 Gold Losing Momentum
Gold failed to sustain above $3,445 and is now facing strong selling pressure. The easing geopolitical risk, dropping oil, and rising equities are all bearish signals for gold.
🎯 My short-term target: $3,218
As the safe-haven demand continues to fade, I expect XAUUSD to test the $3,218 level in the coming days.
🪙 Meanwhile in Crypto
Bitcoin and other crypto assets are rallying, benefiting from capital rotation and the renewed risk appetite. BTC could be eyeing new all-time highs as gold pulls back.
⚠️ Not financial advice – always do your own research.
Trade Idea: XAUUSD Short (SELL LIMIT) 1. Trend Alignment: H1 shows a clear down-trend — lower highs at 3446 → 3397 → 3347. SMAs on H1/M15 have turned down.
2. High-Probability Pullback: Price has broken the 3340 support twice and pulled back. Resistance here is offering a tight stop and plenty of room to TP.
3. Structural SL: Stop sits just above the prior swing high (~3350–3352)
Entry
Sell Limit @ 3340.37
Prior day low (now resistance) on H1 & M15
Stop Loss
3352.00
Just above the swing high around 3350–3351
Take Profit
3293.07
Invalidation
15 min candle close < 3310
Time Expiry
8:30 AM PST
Cancel if not triggered by then
FUSIONMARKETS:XAUUSD

SHORT @ London Open - Monday June 23rd 2025I believe Sellers are in control of the auctions. I see a nice distribution wall above to launch shorts from. Target the 150 where there seems to be liquidity target making sense of a short trade. ALWAYS wait for Lopen. Demand may come in and take over 6025/Dist Wall. If so there is plenty to like about the LONGS then with liquidity above. How price comes into 6025 at Lopen is what we need to be looking for.

NASDAQ Short-Term Outlook (Study Purpose Only)The NASDAQ index is showing signs of short-term weakness following a rejection near the 22,000–22,200 resistance zone. The recent breakdown from the consolidation range suggests bearish sentiment is building.
🔻 Key Observations:
Stop Loss Zone: 22,192
Price should ideally remain below this level for a bearish setup to remain valid. A move above this zone may invalidate the downside scenario.
Immediate Support Level: 21,010
If selling pressure continues, this is the first potential bounce zone. Watch price behavior closely here.
Deeper Support Target: 20,223
A break below 21,000 could open the door for a drop toward the 20,200 area — a previous accumulation/support level.
⚠️ Risk Management:
Traders may consider this type of setup if looking for short positions, but only with tight risk controls and clear confirmation of trend continuation.
📝 Disclaimer:
This analysis is strictly for study and educational purposes. It is not financial advice or a recommendation to take a trading position. Please consult a licensed financial advisor before making any investment decisions.
