sell pull back and obThere was a bullish rally on a larger time frame, then a pullback but the liquidity shifted opposite to the trend so that liquidity could be grabbed, that is why it looks bullish and if it had to go, it would have gone by blocking the order but it failed and now there is a high possibility of going downside by taking liquidity from the top.
Shorts

Bitcoin moving downwardsHello dear friends.
According to the chart and the performance that Bitcoin has shown, it seems that we are in a short-term downtrend.
Bitcoin is expected to move to the resistance of 104,700 and then we will have a rebound.
❗Please note that this is an analysis and the possibility of a reversal is possible.

NZDUSD TEMPORARY SHORTPURELY TECHNICAL
Though with projections of growth, NZDUSD has been consolidating and trading between $0.60 and $0.58 for over a month. A sell position would be ideal at $0.60 as corroborated by the yellow line of the TDI indicator trending above 63 on the 1hr timeframe. Additionally, $0.60 appears to be the test limit to verify the appetite of potential buyers and so far, there is little insensitive to keep buying above $0.60. Moreover, the daily timeframe shows consistent rejection of prices above $0.60

#COOKIEUSDT maintains bearish momentum📉 SHORT BYBIT:COOKIEUSDT.P from $0.2787
🛡 Stop loss: $0.2925
🕒 Timeframe: 4H
✅ Market Overview:
➡️ A Rising Wedge pattern has formed and broken down, confirming bearish momentum.
➡️ Price has broken below the wedge and the POC level at $0.2976, turning it into resistance.
➡️ Strong volume cluster at $0.2976–$0.2925 is now likely to act as a rejection zone.
➡️ Bearish pressure is visible through high-volume red candles.
➡️ Arrows on the chart indicate a continuation toward the take-profit levels.
🎯 TP Targets:
💎 TP 1: $0.2660
💎 TP 2: $0.2515
💎 TP 3: $0.2395
📢 Watch how price reacts BYBIT:COOKIEUSDT.P to TP1 — weak bounce may signal room for deeper drop.
🚀 BYBIT:COOKIEUSDT.P maintains bearish momentum — further downside expected!

PLTR, It's Been RealAt a high of 125, it's had a great run, but a double top has formed going into earnings and a US government which may be forced into austerity. Insiders have been selling for months with no net buys
- First Price target down to the neckline at 76
- Next price target would be 42 for the last real breakout test
- Final PT would be 24 if the double top played out completely

UJ ANALYSISOverall price is bearish but has been on a bullish run as of recent. Price rejected off daily resistance and formed an H4 LH. So price could definitely transition to bearish. Also, it's a minor head & shoulders so if price break the neckline, look for sells.

SHORT - GOLD (XAU/USD): Decending Triangle on GOLD Good Morning, Traders.
As always, please note that this is not financial advice — always do your own research (DYOR).
This morning, we are observing the development of a descending triangle pattern on the 15-minute timeframe, forming at a critical support level. This technical formation is often indicative of bearish momentum.
Should the price action decisively break below this key support, it would signal a potential shorting opportunity. Such a breakdown could trigger accelerated selling pressure, offering the possibility of favourable risk-to-reward setups for short positions.
Traders are advised to closely monitor price behavior around the support line, watch for increased volume on the break, and ensure proper risk management before entering any positions.
Stay vigilant and trade smart.

UnitedHealth Group faces DOJ criminal probeUnitedHealth Group faces DOJ criminal probe amid stock turmoil. Will the gaps be filled? (and most importantly when)
This situation shows the critical importance of compliance and transparency in the healthcare industry, especially for companies managing public funds.
UnitedHealth Group is under a criminal investigation by the U.S. Department of Justice for potential Medicare fraud, as reported by the Wall Street Journal. This follows a civil inquiry earlier this year and a separate Senate investigation into the company's Medicare billing practices.
The company's stock has experienced significant volatility, recently closing at $308.01, marking a 48% decline over the past month and a 40% drop year-over-year. Analysts have adjusted their outlooks accordingly, with Oppenheimer setting a price target of $400, KeyBanc at $450, and B of A Securities at $350.
#trading #tradingcards #tradingstrategy #daytrading #swingtrading #stocktrading #optionstrading

Will it fall? Yes. The reasons are HERE!Reasons why it will drop:
1. hypurrscan.io
This is an insider — take a closer look.
2. Selling pressure during the first attempt to rise.
3. Selling pressure is still ongoing.
4. Very low liquidity ahead. It's easy to push the price down because the rise happened with almost no consolidation.
5. Whoever is applying pressure needs to accumulate cheaper.

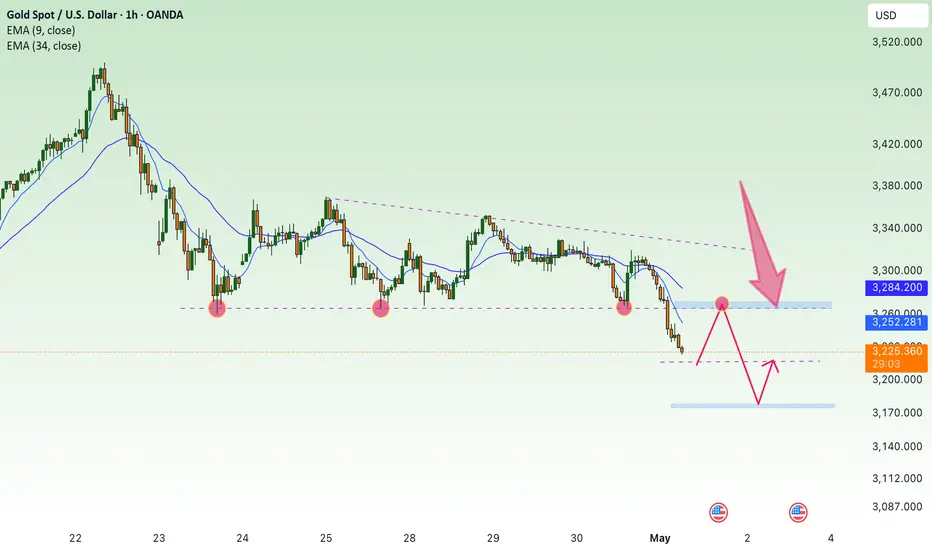
Bears are active at the beginning of the week, prices are down⭐️GOLDEN INFORMATION:
The United States and China announced “substantial progress” following two days of trade negotiations in Switzerland, marking a potential turning point in efforts to ease tensions between the world’s two largest economies. Chinese Vice Premier He Lifeng characterized the discussions as “an important first step” toward stabilizing bilateral trade, while US Treasury Secretary Scott Bessent echoed the sentiment, noting meaningful advancements were made. The US is expected to release more details about the outcome of the talks on Monday.
While signs of progress may dampen demand for safe-haven assets like gold, lingering uncertainty around the specifics of any deal could still lend some support to the precious metal. “Ongoing ambiguity surrounding tariffs remains one of the most influential factors sustaining gold,” noted David Meger, Director of Metals Trading at High Ridge Futures.
⭐️Personal comments NOVA:
The short-term downtrend is maintained, gold price accumulates around 3300 and continues to go down to lower support zones.
⭐️SET UP GOLD PRICE:
🔥SELL GOLD zone : 3315- 3317 SL 3322
TP1: $3300
TP2: $3290
TP3: $3280
🔥BUY GOLD zone: $3223 - $3225 SL $3218
TP1: $3238
TP2: $3245
TP3: $3260
⭐️Technical analysis:
Based on technical indicators EMA 34, EMA89 and support resistance areas to set up a reasonable sell order.
⭐️NOTE:
Note: Nova wishes traders to manage their capital well
- take the number of lots that match your capital
- Takeprofit equal to 4-6% of capital account
- Stoplose equal to 2-3% of capital account

Trade Idea: US30 Short ( SELL STOP )Technical Analysis Overview:
1. Daily Chart:
• Price has retraced sharply into resistance (near 41,300–41,400), rejecting the 200-day EMA zone.
• MACD still negative but turning up—suggests potential for a failed bounce.
• RSI at 55.33—approaching overbought in a corrective move, ripe for reversal.
2. 15-Min Chart:
• Bearish divergence forming on RSI with lower highs.
• MACD is turning down with momentum fading after a recent high around 41,665.
• Price has broken short-term moving average support, with momentum shifting down.
3. 3-Min Chart:
• Clear bearish structure with lower highs and lower lows.
• MACD and RSI confirm short-term weakness.
• Price hovering near local support (around 41,302), if broken, would confirm further downside.
⸻
Fundamental Context (Macro):
• FOMC & NFP results (recent) suggest continued uncertainty in interest rate direction.
• US manufacturing and employment data have shown mixed signals—equities vulnerable to downside corrections amid macro volatility.
• Seasonally, May is often a pullback month (“Sell in May”).
⸻
TRADE IDEA – SHORT US30
• Entry: 41,295 (current price at resistance zone)
• Stop-Loss (SL): 41,670 (above recent intraday high and 15-min resistance)
• Take-Profit (TP): 40,500 (prior support zone on 15-min chart)
FUSIONMARKETS:US30

SELL BTC - $99,400 BTC has arrived as forecasted into its next resistance zone. That should be abundantly clear from 150 colored lines I have on my super straight forward chart. ( sike ) I could go into great detail as to why I lean toward this is another local high, but why? I never do that. Just check out the results. We'll see how it goes. Comments and DM's always welcome Happy Trading. GO Murry, GO Gann, GO Elliot GO Kumar.

EURUSD | Head‑&‑Shoulders on the Brink – Bears Eye 1.1250📉 Trade Thesis
A textbook Head‑and‑Shoulders has completed on the 30‑min EURUSD chart. Price is now testing the rising neckline drawn from mid‑April swing lows. A clean close and retest beneath that trendline opens room toward the next demand shelf and the lower boundary of the broader ascending channel.
🎯 Execution Plan
Entry: wait for a decisive candle close below the neckline, then look to short on a minor pull‑back into that broken support.
Stop: just above the right‑shoulder high to keep risk tight.
Target: the measured‑move objective sits near the channel median/support cluster highlighted on the chart; scale out as price approaches that zone.
🧩 Confluence Factors
Momentum loss: RSI made a lower peak on the “head” versus the prior thrust, signalling fading upside energy.
Event risk: upcoming NFP/ISM releases may fuel USD volatility, providing the catalyst for a break.
Structure: the right shoulder’s supply shelf has capped every rally since late April, reinforcing bearish pressure.
⚠️ Risk Management
Macro data can produce whipsaws—size positions accordingly and stick to the plan. Move stops to breakeven once price pushes convincingly away from the neckline.
For educational purposes only. Trade your own strategy & manage risk.

Cold shower for bitcoinAs I mentioned earlier — when gold cools down, Bitcoin tends to rise. And when gold climbs, Bitcoin usually takes a breather. Don’t forget this dynamic.

Simple Technical Analysis for Bitcoin
If the price closes above $69,150, then, God willing, we may head toward the next target at $107,000.
However, if it closes below this level, the likely direction would be toward $84,200.
In my personal view — and God knows best — the chances of a downward move seem higher than an upward one at the moment.

Gold price weakens, correction 3176⭐️GOLDEN INFORMATION:
Gold’s intraday decline appears partly driven by technical selling pressure after decisively breaking below the key $3,265–$3,260 support zone. However, the US Dollar (USD) struggles to sustain any significant recovery as expectations grow for more aggressive Federal Reserve (Fed) rate cuts—fueled by an unexpected contraction in US GDP and signs of softening inflation. These factors may continue to support demand for the non-yielding precious metal, suggesting that traders should remain cautious before anticipating a deeper pullback from the recent all-time high near $3,500.
⭐️Personal comments NOVA:
Crossing the 3264 mark in the sideways price zone, gold prices continue to weaken.
⭐️SET UP GOLD PRICE:
🔥SELL GOLD zone : 3270- 3272 SL 3277
TP1: $3260
TP2: $3250
TP3: $3240
🔥BUY GOLD zone: $3178 - $3176 SL $3171
TP1: $3185
TP2: $3200
TP3: $3210
⭐️Technical analysis:
Based on technical indicators EMA 34, EMA89 and support resistance areas to set up a reasonable SELL order.
⭐️NOTE:
Note: Nova wishes traders to manage their capital well
- take the number of lots that match your capital
- Takeprofit equal to 4-6% of capital account
- Stoplose equal to 2-3% of capital account
Gold price heading below 3300⭐️GOLDEN INFORMATION:
Federal Reserve (Fed) officials have signaled openness to potential interest rate cuts, a stance that could limit further upside in the US Dollar (USD) and lend support to the non-yielding Gold price. Additionally, growing concerns over the economic repercussions of President Donald Trump’s aggressive tariff measures, combined with ongoing geopolitical instability, continue to bolster the appeal of safe-haven assets. In this environment, the broader bias for gold remains tilted to the upside, urging caution for traders considering bold bearish positions.
⭐️Personal comments NOVA:
continue sideways, price range fluctuates around 3300
⭐️SET UP GOLD PRICE:
🔥SELL GOLD zone : 3382- 3384 SL 3389
TP1: $3370
TP2: $3360
TP3: $3350
🔥BUY GOLD zone: $3294 - $3292 SL $3287
TP1: $3300
TP2: $3310
TP3: $3320
⭐️Technical analysis:
Based on technical indicators EMA 34, EMA89 and support resistance areas to set up a reasonable SELL order.
⭐️NOTE:
Note: Nova wishes traders to manage their capital well
- take the number of lots that match your capital
- Takeprofit equal to 4-6% of capital account
- Stoplose equal to 2-3% of capital account

Trade Idea: US30 Short (SELL STOP)1. Technical Analysis
Daily Chart
• Trend: Still overall bullish long-term, but in a short-term pullback phase after peaking.
• MACD: Bearish crossover with widening histogram — indicating continued downside momentum.
• RSI: At 45.05 — neutral-bearish, room to fall to oversold.
• Price: Strong reaction at ~37675.05 area, bounced back to ~39562, forming a potential lower high.
15-Min Chart
• MACD: Recently crossed bearish after a sharp rally.
• Price Action: Approaching resistance zone (~39562), failed to make a new high.
• RSI: 44.78 — leaning bearish, but not oversold yet.
3-Min Chart
• MACD: Just flipped bullish but weak — suggesting possible micro pullback before continuation.
• RSI: 48.82 — very neutral, no extreme condition.
⸻
2. Fundamental Context (as of April 2025)
• Recent sharp pullback from all-time highs hints at risk-off sentiment returning.
• Likely driven by Fed rate uncertainty, inflationary stickiness, or geopolitical jitters.
• Earnings season volatility could also play a role.
• No strong bullish macro catalyst to support a fresh rally continuation yet.
⸻
3. Trade Setup: SHORT Position
Bias: SHORT
Reason: Price hit resistance at 39562, confirmed by 15M MACD cross and RSI weakness. Daily still bearish momentum. No major bullish catalyst.
⸻
ENTRY:
39550 (near current resistance, confirmed failure to break higher)
STOP LOSS (SL):
39800 (above recent minor high, above 15M key level)
TAKE PROFIT (TP):
38900 — Minor support zone, clean level from 15M + previous consolidation area
FUSIONMARKETS:US30

GOLD ( XAU:USD) : Potential Bearish Pennant + Correction WaveGood morning, traders.
Please note, this is Not Financial Advice (NFA) —always conduct your own research and risk management.
1. Technical Analysis
We are currently observing the formation of a potential bearish pennant, with price action consolidating between converging trendlines. This formation appears to align closely with the Elliott Wave correction structure, particularly within the A-B leg. The apex of the pennant lies just after wave (B), suggesting a potential breakdown into wave (C), completing the corrective sequence.
Should this pattern confirm, we could anticipate a continuation of the downward movement, targeting deeper support zones in line with previous wave (4) levels.
2. Trend Structure
Wave (5) appears to have completed, initiating the A-B-C correction.
The corrective leg A → B is now complete, with price action consolidating near the upper resistance of the pennant.
A breakdown below the lower support trendline could confirm wave C in motion, reinforcing the bearish outlook.
3.) Macro Environment & Market Sentiment
Recent developments from the U.S. administration have introduced uncertainty in macroeconomic policy:
Tariffs:
Former President Donald Trump has hinted at a potential rollback of the 145% tariffs on Chinese goods, acknowledging their long-term unsustainability. Treasury Secretary Scott Bessent clarified that any changes would be part of bilateral negotiations and not unilateral actions. Major U.S. retailers have raised concerns over ongoing supply chain disruptions, adding pressure to de-escalate trade tensions. However, Trump insists tariffs won’t be eliminated completely, signaling no immediate resolution.
Federal Reserve Leadership:
Trump also walked back earlier statements threatening to dismiss Federal Reserve Chair Jerome Powell, now affirming that Powell will serve out his term until May 2026 . While this move has slightly calmed markets, Trump continues to pressure the Fed to lower interest rates amid persistent inflationary concerns. Although this softening stance introduces a degree of stability, the underlying tension between fiscal and monetary authorities remains.

GBP/USD: The Wizard's Descent from the Double Top MountainGBP/USD: The Wizard's Descent from the Double Top Mountain
Technical Analysis:
GBP/USD 4H chart shows a clear Double Top formation at approximately 1.3725, a critical resistance level
The Treasure Hunter indicator has shifted color, signaling bearish momentum building (Hero taking damage)
Our Wizard's Journey progress bar indicates we're at 50% completion of the Mountain Pass, suggesting we're at a prime reversal point
Currently testing Elite Level 235 resistance zone (2345 XP), with declining XP Progress (35%)
Forecast:
Anticipating a significant pullback from current resistance
Initial Minion Zone at 1.3200 provides first target level
Watch for confirmation with HERO's Health declining from current 100%
Trading Strategy:
Short position opportunity forming with ELITE LvL 2 resistance rejecting price advance
Stop loss placement above Double Top at 1.3750
Risk/reward favorable with multiple support levels to target
Watch 4H candle closes below 1.3690 for entry confirmation
Quest Status: Active - Prepare for the wizard's descent from the mountain peak!

$QQQ - Headed for the Next Leg DownNASDAQ:QQQ - Headed for the Next Leg Down
Bearish Wedge broke down today!
Measured Move: $377.15
Measured Timeframe: 06May
Below my H5_D Indicator and the Wr% is in motion down to the Green Barrier.
All signs are pointing LOWER!
Not Financial Advice

CHFJPY SHORTI see on daily divergence, we have trend line brake two times on 1h that is indication for short.

Trade Idea: US30 Short (SELL STOP)Technical Analysis Summary:
Daily Chart (Macro View):
• Trend: Bearish short-term (price is below the moving average, sharp recent drop).
• MACD: Bearish momentum building with a deepening histogram.
• RSI: At 42.22, pointing down – no oversold condition yet, so further downside is probable.
15-Minute Chart (Mid-Term Momentum):
• Trend: Recently broke down from consolidation, failed to reclaim previous high.
• MACD: Strong bearish crossover, deep in negative territory.
• RSI: At 39.20, not oversold – room to fall.
3-Minute Chart (Entry Timing):
• Trend: Weak recovery attempt stalled below moving average.
• MACD: Flat to downtrend.
• RSI: Around 40, suggesting more downside pressure without being oversold.
⸻
Fundamental Context (if relevant to US30):
• Rising geopolitical tensions and weak earnings reports (assumed).
• Dovish Fed fading, bond yields rising — bearish for equities.
• Fear-driven sentiment often hurts cyclical indices like US30.
⸻
Trade Setup (SHORT):
• Entry: 39595 (current price area as per charts).
• Stop Loss (SL): 40087
(Above minor resistance and 15M consolidation top)
• Take Profit (TP): 38650
(Recent support zone, room for price to breathe before demand zone)
FUSIONMARKETS:US30
