SOL throwback short setup formingShort Entry : 133
TP : 122
SL : 136.5
My trading is based on momentum, and the chart said that SOL is going to retest the previous 4H breakout resistance.
Shorts

Trade Idea: US30 Short ( MARKET ) Daily Chart (Macro View):
• Bearish divergence: RSI is at 47.38 and turning down — no strong bullish momentum.
• Recent bounce is sharp but came after a massive drop, suggesting a dead cat bounce or retracement.
• MACD remains heavily bearish (-836), showing underlying weakness despite the current bounce.
• Price recently rejected a key resistance near 40,850, aligning with previous support-turned-resistance levels.
15-Min Chart (Medium-Term):
• RSI is at 78.76 — overbought territory.
• Price surged parabolically, forming potential exhaustion.
• MACD shows very high positive values (672.341), usually precedes a correction.
• Potential bearish divergence between price and MACD.
3-Min Chart (Entry Timing):
• Price has stalled at the top, consolidating after an extreme spike.
• MACD and RSI are curling down.
• Ideal for timing a short entry.
⸻
Trade Idea: SHORT US30
• Entry: 40,850 (current resistance zone + psychological level)
• Stop Loss: 41,200 (above key recent highs / invalidation of setup)
• Take Profit: 39,450 (near broken structure & moving average support on lower timeframes)
Risk-to-Reward Ratio (RRR):
• Risk: 350 points
• Reward: 1,400 points
• RRR: 4:1 (excellent)
⸻
Fundamental Context (Supporting the Short Bias):
• Dow is rebounding amid broader market uncertainty (e.g., Fed rate trajectory, inflation prints).
• No strong economic catalyst justifying a sustained breakout to new highs — suggests technical bounce rather than trend reversal.
• Rising yields or a hawkish Fed outlook could reintroduce selling pressure.
FUSIONMARKETS:US30

Updated XRP Count Bearish (Short Term)Hello Friends,
I've been trying to tackle this count for a couple of days now and finally came up with something that fits the picture and seems to work. I’m not in love with this count—it’s very tricky when it comes to the X wave. I’ve been reviewing and processing what the highest probability count could be for this part of the structure.
As we understand it, Wave 1 of the 5th wave (or Wave A of the Y wave) was completed around January 20th at approximately $3.40. From that point until now, we are likely in Wave 2 of the 5th wave (or Wave B of the Y wave), which appears to be nearly complete.
Wave 2 (or Wave B) is forming as a sharp double zigzag:
A zigzag in Wave W
A truncated, ugly-looking sharp double in the X wave (which I’m not a fan of, though I believe it’s valid and it fits)
And a zigzag in Wave Y, which we are currently still in
Probabilistically, we are in Wave B of the Y wave and should retrace to around $2.10–$2.40. As more subdivisions develop in the B wave, they’ll help confirm more precise target ranges in the coming days.
I expect we’ll finish in the $1.60–$1.36 range (leaning more toward the lower end around $1.43–$1.36) to complete this correction before continuing toward the $10 target area.
Thoughts?
Thank you,
GOD BLESS and TRADE ON!

$MES1! Could Drop to Oct 2022's Fib 0.618 Level @ 4,520Monthly (April 2025)
- #TheStrat: 2u-2d-2d continuation
- Price stopped at the monthly 0.50 fib (Oct 2022 - Feb 2025)
Weekly (Mon April 7 - Sat, April 12)
- 2u-2d-2d continuation
- 4072 - 4520 is the range of 0.786 and 0.618, respectively.
- 4834 is the 0.5 fibonacci, short term reversal
Daily (Wed, April 9)
- 2u-2u-2d reversal
- potential support is 0.5 fib @ 4834
- RSI at 20 (low) and MACD still red

Trade Idea : US30 Short ( SELL STOP )Technical Analysis Summary:
Daily Chart:
• Trend: Strong bearish breakdown; significant drop below support.
• MACD: Deeply negative, suggesting strong bearish momentum.
• RSI: Oversold at 18.48, indicating exhaustion but not yet reversal.
15-Minute Chart:
• Trend: Clear downtrend continuation.
• MACD: Bearish crossover sustained.
• RSI: Approaching oversold (29.81), but still trending down.
3-Minute Chart:
• Trend: Momentum is slowing down but still bearish.
• MACD: Negative, bearish crossover.
• RSI: Around 33, indicating potential short-term bounce, but no bullish divergence.
⸻
Fundamental Insight:
• The broader US30 index has reacted to strong macroeconomic headwinds (possibly higher-for-longer interest rates, weak earnings, or geopolitical tensions).
• No signs of dovish reversal or major catalyst for a sharp recovery.
⸻
Trade Idea: SHORT POSITION
Entry: 37070 (current price zone—ideal entry on slight retracement)
Stop Loss (SL): 37320 (above minor resistance and recent local high)
Take Profit (TP): 36350 (strong daily support area and psychological level)
Risk-Reward Ratio (RRR):
• Risk: ~270 points
• Reward: ~700 points
FUSIONMARKETS:US30

Trade Idea : US30 Short ( MARKET )Technical Analysis Overview:
1. Daily Chart:
• The index is in a clear downtrend, with price action breaking below the moving average.
• MACD is deeply negative, with a bearish divergence and downward momentum.
• RSI at 37.28, indicating approaching oversold territory, but not yet reversing.
2. 15-Minute Chart:
• Strong downward momentum with sharp drop visible.
• MACD is heavily negative, confirming bearish momentum.
• RSI is at 32.71, indicating oversold conditions, but no clear sign of reversal yet.
3. 3-Minute Chart:
• Sharp sell-off followed by consolidation.
• MACD is negative but appears to be flattening, suggesting potential for a short-term bounce or continued consolidation before the next move.
• RSI at 44.38, showing mild recovery from previous lows but still below the midpoint (50).
Trade Idea:
• Position: Short (Sell)
• Entry Level: 41,250 (near minor resistance or after a weak bullish retracement)
• Stop Loss (SL): 41,800 (Above recent consolidation zone or resistance)
• Take Profit (TP): 40,400 (Previous support area with good potential for price to test)
FUSIONMARKETS:US30

Trade Idea : US30 Short ( SELL LIMIT )Technical Analysis
1. Daily Chart:
• Trend: The price has been in an uptrend but is showing signs of exhaustion.
• MACD: Deep in negative territory (-311.308 & -377.356), confirming bearish momentum.
• RSI: 44.24, indicating weak momentum and room for further downside.
• Key Resistance: 42,890
• Key Support: 41,000
2. 15-Minute Chart:
• Trend: The price has broken below a consolidation zone.
• MACD: Bullish but fading, suggesting exhaustion of upward movement.
• RSI: 48.21, showing indecision but no strong bullish strength.
• Structure: Lower highs and lower lows forming, indicating a potential breakdown.
3. 3-Minute Chart:
• Price Action: Weak bounces and inability to sustain higher prices.
• MACD: Negative and declining, confirming short-term bearish momentum.
• RSI: 41.77, approaching oversold but not yet at extreme levels.
Fundamental Analysis
• Macro Risks:
• Potential market correction after extended bullish trends.
• Economic uncertainty and possible rate hike expectations could pressure equities.
• US Market Conditions:
• Upcoming data releases or Fed commentary could increase volatility and favor bearish moves.
Trade Execution
• Entry: 41,950
• Stop Loss (SL): 42,250 (300-point stop)
• Take Profit (TP): 41,350 (600-point target)
• Risk-to-Reward Ratio (RRR): 2:1 FUSIONMARKETS:US30

CADCHF SHORTSCADCHF is more so bearish than bullish. Price can still push up towards daily resistance if it breaks the H1 resistance. I'd wait for price to break this major support to have another confirmation for shorts.

AUDCHF BEARISHAUDCHF is in a H4 range. Overall price has been bearish so I'd lean more towards sells. I'd wait for price to break the range support before I continue selling to 0.55000.

BTCUSD BEARISHBTCUSD is currently bearish and look like it will continue dropping. the 72,000 area does seem like a feasible target.

UJ Sells. FX:USDJPY is overall bearish. Daily double top formed to close out last week. Looking for price to push towards daily support around 146.600 area. I'd wait for price to break below H4 support before entering sells.

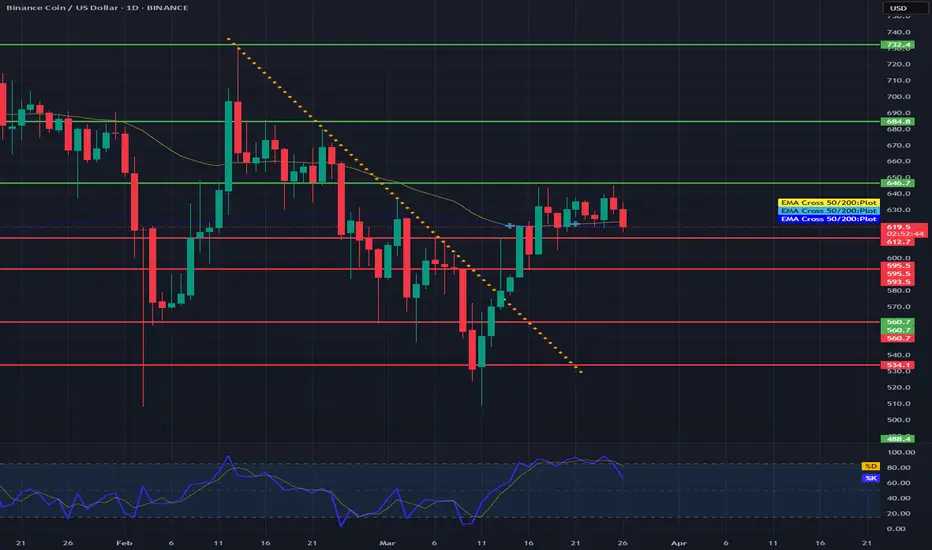
BNB before correction?Hello everyone, let's look at the 1D BNB to USD chart, in this situation we can see how the price came out of the downtrend line, however, here it is worth observing the EMA Cross 50 and 200 indicator, which shows a fight to maintain the uptrend. Please take into account the STOCH indicator, which shows a longer movement at the upper limit of the range, which may confirm the current rebound and give a deeper correction, however, here it is important for the price to stay above the level of the last low.
Let's start by defining the goals for the near future, which the price must face:
T1 = 646 USD
T2 = 684 USD
Т3 = 732 USD
Now let's move on to the stop-loss in case the market continues to fall:
SL1 = 612 USD
SL2 = 595 USD
SL3 = 560 USD
SL4 = 534 USD
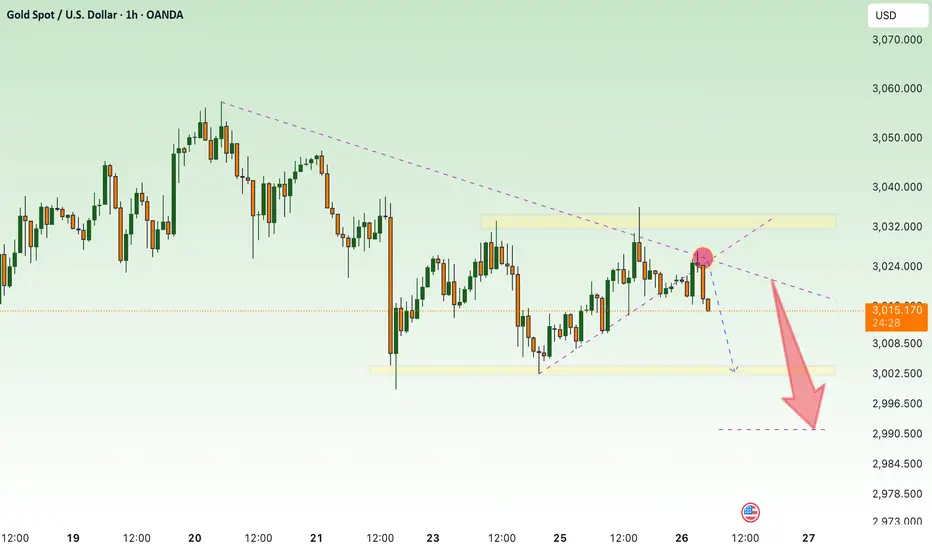
continue downtrend , GOLD⭐️GOLDEN INFORMATION:
Gold price (XAU/USD) holds steady above the key $3,000 level for the second consecutive day on Wednesday, though it struggles to reclaim the previous session’s peak. Ongoing uncertainty surrounding US President Donald Trump’s proposed reciprocal tariffs set for next week continues to bolster demand for the safe-haven metal. At the same time, the US Dollar (USD) remains under pressure following Tuesday’s weaker-than-expected macroeconomic data, providing additional support for gold’s upward momentum.
⭐️Personal comments NOVA:
Gold price continues to decrease, around 2990 - 3000
⭐️SET UP GOLD PRICE:
🔥SELL GOLD zone: $3039 - $3041 SL $3046
TP1: $3030
TP2: $3020
TP3: $3010
🔥BUY GOLD zone: $2992 - $2990 SL $2985
TP1: $3000
TP2: $3008
TP3: $3018
⭐️Technical analysis:
Based on technical indicators EMA 34, EMA89 and support resistance areas to set up a reasonable SELL order.
⭐️NOTE:
Note: Nova wishes traders to manage their capital well
- take the number of lots that match your capital
- Takeprofit equal to 4-6% of capital account
- Stoplose equal to 2-3% of capital account
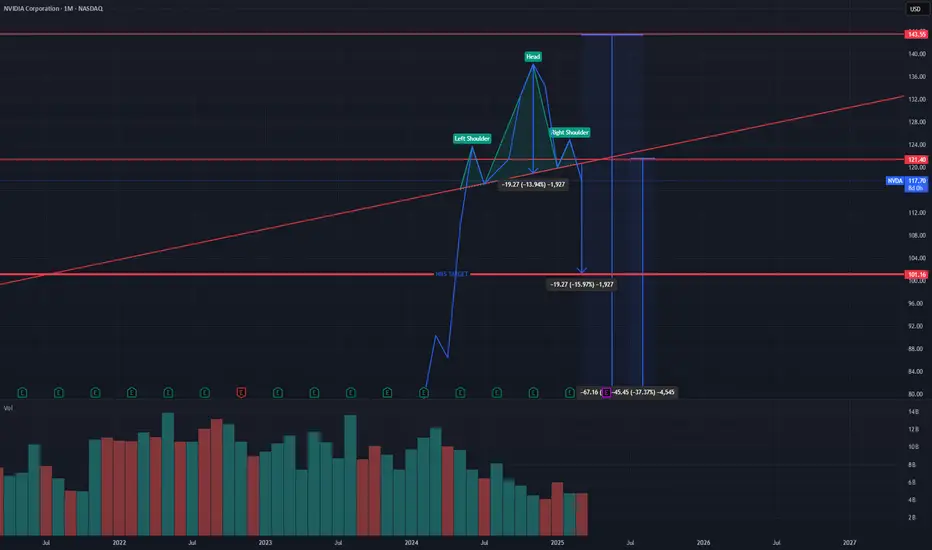
$NVDA H&S on Monthly...Linking previous short of NVDA. The right shoulder is technically not finished forming. However that trendline was tested not long ago.... will it hold? Who knows.
First target would be ~$100. If this plays out there will likely be a larger mark down phase consisting of retail panic selling. This will push toward $80 with a possible shakeout near the low/mid $70s before a long term accumulation process begins by big money.
Just because I am short on the stock does not mean I don't believe in the company or stock longer term. Have money on the sidelines to buy incase this plays out.
BITCOIN BASED ON WYCKOFF THEORY 73K PROGRAMMED FOR NEXT LEG DOWNBased on analysis from multiple perspectives, not just Wyckoff theory, the chart strongly suggests that this is merely a pullback before continuing downward.

BTC - ABC Correction to Absorb Long Liquidity Further to my previous recent post, I wanted to highlight two indicators that accurately present us with liquidity on the BTC chart.
Connecting the pieces of the puzzle of this prediction - this ABC correction pattern allows the market to absorb the Long position liquidity left in tact on the chart.
Since these long positions leave a trail of leveraged sell orders (stop losses) - we should expect a mass chain reaction of these orders setting off one into the next, with increasing speed and momentum of the drop.
We do not need a black swan event for this to occur. The orders are already in the chart to allow it to happen, as an adverse consequence to open interest and open traders positions during the last 2 years.
There is many confluences to support this correction pattern, if interested in learning more, see my previous posts on Trading View.
Enjoy!

Trade idea: US30 short ( SELL LIMIT )Technical Analysis:
1. Daily Chart:
• Trend: Bearish correction after a strong uptrend.
• MACD: Negative, showing increasing bearish momentum.
• RSI: 38.25, indicating oversold conditions but with room for further downside.
• Price Action: The price has broken below the short-term moving average, signaling further weakness.
2. 15-Min Chart:
• Trend: Downtrend with lower highs and lower lows.
• MACD: Bearish crossover, confirming downward momentum.
• RSI: 62.60, indicating price has rebounded but is not yet overbought.
• Resistance: Around 41786, which aligns with prior price rejection.
3. 3-Min Chart:
• Trend: Recent short-term uptrend, but likely a retracement in the larger bearish structure.
• RSI: 77.65 (overbought), indicating a potential short opportunity.
• MACD: Bullish but losing momentum.
⸻
Fundamental Analysis:
• Recent Market Sentiment: High volatility suggests caution. A larger correction is possible.
• Interest Rate & Economic Data: If the Fed remains hawkish, equities could see further declines.
• Geopolitical & Economic Risks: Uncertainty in global markets could weigh on the Dow.
⸻
Trade Setup:
• Position: Short (Sell) US30
• Entry: 41750 (near resistance on the 15-min chart)
• Stop Loss (SL): 41880 (above previous highs, tight risk control)
• Take Profit (TP): 41450 (key support level)
• Risk-Reward Ratio (RRR): 2:1
FUSIONMARKETS:US30

Trade Idea : US30 Sell ( MARKET)1. Technical Analysis
Daily Chart
• Trend: The index is in a broader downtrend, with a recent pullback from highs around 42890 to 42060.
• MACD: Deep in negative territory, suggesting bearish momentum.
• RSI: 43.01 — indicating it’s closer to oversold but still has room to fall further before a reversal.
15-Minute Chart
• Trend: Short-term uptrend, showing a rally from a dip around 40900 to 42060, but nearing resistance near 42145.
• MACD: Positive, but momentum appears to slow down.
• RSI: 61.29 — heading toward overbought territory, indicating a potential pullback.
3-Minute Chart
• Trend: Micro uptrend, but showing signs of consolidation after the recent strong push.
• MACD: Positive but flattening, suggesting momentum is fading.
• RSI: 60.10 — also near overbought.
⸻
2. Fundamental Analysis
• Market Sentiment: Recent rallies seem more like a technical rebound rather than a fundamentally-driven bullish push.
• Geopolitical/Economic Factors: If the broader market sentiment remains uncertain (e.g., interest rate worries, inflation data), the US30 could face further downward pressure.
• Dollar Strength: A strong USD typically weighs on US equities, which aligns with the bearish technical outlook.
⸻
3. Trade Setup: Short Position (Sell)
• Entry: 42080 (near current price, just under resistance)
• Stop Loss (SL): 42150 (just above the last 15-min resistance level)
• Take Profit (TP): 41700 (previous support on the 15-min chart) FUSIONMARKETS:US30

XRP Wave 2 or Wave B incoming Part 1Hello there,
I am presenting a bearish (short term; current post) count and a bullish count (in my next post). This is showing that we hit a truncated top (see previous posts; attached) and we are coming down in the $1.9 - $1.4 ish range to compete Wave 2 (or could be Wave B) of cycle. I see us pushing to the $2.9 - $3.2 ish range to finish the C wave of the Major wave B of the wave 2 before finishing. it seems to me that we are making a Flat in this sideways chop.
please review and ask me any questions
GOD BLESS AND TRADE ON
Stay Humble and Hungry

BTC FOMC FLASH CRASH / LIQUIDATION IDEAThe FOMC data this week could be a conduit that sticks the price to play down these two trend lines.
We can see the mass liquidity on the chart in these low zones.
Bitcoins consistent rise since late 2022 has been leaving a train of long stop loss orders (leveraged sell orders) underneath - think of the mechanics of “why it’s possible” as a massive chain reaction of stop losses getting fired off and creating mania and hysteria for further fear based selling.
If we see drops to these low zones, I’m presenting the TA evidence of it so that we know it’s not the bottom - but a liquidation move.
The worst thing people could do is sell at massive losses thinking BTC is going to zero.
I see this move occurring and following that over the next years, a BTC pushing upwards of those $140-$200k zones.
The market is interested in reclaiming this liquidity - we are awaiting the conduit or event to justify it.
This is my personal trading plan.
Happy trading to all and be safe out there.

AUDJPY SHORTSOverall price is in a downtrend. The daily tf has been in a tight range/consolidation. I'd definitely see how price reacts at the daily resistance before placing any sells.

wait and watch... if breakout below then go for short. It seems that USD MNX is on breakout. If it close below then go for short.

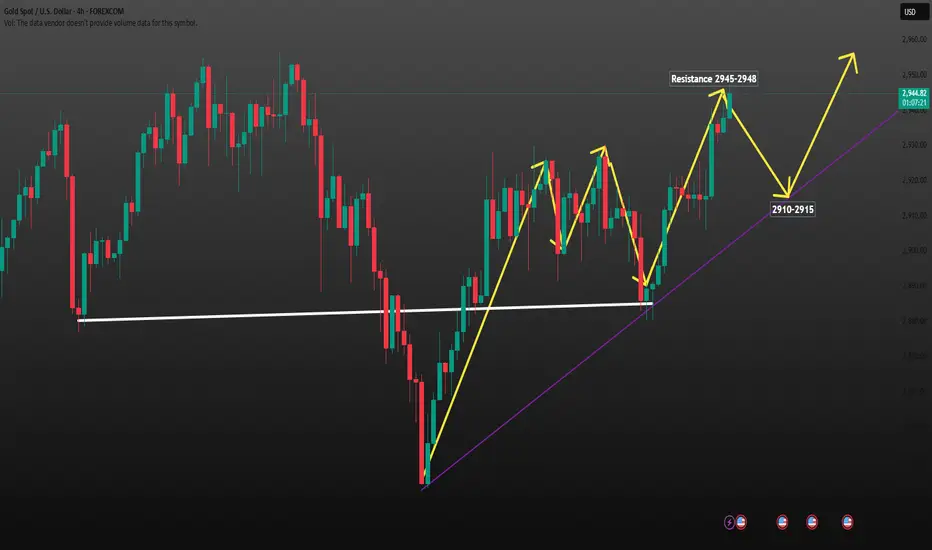
How to continue to short (2)As in my last analysis, currently XAUUSDXAUUSD is about to hit that 2945-2948
Operation policy reference:
Short Position Strategy
1:XAUUSD sell@2945-2948 20%Transaction of funds , tp:2930-2920-2910
2:XAUUSD Buy@2910-2915 20%Transaction of funds , tp:2930-2945-2955
The Signals have timeliness , if you also need to get accurate signals every day,follow the link below to get my daily strategy updates
If your account is still in the red, you need to pay attention to whether the resistance is valid. If the resistance is valid, there may be a decline. You can close your order on the decline and trade in the right direction again