USDNOK short potential setupUSDNOK recently broke down below the monthly 50ema (overlayed on this 4h chart) and has rejected off the daily 20ema (overlayed) twice this week. RSI is showing bearish momentum after a brief overbought period while the PA has remained in a strong downtrend. Short setup potential is evident but not certain.
I'm a cat not a financial advisor.
Shortsell

AUDJPY 240 MINS TIME FRAME - MY VIEWThe Structure looks good to us, waiting for this instrument to correct and then give us these opportunities as shown on this instrument (Price Chart).
Note: Its my view only and its for educational purpose only. Only who has got knowledge about this strategy, will understand what to be done on this setup. its purely based on my technical analysis only (strategies). we don't focus on the short term moves, we look for only for Bullish or Bearish Impulsive moves on the setups after a good price action is formed as per the strategy. we never get into corrective moves. because it will test our patience and also it will be a bullish or a bearish trap. and try trade the big moves.
We do not get into bullish or bearish traps. We anticipate and get into only big bullish or bearish moves (Impulsive Moves). Just ride the Bullish or Bearish Impulsive Move. Learn & Know the Complete Market Cycle.
Buy Low and Sell High Concept. Buy at Cheaper Price and Sell at Expensive Price.
Please keep your comments useful & respectful.
Keep it simple, keep it Unique.
Thanks for your support
Tradelikemee Academy
Saanjayy KG

GBPNZD- Bearish Wedge Pattern - SHORT SELL GBPNZD ; after series of HH and HL, now is the time for the market to take some reversal. market has formed divergence on 30 M time frame. we can see formation of Bearish Wedge patter which is a strong indication of up-trend getting weaker.
Once, market breaks the LH we can enter into the market. we have got projection on the charts (thanks to wedge pattern)
we have 4 TPs with a R:R of 1:1, 1:2 , 1:3 and 1:4 respectively.
SL is placed slightly above last LH.

EURNZD Bearish Reversal Confirmed: Break and Retest Below Key Su🧠 Market Context & Structure:
Trend Analysis: The pair is currently in a bearish structure. This is evident from lower highs and lower lows forming after a failed bullish breakout attempt.
Key Zone: A supply zone (highlighted in red) around 1.90198 – 1.90750 has acted as a strong resistance. Price was rejected here after retesting.
Break of Structure (BoS): A clear bearish breakout below the ascending trendline and the horizontal support confirms a shift in sentiment.
📉 Indicators & Confluences:
EMA Analysis:
EMA 50 (red): 1.90757
EMA 200 (blue): 1.90728
Price is trading below both EMAs, which confirms bearish momentum. Also, a bearish EMA crossover (50 crossing below 200) may be forming or has just occurred — a death cross, which further supports downside bias.
🎯 Trade Setup Breakdown (Bearish Bias):
Entry: Around 1.89760 (current price)
Stop Loss: Above the supply zone (~1.9020 - 1.9070)
Take Profit Target: Around 1.86035 (highlighted in green), aligning with previous demand zone or measured move.
Risk-to-Reward Ratio (RRR): Estimated at ~3:1, making this a favorable setup.
🔽 Technical Patterns:
Bear Flag / Rising Wedge: The broken ascending pattern suggests a bearish continuation.
Retest Confirmation: Price retested the broken structure before continuing down — classic bearish retest behavior.
✅ Conclusion:
This is a textbook bearish setup supported by:
A failed breakout and structure shift
Resistance at a key supply zone
Break and retest of support
Price under both EMAs (bearish confirmation)
📌 Bias: Bearish
📌 Invalidation Level: Close above 1.9075
📌 Next Support Zone: 1.8600–1.8550 range

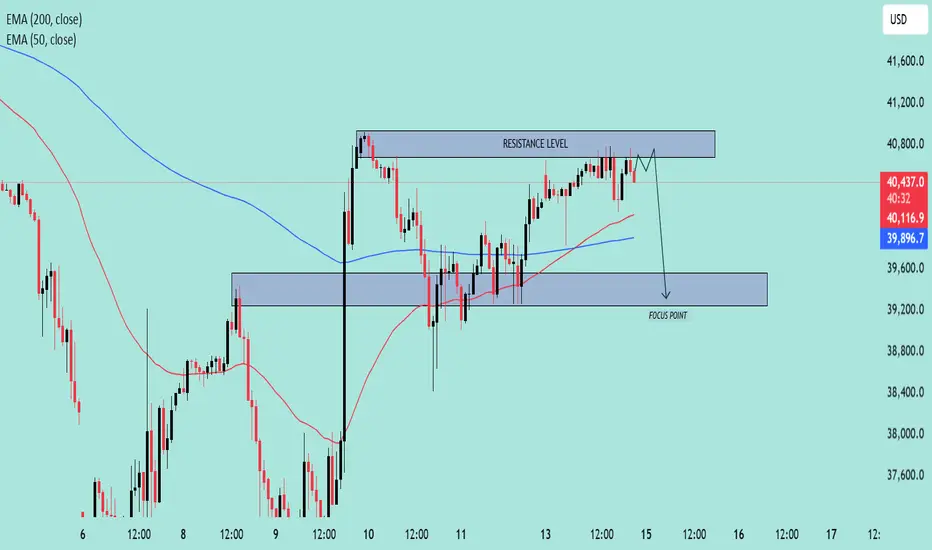
US30 Approaching Key Resistance–Potential Reversal Setup in Play🧠 Chart Overview
Asset: US30 (likely the Dow Jones Industrial Average)
Timeframe: Appears to be 1H or 2H
Indicators:
EMA 50 (Red): 40,119.5
EMA 200 (Blue): 39,897.3
Price at time of chart: Around 40,503
🔍 Key Technical Levels
🔴 Resistance Zone
Range: ~40,750 to 40,850
Price has tested this level multiple times and is currently hovering near it.
The resistance is holding, and no strong breakout has occurred.
🟦 Support / Focus Zone
Range: ~39,200 to 39,600
Marked as the “FOCUS POINT” – likely the expected target on a breakdown.
EMAs Insight:
Price is above both the 50 EMA and 200 EMA, suggesting short-term bullishness.
However, since it’s stalling at resistance, it could flip bearish on rejection.
🧭 Price Action Narrative
The chart suggests a potential fakeout above resistance, followed by a sharp rejection.
The path drawn shows a short-term dip, targeting the FOCUS POINT (support zone).
Rejection at resistance aligns with typical distribution behavior.
📌 Trade Idea (Bearish Bias)
Entry Idea: Short near or just above the resistance level (~40,800)
Target: 39,400 zone
Stop-Loss: Above the resistance level (~40,900+)
Risk/Reward: Favorable if price fails to break above resistance convincingly
📉 Bias: Bearish Reversal
Unless price breaks and closes above resistance with strong momentum, the chart favors a pullback scenario.
EUR/USD Bearish Setup Unfolding Below Key Resistance📊 Technical Analysis of EUR/USD (4H Chart)
🧭 Chart Overview:
Current Price: ~1.1350
Indicators Used:
EMA 50 (Red): ~1.1311 — acting as dynamic support.
EMA 200 (Blue): ~1.1114 — aligns closely with major support zone.
📌 Key Levels:
🔼 Main Resistance Zone: 1.1375 – 1.1400
Price has tested this zone multiple times, forming a potential double top pattern.
Strong bearish pressure observed each time price enters this area.
🔁 Minor Resistance (Retest Zone): ~1.1325 – 1.1345
Currently acting as a decision zone.
If price fails to hold above this level, it could turn into resistance on the next bearish leg.
🔽 Support Zone: 1.1100 – 1.1130
Converges with EMA 200 — making it a high-probability demand zone.
Potential target for the anticipated drop.
🧠 Price Action & Structure:
Market showed a strong bullish rally previously, breaking through resistance levels.
Now showing signs of exhaustion at the top.
Bearish scenario projected with a lower high forming below the main resistance, followed by a sell-off toward the support zone.
⚙️ Possible Scenarios:
Bearish Scenario (High Probability):
Price rejects the minor resistance → breaks below EMA 50 → continues lower to support.
Target: 1.1110 area.
Bullish Scenario (Low Probability):
Price reclaims and closes above 1.1375 with strong momentum.
Potential breakout and continuation toward 1.1450+.
🧩 Confluences Supporting Bearish Bias:
Lower high formation potential.
EMA 50 starting to flatten.
Failure to maintain momentum above main resistance.
Clean drop path toward 1.1110 if support breaks.
📉 Conclusion:
This setup favors short-term bearish movement, particularly if the price rejects around the 1.1345 level again. A breakdown below the minor resistance zone would likely trigger a sell-off toward the 1.1110 support, in line with the 200 EMA.

CAD/JPY Bearish Setup Near Resistance – Rejection Incoming?📉 Trend Analysis:
The pair is in a downtrend, confirmed by the descending trendline.
Lower highs and lower lows indicate bearish momentum.
📌 Key Levels:
Resistance Zone (104.5 - 106.0): Marked in purple, this area has previously acted as support and is now a key resistance zone.
Support Area: Around 100.0 - 101.0, a psychological level where price may find demand.
📊 Trade Scenario:
Bearish Rejection Expected: Price is approaching the resistance zone and trendline confluence. If rejection occurs, a downward move towards 100.0 is likely.
Break Above? If price breaks above the resistance zone and trendline, bullish momentum could invalidate the bearish setup.
🔍 Conclusion:
Watching for rejection near 105.0-106.0 to confirm a short opportunity.
If rejection happens, next targets are 102.0 → 100.0.
A bullish breakout above 106.0 could shift momentum upwards.

EUR/USD 4H Analysis – Bearish Reversal Toward Key Demand Zone📊 EUR/USD 4H Analysis – Bearish Reversal Setup
🔸 Market Structure:
The chart indicates a Change of Character (CHOCH) at the recent high, signaling a possible shift in trend from bullish to bearish. The buy stop liquidity appears to have been grabbed before the price reversed, suggesting smart money may be positioning for a sell-off.
🔸 Key Levels:
Resistance Zone: Near 1.0900, where liquidity was swept.
Support Zone: Marked in purple between 1.0450 - 1.0500, acting as a potential demand area.
🔸 Price Action Expectation:
A minor pullback or retest of the CHOCH zone before further downside.
A bearish continuation towards the 1.0500 demand zone, aligning with liquidity objectives.
🔸 Trading Plan:
Bearish Bias: Potential short opportunities if price confirms lower highs.
Invalidation: A sustained break above 1.0900 would negate the bearish thesis.
Target: 1.0500 zone for potential long-term buy interest.
📉 Conclusion: If the price respects the CHOCH level and fails to reclaim liquidity above, sellers could dominate, driving EUR/USD lower toward the 1.0500 liquidity pool.

XAUUSD Analysis: Bearish Reversal with Potential for Liquidity📉 XAUUSD (Gold Spot vs USD) Analysis - 3H Chart
🌟 Shooting Star Pattern Detected: The market has formed a shooting star, a bearish reversal candlestick, signaling potential weakness at the top.
📍 Key Resistance Zone (Purple Box): Price action has been rejected from this area, showing strong selling pressure.
🔍 If Break Scenario: Should the price break below the 2,949 support zone (🔵), we can expect a bearish drop 📉 with potential liquidity grab before a pullback for a new all-time high (ATH) 🚀.
🧐 Market Sentiment: Bearish bias for now, but watch for a potential reversal after liquidity is swept.
✅ Trader's Tip: Wait for a clean break and retest before entering a short position. 🎯

Bitcoin (BTCUSD) Rejection – Bearish Move Incoming?📉 Key Observations:
Resistance Zone (Purple Box): Price has tested this area and faced rejection.
Bearish Projection (Gray Box & Arrow): The chart anticipates a drop towards the $76,800 - $77,000 range.
Liquidity Grab? Price might consolidate before a sharp decline.
⚠️ Possible Scenarios:
Rejection Confirmation 🔻: If BTC fails to reclaim $84,470, selling pressure could increase.
Breakout Fakeout? 🤔: A deviation above resistance followed by a dump remains a risk.
🎯 Levels to Watch:
Resistance: $84,470 - $85,078
Support: $80,000 and $76,825
🔥 Final Take: If BTC struggles below resistance, a short setup could play out. Confirmation is key!

XAG/USD Bearish Reversal Incoming? | Silver 4H Analysis📉 XAG/USD (Silver) 4H Chart Analysis – Bearish Setup 🚨
🔍 Key Observations:
Supply Zone (POI - Point of Interest) 🟪: The price is approaching a strong resistance area around $33.23 - $33.50.
Liquidity Grab (LQ) & Rejection Expected ❌: The previous major liquidity zone (LQ) suggests a possible fake breakout or rejection.
Bearish Projection ⬇️: The chart outlines a potential reversal after reaching resistance, leading to a drop towards $31.00 - $30.50.
📌 Trading Plan:
Short Entry 🎯: Around $33.20 - $33.50 (if price rejects this area).
Target 🎯: Major demand zone at $31.00.
Stop Loss 🚨: Above $33.60 (to avoid fakeouts).
Confirmation Needed 📊: Look for bearish candlestick patterns (e.g., engulfing, wicks, or double top formations).
⚠️ Final Thoughts:
Bearish Bias ⚠️ unless price breaks and holds above $33.50.
Monitor market conditions 🧐—news and fundamentals could shift momentum.
🔥 Trade smart! What do you think?

Gold (XAU/USD) – Bearish Momentum Towards Key SupportGold (XAU/USD) Technical Analysis – 1H Chart 🏆📉
🔹 Overview:
The chart shows Gold (XAU/USD) in a downtrend after failing to break above resistance.
Key zones are marked: Resistance (~$2,920 - $2,960) and Support (~$2,840 - $2,860).
A potential bearish move is suggested towards the support area.
📌 Resistance Zone (~$2,920 - $2,960) 🚧
Price has struggled to break this level multiple times, leading to rejection.
Sellers are likely in control, pushing the price lower.
📌 Support Zone (~$2,840 - $2,860) 🛡️
This area has historically acted as a strong demand zone.
Possible price reaction here, with a bounce back up if buyers step in.
📉 Bearish Scenario:
A retest of minor resistance (~$2,900) before continuing downward.
If price reaches support, a reversal or further breakdown could occur.
📈 Bullish Recovery?
Only a strong breakout above $2,920 would shift momentum to bullish.
🔥 Conclusion:
Short-term bias: Bearish 📉
Key watch: Price action at support (~$2,840) for possible bounce 📊

BTC/USD Breakdown! Bearish Target: $78K🔍 BTC/USD 30-Minute Chart Analysis
📉 Market Structure:
The chart displays an ABCDE corrective pattern, likely a descending wedge or contracting triangle, which has now broken to the downside.
Price action shows a breakout below the wedge, leading to further bearish momentum.
The 200-period moving average (red line) is acting as resistance, reinforcing the downward trend.
📊 Current Price: ~$83,057
🔻 Bearish Target: $78,049 (marked as the potential support level)
🛑 Key Observations:
Rejection from wave E indicates a lack of bullish strength.
Lower highs and lower lows confirm a continuation of the bearish trend.
Potential retest of ~$85,000 before dropping further.
🚀 Trading Insights:
Bearish Bias: Short opportunities on pullbacks toward resistance.
Bullish Reversal? Look for price action near $78,049—if buyers step in, a potential bounce could occur.
⚠️ Watch out for:
Sudden Bitcoin volatility (news-driven moves).
A fake breakdown (if buyers reclaim above ~$85,000).

XAU/USD Weekly Outlook: Potential Pullback or Breakout?XAU/USD Weekly Chart Analysis 🏆📉📈
1️⃣ Current Price: $2,919.35
2️⃣ Key Observations:
Distribution on H4: Potential sign of a short-term reversal. 📉
Divergence: Suggests weakening momentum at the highs, increasing the probability of a pullback. ⚠️
Multiple Unfilled Mitigation Blocks (MB): Areas of interest where price may retrace for liquidity grabs. 🧐
Fair Volume Ranges: Notable levels around $2,700 - $2,500, where price might stabilize if a correction occurs. 🔄 3️⃣ Potential Scenarios:
If price breaks down from the H4 distribution, expect a retracement toward the nearest MB unfilled levels (~$2,700).
If bulls hold momentum, breaking above current resistance (~$3,000) could push prices into price discovery. 🚀
💡 Conclusion: Watch for price action around the unfilled MBs and fair volume ranges. A correction seems likely unless buyers step in aggressively.
🔥 Trade Wisely & Manage Risk! 🔥

USDCAD Bearish Breakdown: Retest & Drop Incoming? USDCAD Daily Chart Analysis 📉🔥
1️⃣ Trend Breakdown:
The pair was in an uptrend but has now broken below the ascending trendline, signaling a potential bearish shift.
2️⃣ Resistance Zone (Supply Area) 🟦:
The 1.4350 - 1.4450 region acted as resistance, rejecting price strongly.
Multiple rejections in this area indicate strong selling pressure.
3️⃣ Bearish Confirmation 📉:
Price is now trading below the broken trendline.
The recent daily candle closed bearish, confirming sellers are in control.
4️⃣ Key Support Areas 🔍:
1.3957 (200 EMA) → A crucial dynamic support level.
1.3916 → Previous key level that may act as strong demand.
5️⃣ Projected Move ⬇️:
Price may retest the broken trendline (pullback).
If rejection occurs, further drop towards 1.3950 - 1.3910 is likely.
📌 Final Thought:
A bearish move is in play! Watch for a pullback to retest the broken structure before considering further shorts. If price breaks below 1.3950, expect further declines.
💭 What’s your bias? Bulls 🐂 or Bears 🐻?

adjustment - accumulate more waiting for interest rate cuts⭐️Smart investment, Strong finance
⭐️GOLDEN INFORMATION:
Gold price (XAU/USD) finds support during the Asian session on Friday, recovering some of the previous day's pullback from a five-week high near $2,726. Safe-haven demand remains strong, driven by ongoing geopolitical tensions from the Russia-Ukraine conflict and unrest in the Middle East, as well as concerns about President-elect Donald Trump's proposed tariffs. Additionally, growing expectations that the Federal Reserve (Fed) will implement a third consecutive rate cut at next week’s December policy meeting provide further support for the non-yielding yellow metal.
⭐️Personal comments NOVA:
The price recovered positively during the week around 2700, sideways and accumulated further. Waiting for information about interest rate cuts in December 2024
⭐️SET UP GOLD PRICE:
🔥SELL GOLD zone: $2701 - $2703 SL $2706 scalping
TP1: $2695
TP2: $2690
TP3: $2680
🔥SELL GOLD zone: $2721 - $2723 SL $2728
TP1: $2710
TP2: $2700
TP3: $2690
🔥BUY GOLD zone: $2656 - $2654 SL $2649
TP1: $2665
TP2: $2678
TP3: $2690
⭐️Technical analysis:
Based on technical indicators EMA 34, EMA89 and support resistance areas to set up a reasonable SELL order.
⭐️NOTE:
Note: Nova wishes traders to manage their capital well
- take the number of lots that match your capital
- Takeprofit equal to 4-6% of capital account
- Stoplose equal to 2-3% of capital account


XAU/USD ! 11/8 ! downtrend line / scalping XAU / USD trend forecast November 8, 2024! SCALPING
Gold price (XAU/USD) stays below $2,700 as the European session approaches on Friday, weighed down by a slightly stronger US Dollar (USD) amid optimism that Trump’s policies may boost economic growth and inflation. Additionally, a generally positive risk sentiment is reducing demand for the safe-haven metal, pausing its recent recovery from the 50-day Simple Moving Average (SMA) support, after hitting a three-week low on Thursday.
Still following the downtrend - waiting for trendline and retest 2689, scalping down today
/// SELL XAU : zone 2689-2692 scalping
SL: 2695
TP: 40 - 80 - 150 pips (2677)
Safe and profitable trading

BTC: Shorting is risky but a good showdown to watch.Bitcoin is in Bullish Season once again. I would love to see the Retracement in action after the pump since yesterday.

$IONQ : 5 REASONS TO BE CAUTIOS! BUYERS BEWARE! NYSE:IONQ 5 REASONS TO BE CAUTIOS! BUYERS BEWARE!
5 REASONS WHY:
1⃣ We have a flag pole pattern. The last flag pole pattern in 2023 had the same 937 bar run before it pulled back.
2⃣ Had a Multi-year Symmetrical breakout but needed to retest the breakout area.
3⃣ RSI is running into resistance
4⃣ Stochastic (Trend) is at all-time highs
5⃣ William R is hitting resistance where the stock has bounced off 4 other times.
I like the name and want to HOP on this move higher, but I'm not going to jump on a flag pole without a parachute. I'm targeting PULLBACK and an entry price of $13-$14.
Stay tuned for more!🔔
Like ❤️ Follow 🤳 Share 🔂
Will the Flag Pole get bigger, or do you agree we are due for a pullback?
What other stocks do you want to see an analysis of?
Not financial advice.

Etsy's Bearish Momentum Signals Further Downside RiskNASDAQ:ETSY shares tumbled 5% to $47.11 following a downgrade from Goldman Sachs to "Sell" with a price target cut to $45 from $70. The technical outlook is weak across both daily and 4-hour timeframes, signaling further downside risk.
Daily Technical Overview:
Oscillators: Indicators like the Stochastic %K (6.31) and Momentum (−5.92) suggest a brief potential for a small rebound, but most oscillators, including the RSI (35.75), remain in neutral territory.
Moving Averages: Both the exponential and simple moving averages across all timeframes (10-day to 200-day) signal "Sell," confirming bearish momentum.
MACD: The MACD level (-1.32) is in the "Sell" zone, indicating weakening momentum.
4-Hour Technical Overview:
Oscillators: While some short-term oscillators like the Commodity Channel Index (−121.12) and Momentum (−1.58) suggest minor buying pressure, the overall trend is still neutral to bearish.
Moving Averages: All key moving averages on the 4-hour chart indicate "Sell," confirming sustained downward pressure in the short term.
Outlook: With both daily and short-term technicals pointing to continued weakness and Goldman Sachs lowering its price target, the risk of further decline is high. The stock is trading below critical support levels, with little to suggest a reversal is imminent.
Disclaimer: This content is for informational purposes only and should not be considered financial advice. Always conduct your own research and consult with a licensed financial advisor before making any investment decisions. Trading in financial markets involves risk, and past performance is not indicative of future results.


