Knight-Swift $KNX Getting Ahead Of Itself on Freight-Hype. SellKnight-Swift, $KNX, the largest trucking company in the US, rallied yesterday after the earnings release of competitor J. B. Hunt $JBHT. J. B. Hunt's earnings yesterday were mostly inline, but these better-than-feared numbers eased the idea of a major transport downturn. Here's the daily chart for J. B. Hunt $JBHT.
So today, the day after that nice rally, Knight-Swift cuts its outlook pretty drastically. The cut both EPS for Q2 and Q3 down 10% of what was expected. They cite "oversupply of capacity" in the freight market which "resulted in greater than expected downward pressure on revenue per loaded mile", which is a lot of words to say that competition is eating their lunch.
In response, the stock gapped down today, but only closed down 2%. I think it's reasonable to speculate that the buyers, which were bullish on $KNX because of $JBHT's positive earnings, will now have to sell, and send the stock price back to the bottom of the range.
A sensible thesis is that if the stock can crack $34 to the downside, we may see $27-$30 in the next days after.
You can read the full article here: www.behindthebid.com
Shortsell

Soliton $SOLY Will Likely Trail Down Until Next CatalystSoliton reported highly anticipated results from its study on cellulite reduction on Monday, July 15th. In anticipation, the stock ran from $12 to $20, but on the day of, the stock closed down 15%.
Soliton is a small cap medical device company that has an acoustic shockwave technology for tattoo removal called Rapid Acoustic Pulse (RAP). The treatment works pretty well, needing only 2-3 visits to remove tattoos vs the standard of care (lasers) which take about 10 doctor visits. They have also put a lot of press out about the potential of using their device for cellulite.
It's worth nothing that this was their second cellulite trial. The company presented their first trial results using RAP to treat cellulite on May 11 at the National Aesthetics Conference. They also went on Yahoo Finance Video to talk about the results. The trial "succeeded" said management, however, the stock responded less than enthusiastically.
The Full Article Is At BehindTheBid.com (CLICK HERE)

Five9 Sales Execs Leaving in Droves, Will Miss Next Earnings?Yesterday the stock fell because the company's EVP of Global Sales left the company. This follows 5-6 (yes 5 to 6!) other senior enterprise sales executives and that have left in the last six months.
No company loses this many sales executives and hits their numbers. I anticipate that Five9 is going to miss next earnings pretty badly. Next earnings are on July 31st (in 14 days)

Galapagos Has Peaked, Nowhere To Go But DownGalapagos announced today a large investment and a 10-year deal with Gilead $GILD. The stock gapped due to Gilead buying 10% of Galapagos at $158/share. However, when stocks gap up on investments at a premium price, they almost always fall (see $MGI, $ARWR)
An analyst at Raymond James agrees, saying he believes $GLPG stock has now fully realized his price target by achieving his core investment thesis.
As terms of the deal, $GILD has promised not to increase their stake in Galapagos for another 10 years, so a buyout is off the table

$NUS Short Idea after USNA reports terrible growth in China$NUS short idea after similar company $USNA reported earnings last week and gapped down 20%. USNA reported a slowdown in growth in China due to Chinese distaste for Multi-Level-Marketing. NUS will have the same problems when it reports, as it has promised growth in China

Sell Broadcom on this Symantec Acquisition, $20B Down The TubesBloomberg broke the news on Wednesday July 3rd, 2019 that Broadcom is in talks to buy struggling Symantec. This is a terrible idea on many fronts and $AVGO closed down 3% on the news. I believe that investors do not want this semiconductor company to waste $20 billion on a cybersecurity company (and why pick the one that seems to be struggling the most?). Certainly makes sense that we head lower over the next few days/weeks.
A few references:
AbbVie buying Allergan - stock closed down 15%
Salesforce buying Tableau - stock closed down 3% (but it hasn't dropped further)

This week we might close with equal BUYERS and SELLERS.After all the positive weeks from Mar & April we now came to a week where we are equal buyers and sellers.
Keeping it simple, not using technical terms much, I want to say that, this week we closed the candle with equal red and green.
So when this happens the following week will either spike up or spike down.
What do you think, comment below.
Now looking at the trend we are still making green candles and RSI shows that this week we may fluctuate between support level and resistance level.
But i believe it will not come down 7400 level.
What I would do now is, open the chart and try to look at MACD strategy for buy signals and wait for sell signal.
I am still bullish as i see all green candle weeks.
Make a strategy today for short trade between support level and resistance level for this week and coming weeks.
Thank you.

GbpJpy Tanking Short that !Im looking and seeing strong trend continuation should be looking for selling opportunities

Short GBPAUD Daily Resistance + RSI OverboughtGBPAUD reached a resistance level that price rejected at in March plus the RSI is indicating an overbought signal. This is a perfect short setup to catch some big pips! There is also the possibility of a double top formation but more time is required for confirmation.
Trade Details :
SL : 1.8900
TP 1 : 1.8750
TP 2 : 1.8600


EURAUD SHORT THIS AT THE RETEST!Hey All,
Try take the short at the retest of the trend line to increase the risk to reward pay off. This will break the bottom!!!

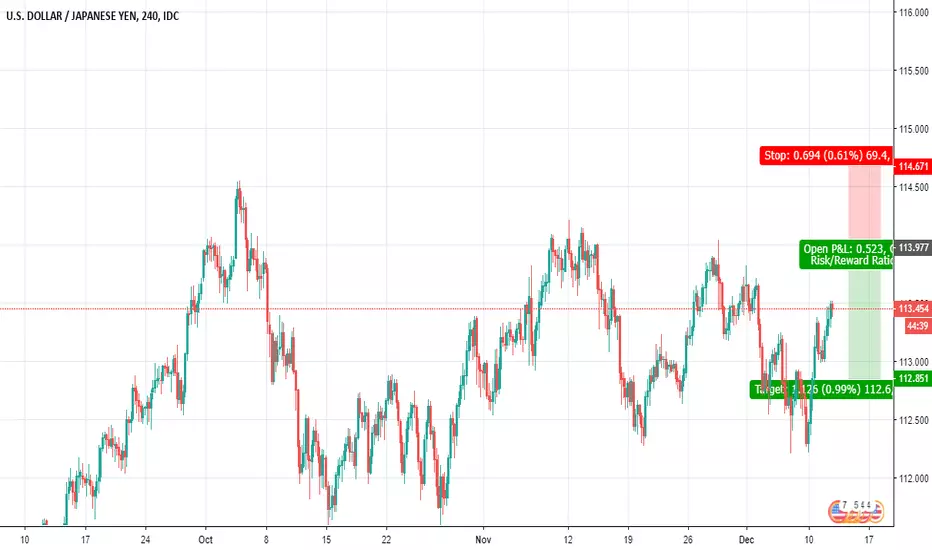
SHORT SELLI've been shorting this one on the pull backs. On the 4H, daily and Weekly it's still looking bearish. My ultimate goal is to short until .66212, but we will see how it plays out over the coming weeks.

NSE:AXISBANK Sell For 20 Nov 2018AXISBANK sell initiate for 20 Nov 2018 using 1 hour chart based on Fibonacci levels,
check below Sell level :
Sell Below : 609.1
Stop Loss : 617.2
Target : 604.45

NSE:DHFL Sell For 20 Nov 2018NSE:DHFL sell initiate for 20 Nov 2018 using 1 hour chart based on Fibonacci levels,
check below Sell level :
Sell Below : 226.55
Stop Loss : 235.1
Target : 220.55

NSE:ICICIBANK Sell For 20 Nov 2018NSE:ICICIBANK sell initiate for 20 Nov 2018 using 1 hour chart based on Fibonacci levels,
check below Sell level :
Sell Below : 361.1
Stop Loss : 364.15
Target : 359.15

NSE:JETAIRWAYS Sell For 20 Nov 2018NSE:JETAIRWAYS sell initiate for 20 Nov 2018 using 1 hour chart based on Fibonacci levels,
check below Sell level :
Sell Below : 316.05
Stop Loss : 322.95
Target : 304.25

NSE:NCC Sell For 19 Nov 2018NSE:NCC sell initiate for 19 Nov 2018 using 1 hour chart based on Fibonacci levels,
check below Sell level :
Sell Below : 87
Stop Loss : 89.45
Target : 85.55

NSE:BPCL Sell For 16 Nov 2018NSE:BPCL sell initiate for 16 Nov 2018 using 1 hour chart based on Fibonacci levels,
check below Sell level :
Sell Below : 302.15
Stop Loss : 311.65
Target : 293.9

NSE:TATASTEEL Sell For 16 Nov 2018NSE:TATASTEEL sell initiate for 16 Nov 2018 using 1 hour chart based on Fibonacci levels,
check below Sell level :
Sell Below : 578.15
Stop Loss : 589.6
Target : 571.7

NSE:AUROPHARMA Sell For 14 Nov 2018AUROPHARMA sell initiate for 14 Nov 2018 using 1 hour chart based on Fibonacci levels,
check below Sell level :
Sell Below : 771.15
Stop Loss : 782.2
Target : 759.05

NSE:INFRATEL Sell For 13 Nov 2018 NSE:INFRATEL sell initiate for 13 Nov 2018 using 1 hour chart based on Fibonacci levels,
check below Sell level :
Sell Below : 256.7
Stop Loss : 261.1
Target : 253.1

$ETC One of the Lowest Volatility in 2018 Agains BTC MarketIf you are an intra-day trader or shorter time frame than mid-term (around 1-3 months), ETC is not yours to trade. ETC proved itself as the lowest volatility in price against BTC. Which in average give return 25-40% between the top and bottom through 2018.
ETC is a fork of Ethereum which promising about more stability bla-bla in blockchain network. It's glory day was March 2017 and totally ended in November the same year.
Right now if you're looking to hedge your Bitcoin, ETC probably your second option except Bitcoin itself.
For short-term time frame, looking for RSI level to get downward and touching my surface of latest-support-level green box. I really can't count on MACD as it shows a really flat movement right now.
But my Ichimoku cloud indicator looks bearish AF.
