GBPUSDWill we get a retracement lower next week? The price will consolidate depending on the market and news, and potentially go lower from Tuesday or Wednesday. What I won't do is call the highs; I will wait for the price to break structure on a lower timeframe and make an execution from here.
Shortsetup

Bitcoin CME Closing Price: The Key to Next Week’s TrendIn this video I cover the CME closing price and go through a plan which includes a gap to the upside and a short squeeze before gravitating to the downside for lower targets .
I also give a bias for higher prices if the VAH is claimed .
This idea is modelled on the daily time frame and can play out over the course of the following week or more .
I also look at the Eth/Btc pair and the Btc dominance chart and marry whats happening on those charts with this idea .
When looking at BTC I use order flow software to further support my bias and the confluences I present in the chart.
If you have any questions then leave them below .
Support my work with a boost and Safe trading


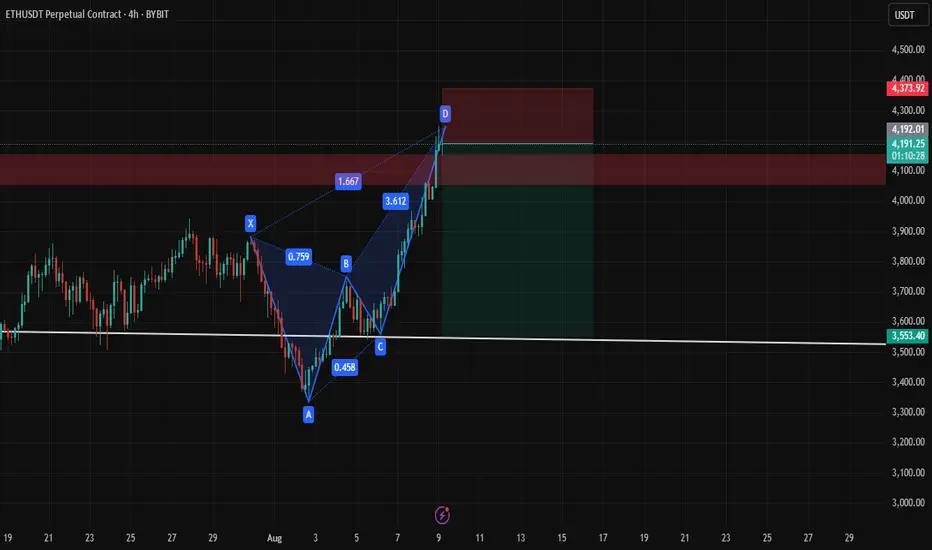
Eth Short Bearish Butterfly The Bearish Butterfly setup with price levels:
📍 Entry
Around point D, which looks close to $4,186–$4,190.
🛑 Stop Loss (SL)
Safest SL: Above 1.27 XA extension (slightly beyond D) → around $4,230–$4,240.
Conservative SL: Just above 1.618 XA extension (~$4,255).
🎯 Take Profits (TP)
We use Fibonacci retracements from the AD leg for targets:
TP1: 38.2% retracement of AD → ~$3,960
TP2: 61.8% retracement of AD → ~$3,800
TP3: Full retrace to point B area (~$3,700)
ethusdETHUSD HEAD AND SHOULDER
Sell Trade 30 minutes 15 minutes
After extreeme bullish momentume a retrace can seen in ETH chart
H&S can be seen trade it when price brakes the neck line retest and go down before a new upside run!

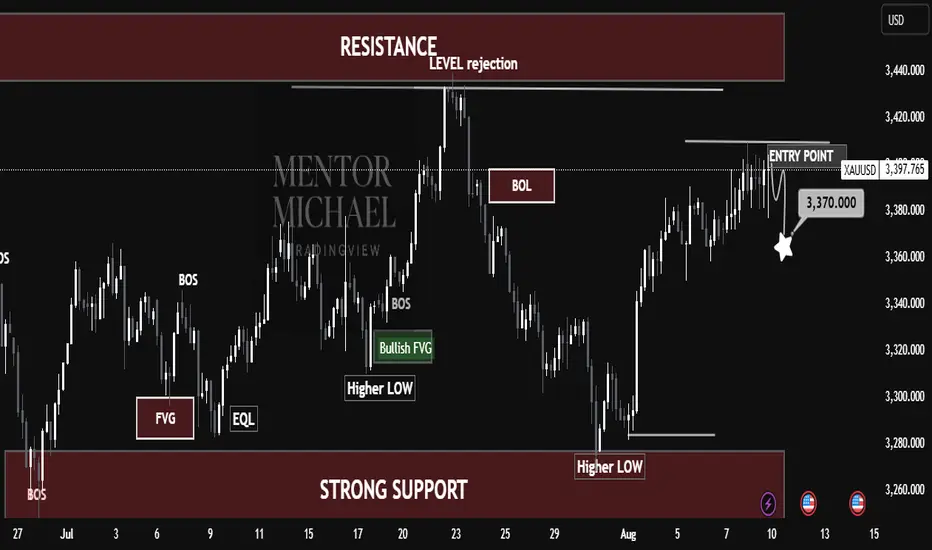
Gold on the Verge of a Big Move – Key Level in Focus!Gold on the Verge of a Big Move – Key Level in Focus!
Market Structure:
BOS (Break of Structure) signals have confirmed bullish momentum in prior swings.
Price created a Bullish FVG (Fair Value Gap) around mid-July, which provided demand for the next upward leg.
Consecutive Higher Lows indicate that buyers remain in control.
Key Levels:
Strong Support: $3,260 – A major demand area where buyers have stepped in multiple times.
Resistance Zone: $3,420–$3,440 – This is a significant supply area where price faced rejection earlier.
BOL (Breakout Level) around $3,390 – Price recently tested and is attempting to break above.
Trade Setup Highlighted:
Entry Point: $3,397 (short bias suggested by chart structure at resistance)
Potential Target: $3,370 – aligns with minor liquidity grab and possible retest of broken structure.
Market Logic:
Price is currently testing a resistance level rejection zone.
The expectation in this setup is a short-term pullback to collect liquidity before a possible continuation.
If $3,370 holds, bulls may resume toward the higher resistance zone at $3,420+.
Educational Takeaway:
BOS indicates a shift in control (bearish BOS = sellers taking over; bullish BOS = buyers taking over).
FVG is a gap in price that often acts as a magnet for retracement.
Higher Lows are key signs of a bullish trend.
Support & Resistance act as decision zones where traders can anticipate reversals or breakouts.
📌 Summary:
XAUUSD is in a bullish structure but is currently testing a resistance rejection zone. A short-term retracement to $3,370 is probable before any continuation higher. Swing traders should watch price behavior at support for a potential long continuation setup.
CORZ Earnings Alert — Bearish Setup Ahead of BMO Report****⚠️ CORZ Earnings Alert — Bearish Setup Ahead of BMO Report**
Core Scientific (CORZ) faces heavy fundamental headwinds with declining revenue (-55.6%) and negative margins, despite some bullish options flow and technical support near \$14.
**📉 Market Sentiment:**
* Moderate bearish conviction (75%)
* Mixed signals: cautious optimism from options flow vs. weak fundamentals
* Watch M\&A uncertainty and regulatory risks
**🛠 Trade Setup:**
* **Instrument:** CORZ
* **Direction:** PUT (SHORT)
* **Strike:** \$14
* **Entry Price:** \$0.16
* **Profit Target:** \$0.48 (200-300% gain)
* **Stop Loss:** \$0.08
* **Expiry:** 2025-08-08
* **Size:** 1 contract
* **Entry Timing:** Pre-earnings close
**🔑 Key Levels:**
* Support near \$14
* Resistance at \$15
* Expected Move: -\$2.50
**⚠ Risk Management:**
* Cut losses at 50% premium decline (\$0.08)
* Exit by market open next day if no target hit
---
**#CORZ #CoreScientific #EarningsTrade #PutOptions #BearishSetup #OptionsTrading #CryptoStocks #MAndA #RiskManagement #TechnicalAnalysis #TradingView #StockMarket #Volatility #ShortSetup**

NFLX CRACK!!Classic breakdown move from a rising F flag!
Massive Head and shoulders formed, that head test followed through, taking out stops, and now failing off the top of the channel.
Screaming CAUTION to the bulls!
Nice simple short setup for bears.
Click boost, follow, and subscribe. Let's get to 5,000 followers. ))

CHFJPY CHFJPY Retracement trade Sell Plan 30 Min Time frame
Making LLs and LHs confirming downtrend
But one still need tomanage risk!
Trade plan In chart
our one trade is already running of Sell for CHFJPY

CHFJPYCHFJPY Sell Plan
SL Entry Tp Partial booking metioned in charts lets print $$$
Key Fundamental Points:
Export Shock Hits Japanese Corporates
FX Pressure Could Weaken the Yen Further — or Bolster It Short-Term
U.S.–Japan trade talks may include FX discussions, but no strong pressure is expected to strengthen the yen. Trump’s tariffs continue to weigh down Japan’s growth and could further tilt downward.

SHORT ON SPX/USDSpy has created a Double top followed by a CHOC and retest to the downside.
Their is plenty sell side liquidity to be collected as I expect a major drop on spy.
Looking to catch 300-400 points on SPY.


EURUSD Bearish Market Structure Unfolding – Liquidity Grab BelowEURUSD Bearish Market Structure Unfolding – Liquidity Grab Below Support Expected"
🔍 Technical Analysis Breakdown:
🔺 Resistance Zone (1.17500 - 1.18500)
Labelled “Strong High”, this is a high-supply zone where price previously reversed.
Multiple Break of Structure (BOS) and Change of Character (CHoCH) confirm this as a strong bearish supply area.
Any retracement toward this level could be ideal for short entries.
🟩 Fair Value Gap (FVG)
This imbalance area previously served as a magnet for price before it broke down.
Price failed to hold inside the FVG, reinforcing bearish sentiment.
🔻 Support Zone (1.13500 - 1.14000)
Marked as a "Weak Low", suggesting this level is likely to be taken out in a liquidity sweep.
Price is expected to retest and potentially break below this zone in the near term.
📉 Current Price Action
Recent CHoCH (Bearish) confirms shift in structure.
Price has made a corrective pullback and seems poised for another leg down.
Highlighted grey zone suggests price may retrace slightly higher before continuing its bearish move.
🎯 Bias: Bearish
Expecting downside continuation toward 1.13500 support, targeting liquidity below.
Traders may wait for rejection signals on lower timeframes around the minor pullback zone before executing shorts.
📚 Educational Notes:
CHoCH indicates a shift in market sentiment (from bullish to bearish).
FVG often acts as a magnet but if not respected, confirms momentum in the opposite direction.
Support/Resistance zones are used to determine institutional activity zones.

LINK SHORT It seems like a lower high has now formed. Following the trend positioning into a short position makes sense here.

XAUUSD Chart Analysis – Smart Money Concepts (SMC) Based🔍 XAUUSD Chart Analysis – Smart Money Concepts (SMC) Based
1. Market Structure Overview:
The chart clearly shows a bullish market structure forming after a sequence of Breaks of Structure (BOS) and Change of Character (CHoCH) events.
The market has consistently made Higher Lows, indicating strength from the bulls and institutional order flow to the upside.
2. Key Zones Identified:
✅ Strong Support Zone (Demand Area):
Around $3,260–$3,280, this level has been respected multiple times.
It is marked with BOS, CHoCH, and a Bullish Fair Value Gap (FVG) indicating institutional accumulation and unfilled orders.
The area also contains a Weak Low, which gives price a reason to stay above if bullish sentiment continues.
❌ Strong Resistance Zone (Supply Area):
Around $3,420–$3,460, this area shows signs of Level Rejection and is labeled with Buy-Side Liquidity.
This is where price previously reversed after grabbing liquidity—indicating distribution and possible shorting interest from smart money.
3. Liquidity Zones:
Buy-Side Liquidity: Above recent swing highs near $3,420–$3,440. Price tapped this level and sharply rejected.
Sell-Side Liquidity (Target Area): Currently aiming for the zone around $3,350, which aligns with a recent imbalance (FVG) and a clean liquidity pool below short-term higher lows.
4. Fair Value Gaps (FVGs):
A Bullish FVG is seen mid-chart, where price was rapidly driven up, leaving a gap—price later returned to this zone, respected it, and pushed higher again.
This is a strong sign of institutional entry and provides excellent long entries.
5. Trend Confirmation:
BOS + CHoCH + Higher Lows = Bullish Bias.
Each low is forming higher than the previous, with strong rejections from demand zones.
6. Entry & Target Insight:
Entry Point: After price reacted from support and printed another Higher Low.
Target: Currently price is targeting $3,350 (short-term retracement or pullback target).
This target is likely an internal liquidity sweep before potential continuation to retest the resistance zone again.
7. Educational Takeaways:
Market Structure is King: Observe BOS/CHoCH for directional bias.
Liquidity Matters: Understand where liquidity is resting—price seeks it.
FVG as Entry Tool: Fair Value Gaps provide high-probability trade setups when aligned with structure.
Patience at Key Zones: Wait for confirmations at resistance/support rather than impulsive trades.
✅ Summary:
Bias: Bullish, until structure breaks.
Short-Term Target: $3,350 (as per the chart).
Long-Term View: If price maintains higher lows, potential revisit to the resistance zone ($3,420–$3,460) is likely.
Invalidation Level: Break and close below strong support ($3,260) would shift bias.

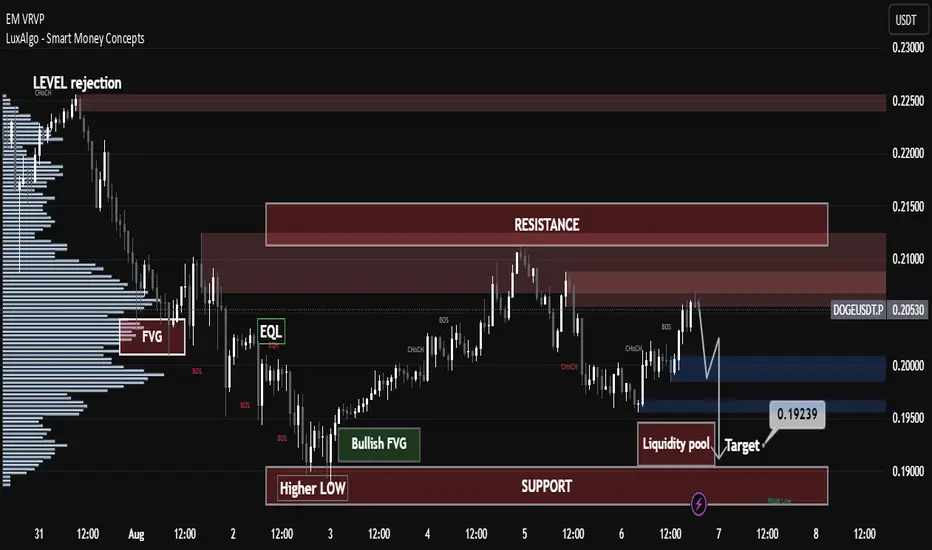
IS DOGE Losing Steam or Gearing Up? Pro-Level Market Structure IS DOGE Losing Steam or Gearing Up? Pro-Level Market Structure
📊 Technical & Trend Analysis
Current Price & Structure:
DOGE is trading around $0.2058 and has recently fallen below both the ascending trendline since late June and the 50‑day EMA (~$0.20), signaling weakening momentum
Resistance & Support Levels:
Major Resistance: ~$0.21–$0.212 — price has repeatedly failed at this zone, forming a possible bearish flag or resistance trap
X (formerly Twitter)
+15
Mitrade
+15
Cryptonary
+15
.
Support Zones: Key levels around $0.196 and $0.18, breach of these may open path to $0.15 or lower short-term
Mitrade
.
Trading Sentiment & Derivatives:
Rising short interest and negative funding rates in futures suggest growing bearish sentiment among traders. Long-short ratio is near 0.86—indicating more shorts than longs
Binance
+1
.
🎓 Technical Setup Summary (Educational Breakdown)
Chart Pattern: Potential bearish continuation forming with flag or descending consolidation after breakdown.
Momentum Indicators: Weak RSI and MACD below zero typically align with this structure—though check live chart from platforms like TradingView or Investing.com
Investing.com
.
Trade Selection Approach:
Short Trade Setup: Wait for confirmation below $0.196 to test trend continuation toward $0.18 or $0.15. Stop-loss above $0.202–$0.205.
Long Trade Setup: If DOGE reclaims $0.21 with volume and breaks above the broken trendline + 50‑day EMA, potential rebound toward ~$0.225 or higher. Stop-loss below $0.20.
🔮 Forecast & Outlook
Short-Term: Likely consolidation or correction toward $0.18 unless bullish momentum resumes. Analysts eye potential targets around $0.199–0.215 in early August, rising maybe toward $0.232 by mid-August if sentiment snaps back
Binance
+2
Indiatimes
+2
Indiatimes
.
Medium to Long-Term:
Some speculative projections place DOGE near $1 by year-end, driven by hype cycles, meme coin revival, celebrity tweets, and ETF optimism. That being said, DOGE’s unlimited supply makes $1 an aggressive target requiring massive capital inflow
Crypto News
+5
Wikipedia
+5
Indiatimes
+5
.
✅ Key Takeaways for Traders & Learners
Concept Insight
Support/Resistance $0.196–$0.18 = bearish supports; $0.21 = strong resistance zone
Trendline & EMA Breaking below trendline/50‑day EMA signals weakening structure
Volume & Funding Increasing shorts and low funding rates hint at bearish pressure
Risk Management Use proper stop-loss zones ($0.196 for shorts, $0.20 for longs)
Catalysts to Watch Whale accumulation, meme hype, ETF news, celebrity endorsements
🚨 Risks & Important Considerations
Volatility & Pump Risks: MEME coins like DOGE are susceptible to pump-and-dump dynamics and social-media driven surges or dumps
Indiatimes
Binance
+1
.
Inflationary Drag: Without a supply cap, DOGE’s price is diluted by thousands of coins mined daily, limiting long-term upward momentum unless demand rises significantly.
Macro Events: Broader economic shocks—such as U.S. tariffs or regulation changes—can rapidly swing sentiment across crypto markets. Recent U.S. tariffs pulled DOGE down ~8% with Bitcoin and Ethereum
Wikipedia
.
🧭 Final Summary
Current Bias: Slightly bearish-to-neutral—downward pressure from technical breakdowns.
Watch Closely: $0.196 support and $0.21–$0.212 resistance; reclaiming one of these defines short-term bias.
Strategy:
Consider short plays below $0.196 toward $0.18.
Consider long plays only after strong breakout above $0.21–$0.212.
Always apply strict risk controls.
—
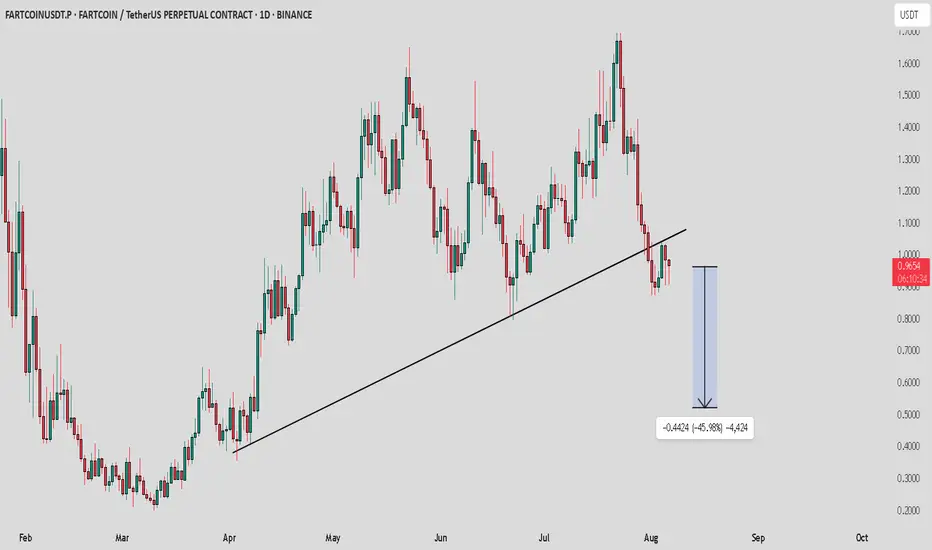
FARTCOIN / USDT : Trendline broken and retest successfulFARTCOIN: Trendline Broken, Bears in Control!
FARTCOIN's uptrend from March has been decisively broken. Price rejected the key trendline and is now showing strong bearish momentum. Expect further downside, with a potential target around $0.50. Bears are firmly in control!
USDCHF: Liquidity Trap Inside Daily ResistanceStep 1: Liquidity Sweep
Price aggressively swept the previous day's high, clearing buy-side liquidity.
Step 2: Break of Structure
Right after the sweep, we got a strong break of structure, confirming a bearish shift.
Step 3: Retracement into Imbalance
Price is now retracing into an unfilled imbalance left behind by the bearish impulse. This area becomes even more significant given the next point.
Step 4: Daily Resistance Confluence
This retracement is unfolding right at a key Daily resistance zone, adding strong higher-timeframe confluence. The likelihood of a reversal from this level increases sharply.
Step 5: Candle Confirmation
I’ll wait for clear signs of seller strength such as wick rejections, engulfing candles, or momentum shift before entering short. No confirmation, no trade.
🔔 Trade Plan
Bias: Short
Entry: Upon confirmation inside the imbalance
Invalidation: Break above the liquidity sweep high
TP: Lower liquidity pool

EURUSD After breaking below the ascending trendline, EUR/USD has confirmed a structural shift with strong bearish momentum. The pair retested the broken trendline and is now facing resistance between 1.1589 – 1.1613, which also aligns with a previous demand zone turned supply.
Price is currently respecting this area and forming a potential lower high, indicating the continuation of the downtrend.
🔻 Trade Setup (illustrated on chart):
Entry: Around 1.1589
Stop Loss: Above 1.1629
Target: Down to the 1.1250 area, near previous consolidation support.
This short setup is supported by:
Bearish break of structure
Failed bullish continuation
Macro backdrop (weak US data pushing rate cut odds up, but EUR remains fundamentally weak amid sluggish EU data)
📉 If price holds below 1.1613, bears may remain in control. A break above this zone invalidates the setup.

continue to maintain gold purchase, 3400⭐️GOLDEN INFORMATION:
Gold prices edged higher on Monday, supported by growing expectations of a Federal Reserve rate cut following last Friday’s disappointing U.S. Nonfarm Payrolls report. XAU/USD is trading around $3,375, up 0.39% on the day.
Speculation over a potential policy shift has strengthened, with markets now pricing in an 87% chance of a rate cut at the Fed’s September 17 meeting — a boost for the non-yielding yellow metal.
Last week’s labor data revealed early signs of weakness in the job market. The U.S. Bureau of Labor Statistics (BLS) revised May and June payrolls down by a combined 258,000 jobs, reinforcing dovish remarks from Fed Governor Christopher Waller, who downplayed tariff-driven inflation and emphasized concerns about the Fed’s full employment mandate.
⭐️Personal comments NOVA:
Uptrend, gold price is maintaining stability. Heading towards 3400, before the expectation of interest rate cut is becoming more and more obvious.
⭐️SET UP GOLD PRICE:
🔥SELL GOLD zone: 3415- 3417 SL 3422
TP1: $3405
TP2: $3394
TP3: $3380
🔥BUY GOLD zone: $3311-$3313 SL $3306
TP1: $3325
TP2: $3338
TP3: $3350
⭐️Technical analysis:
Based on technical indicators EMA 34, EMA89 and support resistance areas to set up a reasonable BUY order.
⭐️NOTE:
Note: Nova wishes traders to manage their capital well
- take the number of lots that match your capital
- Takeprofit equal to 4-6% of capital account
- Stoplose equal to 2-3% of capital account


BTC - About to TankBitcoin is holding below these bearish trendlines pointed out on previous posts.
Here we can see liquidation levels on the HTF.
I see two potential moves:
Scenario A)
115,000 to 17,000-20,000 range
Scenario B)
3 Wave Corrective Pattern
115,000 to 35,000
35,000 to 83,000
83,000 to 8,000-10,000
DXY is retesting a major bearish breakdown on the weekly / monthly time frame. This is why we have been seeing the recent drop, and preparation for a mass liquidation / flash crash.
The above stated is my own personal views and is not intended as financial advice. Please trade responsibly.

Short Idea On LUMBER (LBR1!)Based on :
- Cot Data
- Supply Zone
- Inverted Hammer Candle Confirmation
