bullish momentum, accumulating around 3400⭐️GOLDEN INFORMATION:
Gold price (XAU/USD) regained strong upward momentum during the Asian session on Thursday, rebounding sharply above the $3,400 level in the past hour and recovering much of its overnight pullback from a two-week high. The renewed demand for the safe-haven metal comes as US President Donald Trump downplayed expectations of an imminent resolution to the US-China trade dispute, stating he feels "no rush" to finalize an agreement. Heightened geopolitical tensions—including the ongoing Russia-Ukraine war, instability in the Middle East, and escalating military friction between India and Pakistan—further support gold's appeal as a defensive asset.
⭐️Personal comments NOVA:
Gold price continues to recover well around 3400, FED's speech is quite moderate, predicted early by investors, the market is positive in the recovery trend this week
⭐️SET UP GOLD PRICE:
🔥SELL GOLD zone : 3438- 3440 SL 3445
TP1: $3425
TP2: $3410
TP3: $3395
🔥BUY GOLD zone: $3352 - $3350 SL $3345
TP1: $3365
TP2: $3380
TP3: $3400
⭐️Technical analysis:
Based on technical indicators EMA 34, EMA89 and support resistance areas to set up a reasonable sell order.
⭐️NOTE:
Note: Nova wishes traders to manage their capital well
- take the number of lots that match your capital
- Takeprofit equal to 4-6% of capital account
- Stoplose equal to 2-3% of capital account
Shortsetup

$CRWD double top off W into overbought, $400 pullbackNASDAQ:CRWD on watch for put swing. We have a possible double top off accelerated upswing momentum. Expecting a pullback into the 50 and 20 EMAs.
WSL

Pull Back is RequiredAMZN Sell Setup - GETTEX:AMZ
Bearish Momentum on Daily Chart
Instrument: AMZN
Timeframe: Daily
Direction: Sell
Confidence: 75%
Setup Overview:
AMZN is showing bearish signals after a recent pullback. MACD has a bearish crossover, and RSI is overbought at 61.25, indicating potential for a downward move. VIX is rising, and 10-year yields are increasing, adding to market pressure. Social sentiment on X is mixed, but news sentiment leans bearish.
Trade Details:
Entry Price: $198.82
Profit Target: $182.23 (~5% downside)
Stop Loss: $205.61 (2:1 risk-reward ratio)
Position Size: 4% of portfolio
Expected Move: -5%
Key Indicators:
MACD: Bearish crossover
RSI: Overbought at 61.25
Market Context: Rising VIX, increasing 10-year yields
Follow for Best AI Signals on the market

Possible Next GBP JPY MoveLooking at the Daily, 1HR and 15M charts, looking to take out the 1HR FVG. Then head down toward the 15M FVG. To then continue a downward move, taking out recent lows to the Daily FVG.

GOOG Simple Short TradeCRACK!
GOOG has now broken a key area with the potential to have a huge move down.
This is a very simple trade with great risk/reward.
Bulls!! Caution is in order!!

NFLX Bearish Setup!This is a simple setup that almost anyone can read—a Head & Shoulders at the top signaling a reversal pattern.
Contrary to popular belief H&S are continuation patterns if they are not at a top.
The only other time H&S are reversal patterns is if the chart has multiple H&S everywhere.
Time for bulls to take their money and RUN!!! The fun ride is over for a while. Time to go home. ((
CAUTION!
Click BOOST, follow subscribe. Let me help you navigate these crazy markets. ))

EUR/USD Rejected at Resistance – Bearish Setup in Motion!Timeframe: 15-Minute (M15)
Designed for short-term or intraday trades.
Entry Zone (Short):
Price is reacting to a fresh supply zone around 1.13260–1.13280.
Stop Loss:
Just above the supply zone, near 1.13280 (tight SL setup).
Bearish Reaction:
Price rejected resistance with a wick and bearish body — strong confirmation of selling pressure.
Target Zone (Demand):
A wide green demand area is marked at 1.12810–1.12830, providing a solid take-profit level.
Structure Bias:
Current formation shows lower highs and clear resistance respect — indicating bearish momentum.
Risk-to-Reward Ratio:
Strong RRR (more than 2:1) – minimal risk for decent reward.

Cold shower for bitcoinAs I mentioned earlier — when gold cools down, Bitcoin tends to rise. And when gold climbs, Bitcoin usually takes a breather. Don’t forget this dynamic.

$MSTR regretting the missed shortJust steadily up the last month. Reversal candles coming in. Wish I had puts. I’m an idiot. Retrace to $350-$360.

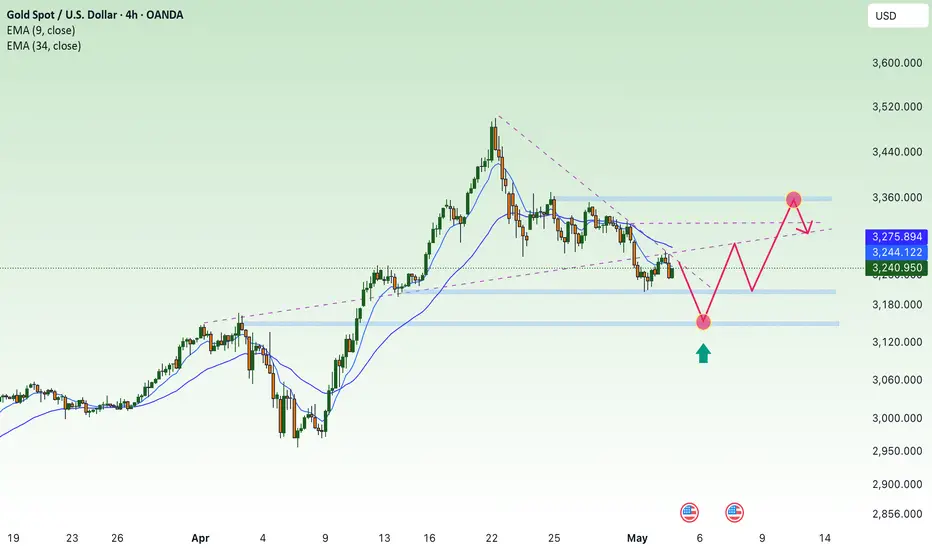
Lack of bullish momentum, gold price waits, slight decrease✍️ NOVA hello everyone, Let's comment on gold price next week from 05/05/2025 - 05/09/2025
🔥 World situation:
Gold (XAU/USD) slipped by more than 0.35% on Friday and is on track to close the week with a decline exceeding 2.5%, as easing trade tensions and upbeat US labor market data boosted investor risk appetite. This shift in sentiment encouraged profit-taking ahead of the weekend, weighing on the safe-haven asset. At last check, XAU/USD was trading around $3,226, pulling back from an intraday peak of $3,269.
Adding to the improved market mood, China’s Commerce Ministry confirmed that the US has shown a willingness to resume discussions on tariffs, while reiterating that Beijing remains open to dialogue.
🔥 Identify:
Gold price continues to adjust down, lacking momentum to increase price. around price range 3200 - 3350
🔥 Technically:
Based on the resistance and support areas of the gold price according to the H4 frame, NOVA identifies the important key areas as follows:
Resistance: $3285, $3316, $3355
Support : $3202, $3155
🔥 NOTE:
Note: Nova wishes traders to manage their capital well
- take the number of lots that match your capital
- Takeprofit equal to 4-6% of capital account
- Stoplose equal to 2-3% of capital account
- The winner is the one who sticks with the market the longest
BTC - “Bull Market” OR Bearish Retest on HTF? Bitcoins excessive rise for the previous two years brings concern for the mechanics of this market. Moving only up for so long leaves much liquidity in the form of long position stop losses below the current price.
These stop loss orders, or leveraged sell orders, are an explosive chain reaction ready to set off.
Observe these two trendlines and copy them to your charts. These two bearish trendlines (in my view) are why bitcoin has truly been rising so freely.
Moves up in the form of bearish retests are fast and fluid, only after the rejection does price fall aggressively.
I anticipate two scenarios here in the realm of bearish ideas:
Possibility 1 - 30% Probability
96,700 to 34,500
34,500 retrace to 68,500
68,500 to 7,000
Possibility 2 - 70% Probability
96,700 to 43,000
43,000 retrace to 60,000
60,000 to 7,000
Note that both of these possibilities end with 7,000. I’m mapping out two routes that take us there, using confluences with trendlines, volume profiles, liquidity mapping, and common sense.
Be mindful of this possibility. And protect yourself accordingly.

BTC Shortwe in 4h sibi + week -breaker
we are have 4h - braker
Price need rebalance zone its
-week bisi
-day bisi
-4h bisi
Below we are have month bisi
Lets see week bisi can be true support and move price to new Higher High or this make inversion
Now I look short for 91060

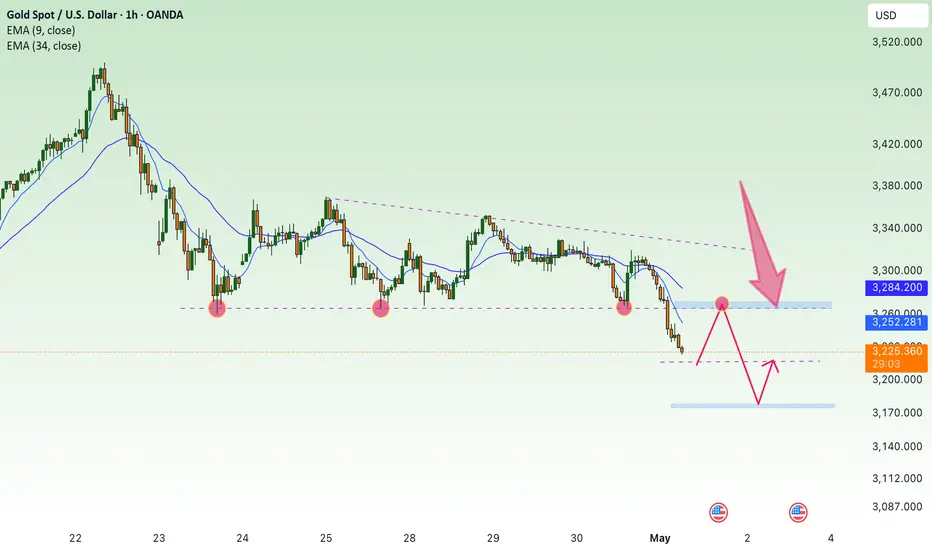
NF fluctuates in a downward trend⭐️GOLDEN INFORMATION:
China’s Ministry of Commerce announced Friday that the United States has recently initiated communication through official channels, expressing interest in reopening talks on tariffs. Beijing is currently evaluating the proposal, fueling optimism that a resolution to the prolonged tariff standoff between the world’s two largest economies may be on the horizon.
This renewed hope for a breakthrough in trade negotiations helped lift the US Dollar to a three-week high on Thursday, pressuring Gold prices down toward the $3,200 mark. However, bullish momentum for the USD remains tempered as markets increasingly price in the likelihood of more aggressive rate cuts by the Federal Reserve, especially with the closely watched US Nonfarm Payrolls data looming.
⭐️Personal comments NOVA:
NF news volatility is certain, with the big accumulation from last week. Gold price has confirmed the trend after breaking 3267, will fluctuate in a downtrend below 3200
⭐️SET UP GOLD PRICE:
🔥SELL GOLD zone : 3312- 3310 SL 3317
TP1: $3290
TP2: $3280
TP3: $3270
🔥BUY GOLD zone: $3175 - $3177 SL $3170
TP1: $3185
TP2: $3200
TP3: $3210
⭐️Technical analysis:
Based on technical indicators EMA 34, EMA89 and support resistance areas to set up a reasonable SELL order.
⭐️NOTE:
Note: Nova wishes traders to manage their capital well
- take the number of lots that match your capital
- Takeprofit equal to 4-6% of capital account
- Stoplose equal to 2-3% of capital account

SHORT ON EUR/JPYEUR/JPY has created a head and shoulders pattern at a major resistance area.
I will be selling EJ to the pervious swing low / demand level.

Gold price weakens, correction 3176⭐️GOLDEN INFORMATION:
Gold’s intraday decline appears partly driven by technical selling pressure after decisively breaking below the key $3,265–$3,260 support zone. However, the US Dollar (USD) struggles to sustain any significant recovery as expectations grow for more aggressive Federal Reserve (Fed) rate cuts—fueled by an unexpected contraction in US GDP and signs of softening inflation. These factors may continue to support demand for the non-yielding precious metal, suggesting that traders should remain cautious before anticipating a deeper pullback from the recent all-time high near $3,500.
⭐️Personal comments NOVA:
Crossing the 3264 mark in the sideways price zone, gold prices continue to weaken.
⭐️SET UP GOLD PRICE:
🔥SELL GOLD zone : 3270- 3272 SL 3277
TP1: $3260
TP2: $3250
TP3: $3240
🔥BUY GOLD zone: $3178 - $3176 SL $3171
TP1: $3185
TP2: $3200
TP3: $3210
⭐️Technical analysis:
Based on technical indicators EMA 34, EMA89 and support resistance areas to set up a reasonable SELL order.
⭐️NOTE:
Note: Nova wishes traders to manage their capital well
- take the number of lots that match your capital
- Takeprofit equal to 4-6% of capital account
- Stoplose equal to 2-3% of capital account
SHORT ON GOLDGOLD has created a nice head and shoulders pattern and has also broke the neckline.
Since then we have created a lower high and are starting to push down.
Dollar should rise after news today at 8:15 this would aid in pushing gold down.
I will be selling gold to the 3000 price level looking to catch 2000 pips.

EURGBP Short SetupEURGBP Short Setup
4H Chart Trendline Breakdown and Retest
Entry : 0.84944
Stop Loss : 0.86678
Take Profit : 0.83310
RR 1 to 1.9
Market broke below the ascending support and retested the underside of a broken trendline confluence. Bearish pressure is building as price fails to reclaim 0.85396 zone. Clean structure for continuation to the downside.
Price is now respecting lower highs with momentum shifting beneath structure. This setup targets the previous demand zone near 0.833 region where price consolidated before the last impulse up.
As long as price holds below 0.854 zone, bearish bias remains valid.

SHORT ON GBP/USDGBP/USD Has bearish divergence on the 4hr timeframe.
This is a bearish reversal indication. Price is also over brought on GU.
The Dollar (dxy) Looks like it will start to rise from its demand area.
I will be selling GU looking to catch over 300-400 pips to the previous swing low /demand zone.

#WALUSDT continues its bearish momentum 📢 As long as the price stays under $0.6000 — short BYBIT:WALUSDT.P bias remains valid.
📢 Watch for further weakness!
📉 SHORT BYBIT:WALUSDT.P from $0.5794
🛡 Stop loss: $0.6000
🕒 Timeframe: 1H
✅ Overview:
➡️ The chart shows a clearly formed and broken Bearish Rectangle, confirming a short setup after price exited the range to the downside.
➡️ The $0.6090 support level has turned into strong resistance.
➡️ Entry at $0.5794 follows a textbook breakdown and retest structure.
➡️ Target area aligns with the volume-based support near POC $0.515, offering solid R:R.
🎯 TP Targets:
💎 TP 1: $0.5725
💎 TP 2: $0.5665
💎 TP 3: $0.5600
📢 Bearish structure confirmed with increased volume.
🚀 BYBIT:WALUSDT.P continues its bearish momentum — downside potential remains active!

Bitcoin - Back Under Intersecting Bearish TrendlinesBitcoin is back underneath these two intersecting bearish trendlines.
I have laid out two potential paths Bitcoin could take to play this out.
When an asset in crypto goes only up for so long, it leaves behind a trail of leveraged liquidity in the form of stop losses. These wide open gaps filled with long stop losses, is the fuel that would make such a move possible. In other words, the sell orders are already in the chart in order to make this possible.
Personally, I expect this to happen.
DXY is showing a major breakdown and bearish retest at the moment - with a falling dollar over the next 2-3 years, that translates to a true bull market for Bitcoin and related assets.
The market has a very small time window to recollect all of the long position liquidity in the chart, which is in the billions.
See my previous posts to see confluences, liquidity mapping, etc.
Happy trading and I will be trading this myself.

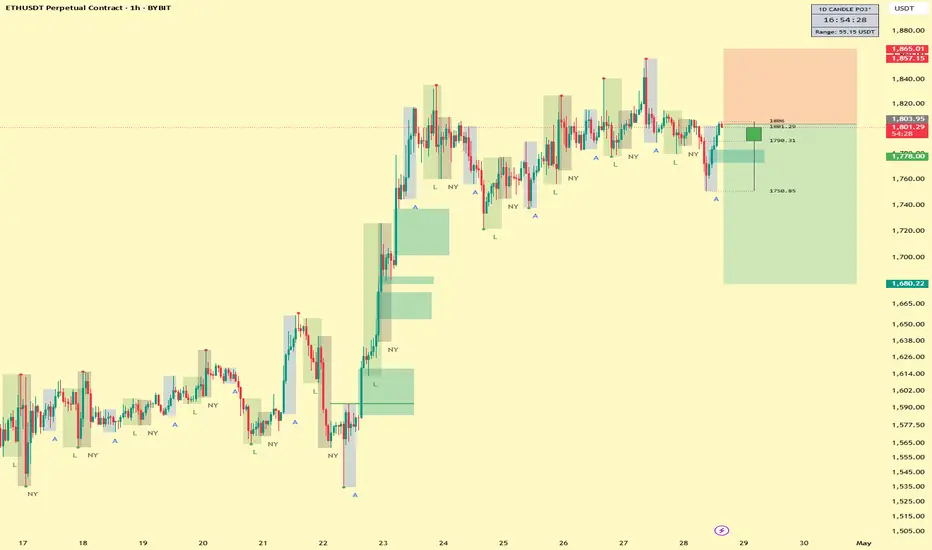
ETHUSD SHORT 1PercentFundedTICKER: ETHUSD
ENTRY 1: 1810
ENTRY 2: 1795
SL: 1865
TP1: 1720
TP2: 1680
Trade Active
H4 downtrend line, gold price cools down✍️ NOVA hello everyone, Let's comment on gold price next week from 04/28/2025 - 05/02/2025
🔥 World situation:
Gold prices reversed course on Friday, wiping out Thursday’s gains and slipping below the $3,300 threshold, as persistent US Dollar strength weighed heavily on the precious metal despite declining US Treasury yields. The easing of tensions in the US-China trade dispute further pressured bullion, with XAU/USD trading around $3,294, down more than 1.6%.
Market sentiment remains fragile, swinging sharply between risk-on and risk-off modes in response to comments from US President Donald Trump. Earlier, Bloomberg reported that China was considering tariff exemptions on some US goods, sparking optimism. However, the mood soured after Trump asserted that he would not lift tariffs on China without significant concessions.
🔥 Identify:
News about Russia-Ukraine peace talks this weekend will continue to put selling pressure on gold prices next week. Moving along the downtrend line H4
🔥 Technically:
Based on the resistance and support areas of the gold price according to the H4 frame, NOVA identifies the important key areas as follows:
Resistance: $3357, $3498
Support : $3228, $3155
🔥 NOTE:
Note: Nova wishes traders to manage their capital well
- take the number of lots that match your capital
- Takeprofit equal to 4-6% of capital account
- Stoplose equal to 2-3% of capital account
- The winner is the one who sticks with the market the longest

Doge Usdt ShortHello dear friends, I have a short theory on Dogecoin with a specified stop. The market is closed and the volume is low, please manage your money.
