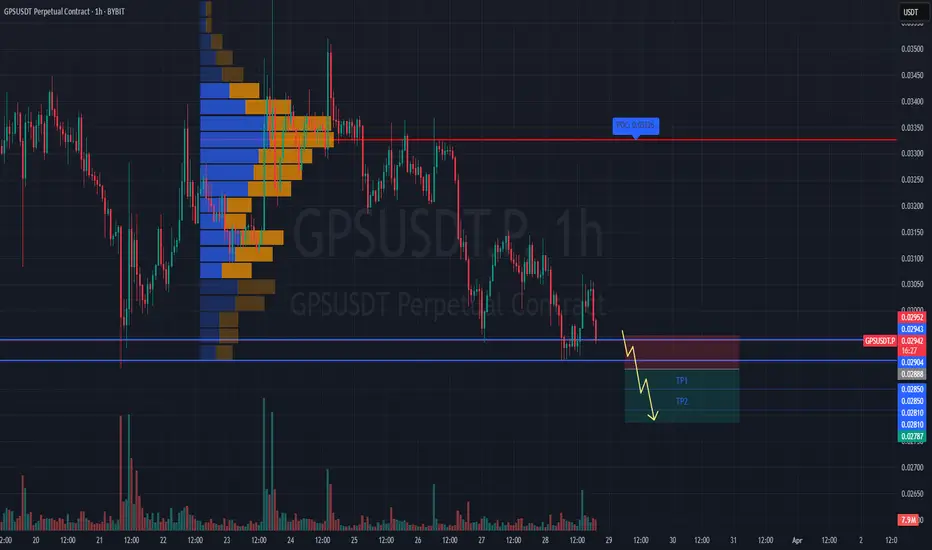
#GPSUSDT is forming a bearish structure📉 Short BYBIT:GPSUSDT.P from $0.02888
🛡 Stop loss $0.02952
🕒 1H Timeframe
⚡️ Overview:
➡️ The main POC (Point of Control) is at 0.03326, marking the highest volume zone and a major resistance above the current price.
➡️ The 0.02952 level acts as local resistance and an ideal stop placement.
➡️ Price BYBIT:GPSUSDT.P has already tested the $0.02888 support — a confirmed breakdown could trigger stronger downward momentum.
➡️ Volume is increasing on the decline, supporting the sellers' pressure.
🎯 TP Targets:
💎 TP 1: $0.02850
💎 TP 2: $0.02810
💎 TP 3: $0.02787
📢 Watch for a clean break of the $0.02888 level — it could be the entry trigger for this short setup.
📢 If price pulls back above $0.02952, the short scenario becomes invalid.
BYBIT:GPSUSDT.P is forming a bearish structure — continuation to the downside is expected if support fails.
Shortsetup
eurjpy bearish moveit seems to be a similar movement n most of JPY pairs
a possible bearish movement on eurjpy on a daily timeframe

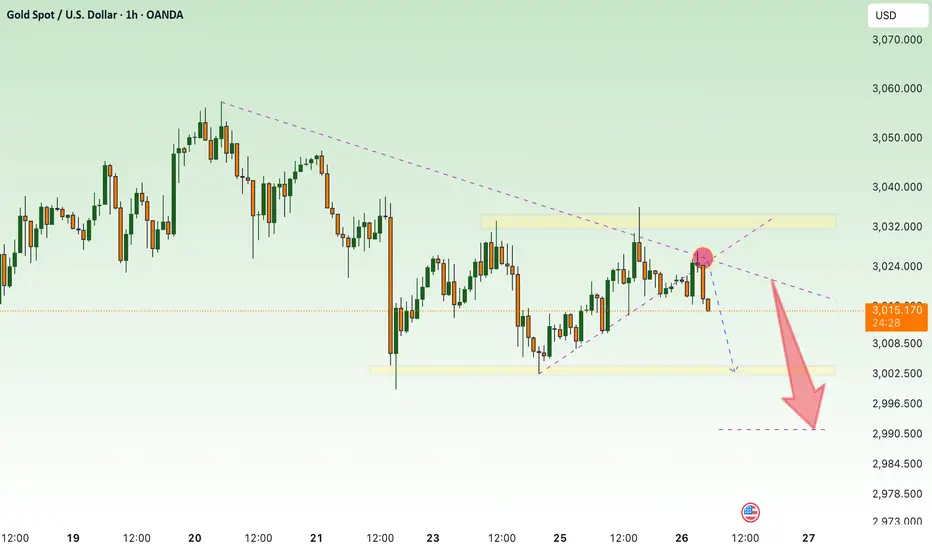
A Gold'en Newtonian Sell-Off Porjected By MedianlinesSir Isaac Newton stated the Third Law of Motion in his landmark work, Philosophiæ Naturalis Principia Mathematica (commonly called the Principia), which was first published in 1687. This law appears in Book I, in the section titled Axioms, or Laws of Motion.
(Axiom: A self-evident truth)
Newton did explicitly present it as an axiom. In fact, it's Axiom III (or Law III) of his three fundamental laws of motion. Here's how he phrased it in the original Latin and in his own English translation:
"To every action there is always opposed an equal reaction: or the mutual actions of two bodies upon each other are always equal, and directed to contrary parts."
And what does this have to do with Medianlines / pitchforks?
This tool measures exactly that: the action — and the potential reaction!
Medianline traders know that pitchforks project the most probable direction that a market will follow. And that direction is based on the previous action, which triggered a reaction and thus initiated the path the market has taken so far.
…a little reciprocal, isn’t it? ;-)
So how does this fit into the chart?
The white pitchfork shows the most probable direction. It also outlines the extreme zones — the upper and lower median lines — and in the middle, the centerline, the equilibrium.
We see an “undershoot,” meaning a slightly exaggerated sell-off in relation to the lower extreme (the lower median line). And now, as of today, we’re seeing this overreaction mirrored exactly at the upper median line!
Question:
What happened after the lower “overshoot”?
New Question:
What do you think will happen now, after the market has overshot the upper median line?
100% guaranteed?
Nope!
But the probability is extremely high!
And that’s all we have when it comes to “predicting” in trading — probabilities.
Why? Because we can’t see the future, can we?
Gold?
Short!
Looking forward to constructive comments and input from you all

$ZRO @LayerZero_Core Long & Short TradesCSE:ZRO @LayerZero_Core Long & Short Trades
#1 Long from TRP Blue Zone frontrun ☹️
#2 Long from Twin OB retest TP2 Hit ✅
#3 Short entry only if VAL is lost ⌛️
SHORT ENTRY = only if VAL is lost
SL = above old POC & Daily Open
------------
------------
As always, my play is:
✅ 50% out at TP1
✅ Move SL to entry
✅ Pre-set the rest of the position across remaining TPs
It's important to take profits along the way and not turn a winning trade into a losing trade.

SHORT ON US30US30 Has given a change of character (choc) on the 4hr TF indicating the end of its uptrend pullback on its overall downtrend.
I will be selling US30 to the next level of demand looking to capture over 1000 points.

continue downtrend , GOLD⭐️GOLDEN INFORMATION:
Gold price (XAU/USD) holds steady above the key $3,000 level for the second consecutive day on Wednesday, though it struggles to reclaim the previous session’s peak. Ongoing uncertainty surrounding US President Donald Trump’s proposed reciprocal tariffs set for next week continues to bolster demand for the safe-haven metal. At the same time, the US Dollar (USD) remains under pressure following Tuesday’s weaker-than-expected macroeconomic data, providing additional support for gold’s upward momentum.
⭐️Personal comments NOVA:
Gold price continues to decrease, around 2990 - 3000
⭐️SET UP GOLD PRICE:
🔥SELL GOLD zone: $3039 - $3041 SL $3046
TP1: $3030
TP2: $3020
TP3: $3010
🔥BUY GOLD zone: $2992 - $2990 SL $2985
TP1: $3000
TP2: $3008
TP3: $3018
⭐️Technical analysis:
Based on technical indicators EMA 34, EMA89 and support resistance areas to set up a reasonable SELL order.
⭐️NOTE:
Note: Nova wishes traders to manage their capital well
- take the number of lots that match your capital
- Takeprofit equal to 4-6% of capital account
- Stoplose equal to 2-3% of capital account
#ARCUSDT is showing signs of reversal📉 Short BYBIT:ARCUSDT.P from $0.06780
🛡 Stop loss $0.07117
🕒 1H Timeframe
⚡️ Overview:
➡️ The main POC (Point of Control) is at 0.05873, indicating the area with the highest trading volume.
➡️ The 0.07117 level acts as strong resistance where the price previously reversed.
➡️ The chart shows a potential topping structure followed by a decline.
➡️ Volume concentration between $0.065 and $0.06210 suggests key zones for potential profit-taking.
🎯 TP Targets:
💎 TP 1: $0.06510
💎 TP 2: $0.06210
💎 TP 3: $0.06050
📢 Watch the key levels and enter after confirmation!
📢 The price has already started to move down — downside momentum remains strong.
📢 The TP levels are near a previous consolidation zone, allowing quick target execution.
BYBIT:ARCUSDT.P is showing signs of reversal — considering shorts with clear downside targets!

BTCUSD 1H | POI Reaction Setup After Sweep – Short Flow by CelesBTC tapped into a clean POI zone after sweeping highs.
A market structure shift (MSS) formed, showing early signs of bearish intent.
Price is now reacting from the zone, and we’ve mapped the clean flow toward the 2H demand base.
Invalidation is clearly marked — a clean break above 88,005 would flip the bias.
Precise POI, projection, and target laid out.
— CelestiaPips

Gold declines, accumulate and wait for April news⭐️GOLDEN INFORMATION:
Gold price (XAU/USD) continues its pullback, slipping toward $3,025 in early Asian trading on Monday. The metal retreats from Thursday’s record high, driven by renewed optimism over a potential Ukraine peace deal. However, expectations of Federal Reserve (Fed) rate cuts and lingering economic uncertainties could provide support, limiting further downside for the yellow metal.
⭐️Personal comments NOVA:
Gold is under pressure to sell and take profits in the short term. There is still a lot of liquidity in the 3000 price zone. The price will continue to accumulate around $3000.
⭐️SET UP GOLD PRICE:
🔥SELL GOLD zone: $3031 - $3033 SL $3038
TP1: $3020
TP2: $3010
TP3: $3000
🔥BUY GOLD zone: $2991 - $2993 SL $2986
TP1: $3000
TP2: $3008
TP3: $3017
⭐️Technical analysis:
Based on technical indicators EMA 34, EMA89 and support resistance areas to set up a reasonable SELL order.
⭐️NOTE:
Note: Nova wishes traders to manage their capital well
- take the number of lots that match your capital
- Takeprofit equal to 4-6% of capital account
- Stoplose equal to 2-3% of capital account

Silver (XAG/USD) – Rising Wedge Breakdown & Bearish Setup📊 Overview of the Chart
This 4-hour chart of Silver (XAG/USD) provides a classic example of a Rising Wedge Breakdown, a bearish reversal pattern. The price initially followed a strong uptrend, forming a series of higher highs and higher lows, but failed to sustain momentum at the key resistance zone (~$34.00 - $34.50). This led to a breakout to the downside, which has now confirmed a shift in market sentiment from bullish to bearish.
This analysis will break down each key level, the technical indicators supporting this trade setup, and how traders can approach it effectively.
🛠️ Breakdown of the Chart Components
1️⃣ Rising Wedge Formation (Bearish Pattern Identified)
The price action created a Rising Wedge, which is a bearish pattern characterized by an uptrend where the higher highs and higher lows start converging into a narrowing range.
This shows that while buyers were pushing prices higher, their strength was gradually fading.
The breakdown of this structure signaled a loss of bullish momentum, leading to a shift in trend.
2️⃣ Resistance Level & Sell Zone Identified
The resistance level at $34.00 - $34.50 has acted as a supply zone where sellers stepped in, preventing further upside.
A bearish rejection at this zone confirms that sellers are still dominant.
3️⃣ Retest of the Broken Support (Key Confirmation)
After the breakout from the wedge, the price made a retest of the broken trendline, a classic move before further downside.
Retesting this area confirms that it is now acting as resistance rather than support, further strengthening the bearish case.
4️⃣ Trendline Breakout – Shift in Market Structure
The dashed trendline was previously supportive, but now that the price has broken below it, it has turned into a resistance level.
This shift in market structure is a strong bearish signal.
5️⃣ Key Support Levels & Target Projection
The next major support level is at $32.00, a level where price previously found demand.
The ultimate target price is around $31.18, which aligns with historical support and Fibonacci retracement levels.
📉 Trading Strategy – How to Trade This Setup?
✅ Entry Point (Short/Sell Setup)
A good shorting opportunity arises if the price retests the resistance at $33.50 - $34.00 and shows bearish confirmation (like a rejection candlestick or a bearish engulfing pattern).
📍 Stop Loss (SL) Placement
SL should be above $34.20 to avoid getting stopped out by potential fakeouts.
🎯 Take Profit (TP) Levels
TP1: $32.00 (First support level)
TP2: $31.18 (Final bearish target)
📊 Risk-Reward Ratio
Entry at $33.50 - $34.00 with SL at $34.20 and TP at $31.18 provides an excellent risk-to-reward ratio (~1:4).
📌 Market Sentiment & Conclusion
🔴 Bearish signals are dominant, suggesting further downside potential.
📉 A strong bearish move is expected if the price fails to reclaim $34.00.
🎯 Targeting $31.18 in the upcoming sessions.
📢 Final Advice: Traders should watch for confirmation before entering trades. A successful retest and rejection at $33.50 - $34.00 will be a high-probability short setup. 🚀
🔥 Follow price action and risk management principles for a successful trade! 🔥

BTC - ABC Correction to Absorb Long Liquidity Further to my previous recent post, I wanted to highlight two indicators that accurately present us with liquidity on the BTC chart.
Connecting the pieces of the puzzle of this prediction - this ABC correction pattern allows the market to absorb the Long position liquidity left in tact on the chart.
Since these long positions leave a trail of leveraged sell orders (stop losses) - we should expect a mass chain reaction of these orders setting off one into the next, with increasing speed and momentum of the drop.
We do not need a black swan event for this to occur. The orders are already in the chart to allow it to happen, as an adverse consequence to open interest and open traders positions during the last 2 years.
There is many confluences to support this correction pattern, if interested in learning more, see my previous posts on Trading View.
Enjoy!

Reminder - Bitcoin back below these trendlinesI encourage you guys to draw these trendlines on your chart and experiment by doing some exercises.
1. Draw the main two trendlines.
2. Spend time on each by duplicating it, keeping the angle the same, and moving it to different spots on the chart. Notice how Bitcoin works on this ascending diagonal support resistance structure. You’ll find that the correct trendline can be duplicated infinitely and the price respects it at any point you place it.
3. Notice that price consolidates on these ascending lines. We see breaks above or below depending on the stop losses from futures positions and liquidity that’s collected. In other words, a break above doesn’t invalidate it.
4. Notice that Bitcoin moves above and below these trendlines.
5. It’s in my opinion that THIS is the structure that explains why Bitcoin isn’t moving higher, telling me the market wants to keep price below these trendlines and take back the liquidity in these zones (look at my previous posts for liquidity maps)
Personally this is still my trade.
God bless and may you live to trade another day!

Gold price start to adjust yet?⭐️GOLDEN INFORMATION:
Gold prices (XAU/USD) face renewed selling pressure during the Asian session on Friday, retreating toward the $3,030 level in recent trading, inching closer to the previous session’s low. The US Dollar (USD) maintains its upward trajectory for the third consecutive day, prompting some profit-taking on the precious metal ahead of the weekend. However, a confluence of supportive factors is likely to keep bullion resilient, positioning it for a third consecutive week of gains.
⭐️Personal comments NOVA:
Breaking the trend, has gold price really been in the weekend price adjustment rhythm? According to NOVA, it has started. Before the tax policies in early April, the market needs a little balance in terms of liquidity on the selling side.
⭐️SET UP GOLD PRICE:
🔥SELL GOLD zone: $3040 - $3042 SL $3047
TP1: $3030
TP2: $3020
TP3: $3010
🔥BUY GOLD zone: $3019 - $3017 SL $3014 scalping
TP1: $3023
TP2: $3030
TP3: $3040
🔥BUY GOLD zone: $3000 - $3002 SL $2995
TP1: $3010
TP2: $3020
TP3: $3030
⭐️Technical analysis:
Based on technical indicators EMA 34, EMA89 and support resistance areas to set up a reasonable SELL order.
⭐️NOTE:
Note: Nova wishes traders to manage their capital well
- take the number of lots that match your capital
- Takeprofit equal to 4-6% of capital account
- Stoplose equal to 2-3% of capital account

Auction - bearish divergence!Dear My Friends,
The Auction is making a very strong impression on me, as it is going against the current market trend. So, I decided to observe Auction’s chart across different timeframes. On the monthly timeframe, it didn’t give me a clear perspective, as the indicators provided conflicting conclusions.
I then switched to a smaller timeframe, the weekly chart. And everything became very clear here: a bearish divergence is very evident, and the indicators are all in agreement. As you can see, the price is still rising sharply. However, the trading volume is decreasing. The RSI indicator also shows a divergence compared to the price index.
The RSI is currently above 80. Therefore, I will place a Short order and take profits at three price levels as shown on the chart.
I hope my analysis will support my friends. Please manage your risks carefully before entering any trades.
Best Regards,

$CRWD $350 retestHi, sensing a flip here. $350 big support looking to retest in week or two.
Short term puts.
WSL

$AAPL $200 right?Apple looks very weak IMO. In this current climate and uncertainty sentiment and lack of innovation I believe we see a retest of $200, we are around the sell point for Mr. Buffet. $200 big psyche price.
Short term puts. WSL

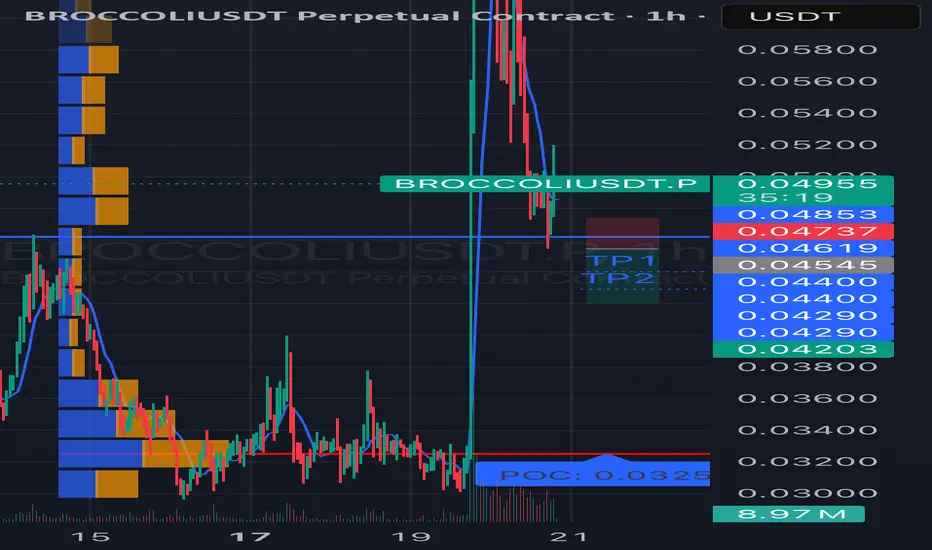
#BROCCOLIUSDT is showing bearish potential SHORT BYBIT:BROCCOLIUSDT.P from $0.04545
🛡 Stop Loss: $0.04737
🕒 Timeframe: 1H
⚡️ Overview:
➡️ BYBIT:BROCCOLIUSDT.P is showing bearish momentum on the 1-hour timeframe after a significant drop from $0.06000 to the current consolidation zone of $0.4203–$0.4885.
➡️ The price recently tested the $0.04545 level (a possible retest of a broken support, now acting as resistance), which could serve as an entry point for a short.
➡️ The volume profile on the left shows strong buyer interest at $0.0325 (POC), which acts as a key support level. However, the lack of significant buying volume at current levels suggests potential for further downside.
➡️ The price structure remains bearish: lower highs and lows are forming after the drop.
➡️ The RSI (14) indicator on the 1H timeframe is presumably around 45 (based on price action), indicating neutral momentum with room for a downward move.
🎯 Take Profit Targets:
💎 TP 1: $0.04400
💎 TP 2: $0.04290
💎 TP 3: $0.04203
⚡️Plan:
➡️ Entry: Sell below $0.04545 after the 1-hour candle closes below this level to confirm the rejection from resistance.
➡️ Stop Loss: Set at $0.04737, which provides a 7% risk from the entry point and protects against a potential breakout.
➡️ Risk/Reward Ratio: From 1:2 (for TP1) to 1:5 (for TP3), making this trade attractive from a risk management perspective.
➡️ After the drop, the price has stabilized, indicating possible consolidation or accumulation.
➡️ Resistance zone: $0.04885 (upper boundary of the current range).
Technical Indicators:
➡️ The chart shows candles in red and green, reflecting bearish and bullish movements.
➡️ After the sharp decline, the price has formed lower highs and lows, but in recent hours, there’s an attempt at recovery.
📢 A price rejection below $0.04545 with increasing selling volume increases the likelihood of reaching the targets.
📢 The $0.04400 and $0.04290 levels may act as areas for partial profit-taking, so monitor price action in these zones.
📢 Risks: If the price breaks above $0.04885, it could signal a false breakdown and a potential reversal to the upside. In this case, consider reassessing the position.
📊 The decline in BYBIT:BROCCOLIUSDT.P aligns with cautious sentiment in the crypto market.
📊 As of March 20, 2025, BYBIT:BTCUSDT.P is trading around $90,000, showing signs of consolidation, which may pressure altcoins like BYBIT:BROCCOLIUSDT.P
BYBIT:BROCCOLIUSDT.P is showing bearish potential on the 1H timeframe.
⚡️A confirmed rejection below $0.04545 is your signal to act!
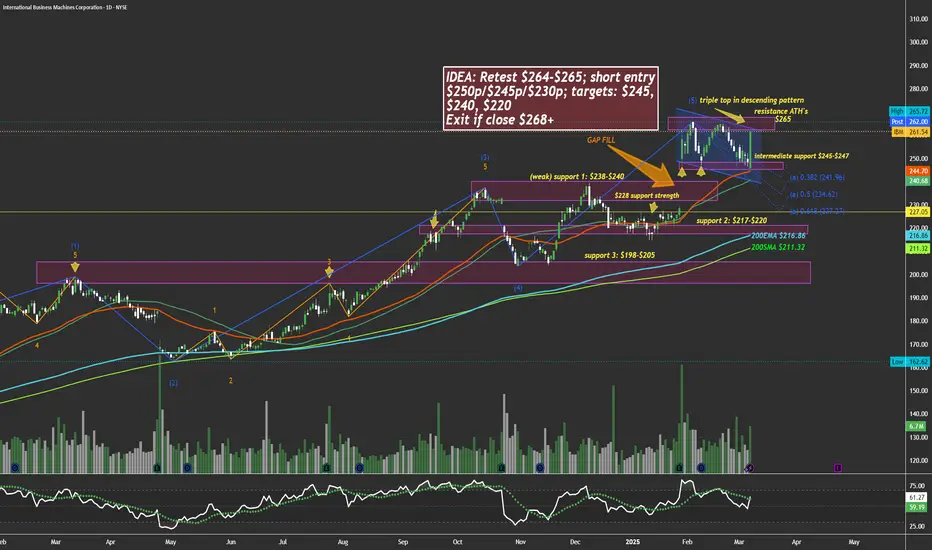
$IBM too hot, due for a chillHi, constructed a chart here showing many levels. I personally think NYSE:IBM will face some downside weeks to come. My trade plan is written in the idea box. The two lines that aren't labeled are 50ema and 50sma.
WSL
SHORT ON NZD/JPYNZD/JPY Has rejected a major resistance area and is breaking structure to the downside.
The JPY index is looking strong from a major demand level. XXX/JPY pairs do the opposite of whatever the index does.
Therefore I will be selling NZD/JPY looking to catch over 200 pips easy.

BTC FOMC FLASH CRASH / LIQUIDATION IDEAThe FOMC data this week could be a conduit that sticks the price to play down these two trend lines.
We can see the mass liquidity on the chart in these low zones.
Bitcoins consistent rise since late 2022 has been leaving a train of long stop loss orders (leveraged sell orders) underneath - think of the mechanics of “why it’s possible” as a massive chain reaction of stop losses getting fired off and creating mania and hysteria for further fear based selling.
If we see drops to these low zones, I’m presenting the TA evidence of it so that we know it’s not the bottom - but a liquidation move.
The worst thing people could do is sell at massive losses thinking BTC is going to zero.
I see this move occurring and following that over the next years, a BTC pushing upwards of those $140-$200k zones.
The market is interested in reclaiming this liquidity - we are awaiting the conduit or event to justify it.
This is my personal trading plan.
Happy trading to all and be safe out there.

#AVLUSDT continues its downtrend 📉 Short BYBIT:AVLUSDT.P from $0,4060
🛡 Stop loss $0,4136
🕒 1H Timeframe
⚡️ Overview:
➡️ The main POC (Point of Control) is 0,4201
🎯 TP Targets:
💎 TP 1: $0,4015
💎 TP 2: $0,3975
💎 TP 3: $0,3945
📢 Monitor key levels before entering the trade!
BYBIT:AVLUSDT.P continues its downtrend — watching for further movement!

BTC - Back Underneath Flash Crash Liquidation ZoneBitcoin is back underneath these trendlines.
Showing confluence with liquidity in the chart on higher time frames.
Be mindful of this correction pattern.

#MUBARAKUSDT continues its downtrend📉 Short BYBIT:MUBARAKUSDT.P from $0,14040
🛡 Stop loss $0,15196
🕒 1H Timeframe
⚡️ Overview:
➡️ The main POC (Point of Control) is Nan
🎯 TP Targets:
💎 TP 1: $0,12395
💎 TP 2: $0,10611
💎 TP 3: $0,09178
📢 Monitor key levels before entering the trade!
BYBIT:MUBARAKUSDT.P continues its downtrend — watching for further movement!
