LIMIT ORDER - #EOS/USDTLIMIT ORDER - $EOS/USDT
Direction: #Short 🔴
Entry Price: 0.766
Stop Loss: 0.85406
Target 1: 0.70734
Target 2: 0.64868
Target 3: 0.59002
Target 4: 0.53137
Target 5: 0.47271
Shortsetup

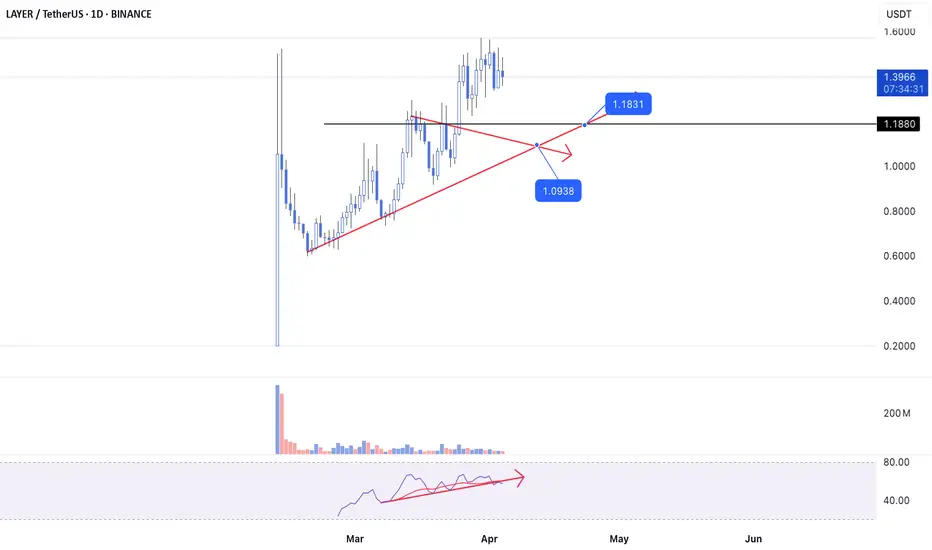
Layer - ShortDear my friends,
I’m observing the Layer chart on larger timeframes. And when switching to the daily timeframe, my perspective becomes quite clear. With the RSI having dropped below support along with a divergence between price and RSI, I’m seeing two support zones that the Layer price might return to: $1.18 or $1.09. I’ll short here and wait for the price to move to these two zones before making my next decision.
Best Regards,
SHORT ON EUR/USDEUR/USD has finally given a change of character to the downside and is currently pulling back into a supply area.
The dollar is gaining strength due to Tariffs and looks like it will rise.
I will be selling EUR/USD with a sell limit order looking to catch over 200-300 pips over the next few days.

#AI16ZUSDT remains in a bearish momentum
📉 SHORT BYBIT:AI16ZUSDT.P from $0.1544
⚡️ Stop loss $0.1582
🕒 Timeframe: 1H
✅ Overview BYBIT:AI16ZUSDT.P
➡️ Price continues in a downtrend, breaking key support levels.
➡️ POC: $0.1615 marks a high-volume area where price was rejected, indicating strong selling pressure.
➡️ Resistance at $0.1582 — expect rejection on retest.
➡️ Entry zone: $0.1544, but wait for confirmation before entering!
➡️ Targeting TP1: $0.1510 and TP2: $0.1485 on further downside movement.
📍 Important Note: Watch for confirmation levels before entering! Do not enter too early.
🎯 Take Profit Targets:
💎 TP 1: $0.1510
💎 TP 2: $0.1485
⚡️ Plan:
➡️ Wait for confirmation before entering at $0.1544.
➡️ Stop loss $0.1582 — above resistance.
➡️ Take profits at $0.1510 and $0.1485.
🚀 BYBIT:AI16ZUSDT.P remains in a bearish momentum — follow the plan after confirmation!

USD/JPY - ShortWeekly (Bias Validation)
- Price between EMAs → ❌ Ranging
- Major Swing Point High: 158.880 Low: 146.543
D1 (Daily): Trend Bias
- Price below 200EMA & 50EMA on D1 → ✅ Bearish Bias
- Major Swing Point High: 154.804 Low: 146.543
- ✅ Break of Structure (BoS) + Volume Imbalance
- Price below Weekly VWAP → ✅ Bearish Bias
H4 (4-Hour): Trend Bias
- Price below 200EMA & 50EMA on D1 → ✅ Bearish Bias
- Major Swing Point High: 151.214 Low: 149.684
- ✅ Break of Structure (BoS) + Volume Imbalance
- Price below Weekly VWAP → ✅ Bearish Bias
- High-Probability Entry Zones (H4 OTE)
- H4 OB (OTE)
H1 (1-Hour): Trend Bias
- Swing Point High: 150.953 Low: 149.684
- ✅ Break of Structure (BoS) + Volume Imbalance
- H4 OB → (OTE)
- H1 OB → (OTE)
🔲 Validate with VWAP:
✔ ✅ H1 VWAP must align with H4 OTE before entry
✔ ✅ If price rejects H1 VWAP + OB midpoint, strong trade setup
🔲 Entry Options:
✔ Option 1 (Limit Order Entry):
* Place a limit order at the OB midpoint inside OTE
* Set stop-loss below OB (for longs) / above OB (for shorts)
✔ Option 2 (EMA Confirmation Entry):
* ✅ Enter when 9EMA crosses 21EMA near OTE
* ✅ Must have Volume Imbalance Confirmation
🔲 Final Confirmation:
✔ ✅ High Volume on Structure Break → Confirms strong move
✔ ✅ Low Volume on Pullback → Smart money accumulation

S&P 500 Short Setup – Key Resistance in Focus!🔥 I’m watching this critical resistance zone on the S&P 500 (US500)! A rejection at this level could spark strong bearish momentum. A clear reaction at resistance is key for confirmation.
📍Entry: 5,726.50 USD – just below the key resistance, but only after rejection is confirmed
🎯Targets:
TP1: 5,645.00 USD
TP2: 5,610.00 USD
TP3: 5,585.00 USD
⛔Stop-Loss: 5,768.00 USD
⚡ Patience is crucial, waiting for confirmation reduces risk and boosts accuracy! Would you take this trade? Let me know below! 👇

SHORT ON AUD/NZDAUD/NZD has given a perfect setup for a sell.
I has bearish divergence as well as a rising channel/wedge into a Major Supply Area from the Higher TF.
We have also change structure from Up to Down on the Lower Timeframe.
I will be selling AUD/NZD to the pervious swing low / demand area for about 100 pips. OANDA:AUDNZD

NEULANDLAB short opportunityUpon the breakdown of the trendline NEULANDLAB has immense downside of 42 odd percentage. Next quarter results will be the catalyst, making or breaking the stock. Negative surprise in last two consecutive results declare us participants to beware of the liquidity present below this key level.
Short below daily close of 11,100
Stoploss - 8%
TP - Trail the 50 DMA close above

ADA - Next Trade Setups to WatchADA’s been stuck in this sideways grind for a while, and the volume’s basically ghosting us. So, where’s it at, and where’s the next move? Let’s dig in.
ADA’s sitting at $0.6615 right now, trading below the yearly open at $0.8451 and the range’s sweet spot, the POC, at $0.7325. That tells me it’s leaning a bit bearish, but not exactly screaming panic, more like it’s just chilling in this 57 day range. It tapped the monthly open at $0.6328 recently, bounced a little, but without volume showing up, it’s like nobody’s ready to commit yet.
Key Levels
Resistance Zones (Short Opportunities)
1.) Range POC: $0.7325, this is the most traded price within the 57 day range, acting as a magnet for price. A rejection here could signal a short setup.
2.) Yearly Open ($0.8451): a psychological and structural level that could cap upside if momentum remains weak. Trading below this level keeps the yearly bias bearish. A break above with volume would flip the narrative.
Support Zones (Long Opportunities)
1.) Monthly Open: $0.6328, already saw a little bounce here with that swing failure move, perfect setup for a long trade if you were quick on the draw.
2.) Yearly Open 2024 + 21 Monthly EMA: $0.594 - $0.5928, strong confluence with the prior yearly open and a key moving average. This zone aligns closely with the swing low at $0.5801, forming a robust support cluster between $0.5801 - $0.594.
3.) 21 SMA: $0.53, a deeper support level if the above zone fails. This would indicate a more significant breakdown, but it’s a potential accumulation area for longer-term traders.
Market Structure Analysis
Bearish Bias Above Swing Low: Trading below the yearly open and POC suggests sellers are in control unless price reclaims $0.7325 with conviction.
Range-Bound Behaviour: The 57 day range indicates consolidation. Volume is the missing catalyst, watch for a spike to confirm direction.
Swing Low as Key Pivot: The $0.5801 level is critical. A hold here maintains the range; a break below shifts focus to $0.53 and signals capitulation.
High-Probability Trade Setups
Long Setups
1.) Long Setup #1 at Swing Low ($0.5801 - $0.594 Zone)
Entry Trigger: Look for a swing failure pattern (SFP) where price dips below $0.5801, reclaims it, and shows rejection of lower prices (e.g., a bullish candle with a wick below).
Stop Loss (SL): Place just below the swing low
Take Profit (TP): $0.70 (near-term resistance)
Stretch Target: $0.8451 (yearly open), though this requires stronger momentum.
Confirmation: Higher-than-average volume on the reclaim + bullish price action (e.g., engulfing candle).
2.) Long Setup #2: $0.4735 Sniper Entry
Entry Trigger: If ADA takes a bigger tumble, $0.4735 is your sniper’s nest, think of it as catching the knife with style. Could be a wick that snaps back.
This is a deeper, high-reward play. Price has to fall by a lot from here, but if it hits, the R:R is amazing, and it’s below most traders radar. Patience is the name of the game.
Short Setup
At POC ($0.7325) or Yearly Open ($0.8451)
Strategic Outlook
Current Stance: If not in a trade, the $0.5801 level is the highest-probability long setup due to confluence and R:R. The SFP at $0.6328 today was a missed opportunity, but a deeper pullback sets up an even better entry.
Breakout Watch: A decisive close above $0.7325 (POC) with volume shifts focus to $0.8451. Conversely, a break below $0.5801 targets $0.53.
Patience is Key: Low volume suggests waiting for a clear catalyst (e.g., news, BTC move) to drive ADA out of this range.
Wrapping It Up
The $0.5801 swing low long with SL below and TP at $0.7 - $0.8451 is the standout trade right now—low risk, high reward, and backed by confluence. Monitor volume closely, as it’s the linchpin for any breakout or reversal. If ADA holds this support and volume picks up, the retest of $0.8451 becomes plausible.
If you found this helpful, please leave a like and a comment. Happy trading!

Quick sell on USDJPYUSDJPY is currently reacting off the resistance zone on a 1hr and this might see a bearish continuation off that zone

CADCHF SHORT LIVE TRADE AND BREAKDOWN EXPLANATION 9K PROFITThe CHF/CAD pair tells the trader how many Canadian Dollar (the quote currency) are needed to purchase one Franc Swiss (the base currency). These two economies are quite intensely linked because Canada is an important producer of gold while Switzerland is a great importer of that same commodity - a quart part of the overall commodities imported by Switzerland is gold and there is a solid tradition of gold refineries/gold mining companies in the country. Switzerland can be considered as a stable and safe country. The same accounts for its currency, the Swiss Franc (CHF). The currency is often referred to as the “safe-haven” currency, as it is a backup for investors during times of geopolitical tensions or uncertainty: it is expected to increase its value against other currencies in times of volatility.

SHORT ON ES?This could be a short rade idea for swing trade.
Las week price invalidate long ideas and the structure remain bearish.
Depending on how we open on Sunday, and with NFP week ahead, I would see ha Monday price will dive quick again, or retrace a little and offer short second half of he week.

TIA: 40% Crash in Sight – What's Next?TIA recently lost its strong $4 support, and that level is now acting as resistance. For the past two months, the price hasn’t been able to climb back above $4, leaving us with one burning question: Is more blood on the table?
Broken Support: TIA has given up its $4 support, which now serves as resistance.
Looking at November 2024: The low from November 2024 was around $1.9. Revisiting that level could provide us with a high-probability long trade.
Trade Setup Opportunity
Entry Point: Set an alarm for the $1.9 low. A successful bounce here would signal a potential long trade opportunity.
Target & Reward: With the goal of targeting the $3 level, this trade could offer a risk-to-reward ratio of at least 5:1.
Implication: If the $1.9 level is revisited and holds, we could be looking at a scenario with roughly 40% more downside in the current trend—but also a setup for a low-risk long if the bounce holds.

SUI Swing: The Art of Patience in TradingSUI has been playing nice with the technicals lately, giving us some really neat swing trade opportunities. Remember that short trade we talked about—from $3 down to around $2? Well, here's why that setup was a winner.
After that initial short trade, SUI bounced off $2 and then traded in a tight range between $2.5 and $2.2 for about two weeks. Then it broke higher to test the monthly open at $2.83—and it hit that level right on the dot. That’s where all the magic happens.
Why This Short Trade Worked
Fibonacci Confluence: When you draw a Fibonacci from the high at $3 to the low at $1.9626, the 0.786 level comes in at about $2.778. This is right near the monthly open, and we know that price tends to reverse between the 0.618 and 0.786 zones.
Trading Range POC: The $2.8 area was our previous point of control, so it adds extra weight as a resistance level.
Anchored VWAP: The VWAP from the high at $3.8999 sits just above the monthly open at around $2.855, giving us another nod that this level is important.
Fib Speed Resistance Fan: Even the speed resistance fan at the 0.618 level lines up with the $2.8 zone.
All these factors lined up to form a solid resistance area. That’s why short entries between $2.778 and $2.855 made sense.
Trade Setup Recap
Short Trade:
Entry Zone: $2.778 to $2.855
Target: The bullish order block at about $2.4745, which also lines up with the 0.618 fib retracement from the low at $2.2358 and the high at $2.8309
Risk-to-Reward: This setup gave us a risk-to-reward of 4:1 or even better, depending on where you set your stop-loss.
There’s also a possible long trade at the bullish order block, but that one’s only for when you see the confirmation.
Wrapping It Up
The takeaway? Confluence is your best friend. Waiting for that high-probability setup can really pay off. Let the trade come to you, don’t force it, and stay calm and focused.
Thanks for reading this SUI analysis. If you liked it, please leave a like and drop a comment. Happy trading!

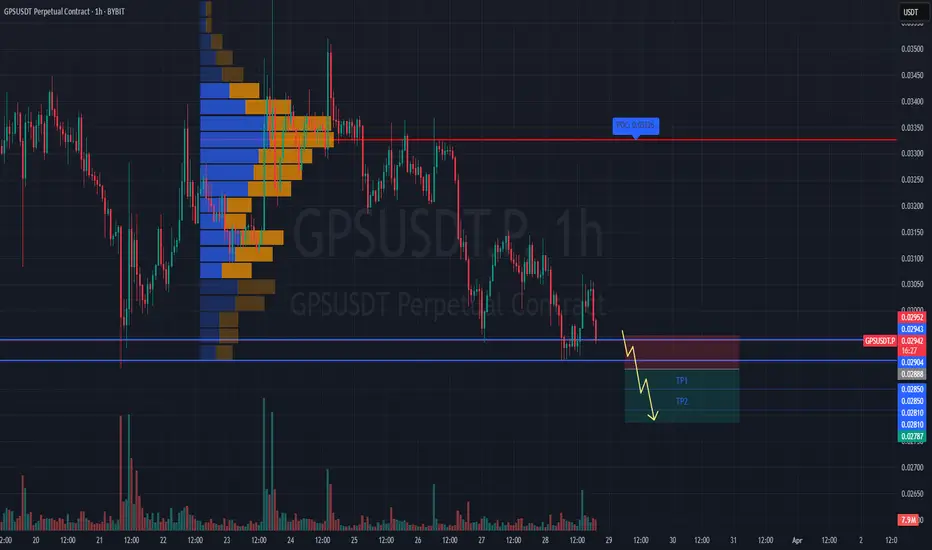
#GPSUSDT is forming a bearish structure📉 Short BYBIT:GPSUSDT.P from $0.02888
🛡 Stop loss $0.02952
🕒 1H Timeframe
⚡️ Overview:
➡️ The main POC (Point of Control) is at 0.03326, marking the highest volume zone and a major resistance above the current price.
➡️ The 0.02952 level acts as local resistance and an ideal stop placement.
➡️ Price BYBIT:GPSUSDT.P has already tested the $0.02888 support — a confirmed breakdown could trigger stronger downward momentum.
➡️ Volume is increasing on the decline, supporting the sellers' pressure.
🎯 TP Targets:
💎 TP 1: $0.02850
💎 TP 2: $0.02810
💎 TP 3: $0.02787
📢 Watch for a clean break of the $0.02888 level — it could be the entry trigger for this short setup.
📢 If price pulls back above $0.02952, the short scenario becomes invalid.
BYBIT:GPSUSDT.P is forming a bearish structure — continuation to the downside is expected if support fails.
eurjpy bearish moveit seems to be a similar movement n most of JPY pairs
a possible bearish movement on eurjpy on a daily timeframe

A Gold'en Newtonian Sell-Off Porjected By MedianlinesSir Isaac Newton stated the Third Law of Motion in his landmark work, Philosophiæ Naturalis Principia Mathematica (commonly called the Principia), which was first published in 1687. This law appears in Book I, in the section titled Axioms, or Laws of Motion.
(Axiom: A self-evident truth)
Newton did explicitly present it as an axiom. In fact, it's Axiom III (or Law III) of his three fundamental laws of motion. Here's how he phrased it in the original Latin and in his own English translation:
"To every action there is always opposed an equal reaction: or the mutual actions of two bodies upon each other are always equal, and directed to contrary parts."
And what does this have to do with Medianlines / pitchforks?
This tool measures exactly that: the action — and the potential reaction!
Medianline traders know that pitchforks project the most probable direction that a market will follow. And that direction is based on the previous action, which triggered a reaction and thus initiated the path the market has taken so far.
…a little reciprocal, isn’t it? ;-)
So how does this fit into the chart?
The white pitchfork shows the most probable direction. It also outlines the extreme zones — the upper and lower median lines — and in the middle, the centerline, the equilibrium.
We see an “undershoot,” meaning a slightly exaggerated sell-off in relation to the lower extreme (the lower median line). And now, as of today, we’re seeing this overreaction mirrored exactly at the upper median line!
Question:
What happened after the lower “overshoot”?
New Question:
What do you think will happen now, after the market has overshot the upper median line?
100% guaranteed?
Nope!
But the probability is extremely high!
And that’s all we have when it comes to “predicting” in trading — probabilities.
Why? Because we can’t see the future, can we?
Gold?
Short!
Looking forward to constructive comments and input from you all

$ZRO @LayerZero_Core Long & Short TradesCSE:ZRO @LayerZero_Core Long & Short Trades
#1 Long from TRP Blue Zone frontrun ☹️
#2 Long from Twin OB retest TP2 Hit ✅
#3 Short entry only if VAL is lost ⌛️
SHORT ENTRY = only if VAL is lost
SL = above old POC & Daily Open
------------
------------
As always, my play is:
✅ 50% out at TP1
✅ Move SL to entry
✅ Pre-set the rest of the position across remaining TPs
It's important to take profits along the way and not turn a winning trade into a losing trade.

SHORT ON US30US30 Has given a change of character (choc) on the 4hr TF indicating the end of its uptrend pullback on its overall downtrend.
I will be selling US30 to the next level of demand looking to capture over 1000 points.

continue downtrend , GOLD⭐️GOLDEN INFORMATION:
Gold price (XAU/USD) holds steady above the key $3,000 level for the second consecutive day on Wednesday, though it struggles to reclaim the previous session’s peak. Ongoing uncertainty surrounding US President Donald Trump’s proposed reciprocal tariffs set for next week continues to bolster demand for the safe-haven metal. At the same time, the US Dollar (USD) remains under pressure following Tuesday’s weaker-than-expected macroeconomic data, providing additional support for gold’s upward momentum.
⭐️Personal comments NOVA:
Gold price continues to decrease, around 2990 - 3000
⭐️SET UP GOLD PRICE:
🔥SELL GOLD zone: $3039 - $3041 SL $3046
TP1: $3030
TP2: $3020
TP3: $3010
🔥BUY GOLD zone: $2992 - $2990 SL $2985
TP1: $3000
TP2: $3008
TP3: $3018
⭐️Technical analysis:
Based on technical indicators EMA 34, EMA89 and support resistance areas to set up a reasonable SELL order.
⭐️NOTE:
Note: Nova wishes traders to manage their capital well
- take the number of lots that match your capital
- Takeprofit equal to 4-6% of capital account
- Stoplose equal to 2-3% of capital account
#ARCUSDT is showing signs of reversal📉 Short BYBIT:ARCUSDT.P from $0.06780
🛡 Stop loss $0.07117
🕒 1H Timeframe
⚡️ Overview:
➡️ The main POC (Point of Control) is at 0.05873, indicating the area with the highest trading volume.
➡️ The 0.07117 level acts as strong resistance where the price previously reversed.
➡️ The chart shows a potential topping structure followed by a decline.
➡️ Volume concentration between $0.065 and $0.06210 suggests key zones for potential profit-taking.
🎯 TP Targets:
💎 TP 1: $0.06510
💎 TP 2: $0.06210
💎 TP 3: $0.06050
📢 Watch the key levels and enter after confirmation!
📢 The price has already started to move down — downside momentum remains strong.
📢 The TP levels are near a previous consolidation zone, allowing quick target execution.
BYBIT:ARCUSDT.P is showing signs of reversal — considering shorts with clear downside targets!

BTCUSD 1H | POI Reaction Setup After Sweep – Short Flow by CelesBTC tapped into a clean POI zone after sweeping highs.
A market structure shift (MSS) formed, showing early signs of bearish intent.
Price is now reacting from the zone, and we’ve mapped the clean flow toward the 2H demand base.
Invalidation is clearly marked — a clean break above 88,005 would flip the bias.
Precise POI, projection, and target laid out.
— CelestiaPips

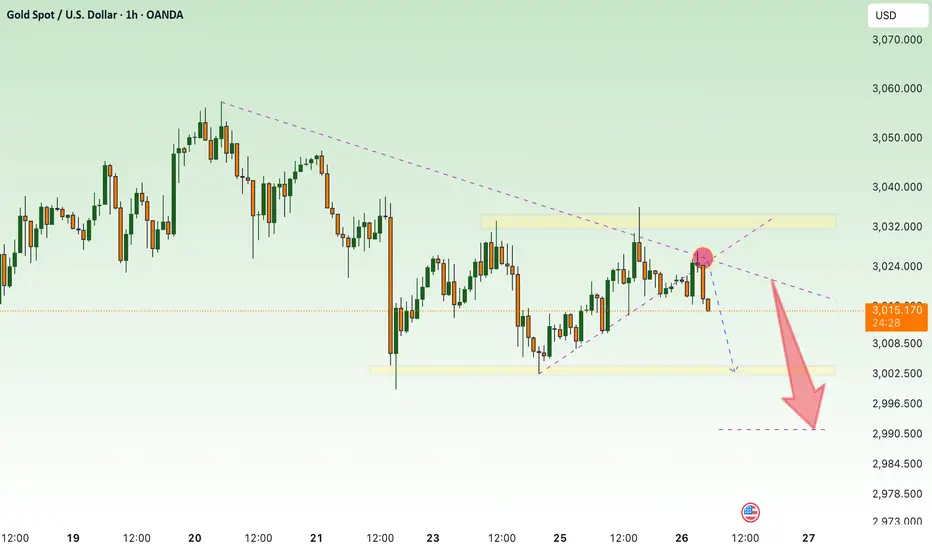
Gold declines, accumulate and wait for April news⭐️GOLDEN INFORMATION:
Gold price (XAU/USD) continues its pullback, slipping toward $3,025 in early Asian trading on Monday. The metal retreats from Thursday’s record high, driven by renewed optimism over a potential Ukraine peace deal. However, expectations of Federal Reserve (Fed) rate cuts and lingering economic uncertainties could provide support, limiting further downside for the yellow metal.
⭐️Personal comments NOVA:
Gold is under pressure to sell and take profits in the short term. There is still a lot of liquidity in the 3000 price zone. The price will continue to accumulate around $3000.
⭐️SET UP GOLD PRICE:
🔥SELL GOLD zone: $3031 - $3033 SL $3038
TP1: $3020
TP2: $3010
TP3: $3000
🔥BUY GOLD zone: $2991 - $2993 SL $2986
TP1: $3000
TP2: $3008
TP3: $3017
⭐️Technical analysis:
Based on technical indicators EMA 34, EMA89 and support resistance areas to set up a reasonable SELL order.
⭐️NOTE:
Note: Nova wishes traders to manage their capital well
- take the number of lots that match your capital
- Takeprofit equal to 4-6% of capital account
- Stoplose equal to 2-3% of capital account
