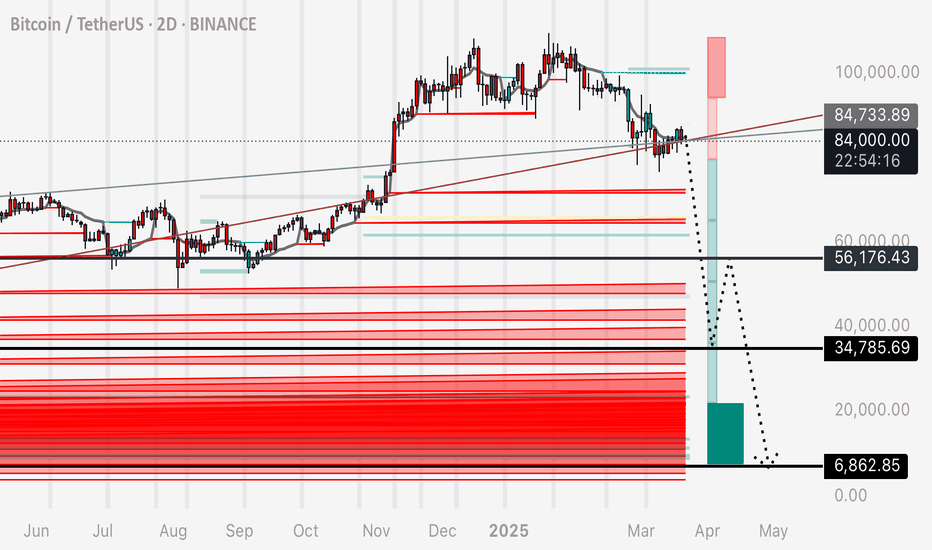
BTC - ABC Correction to Absorb Long Liquidity Further to my previous recent post, I wanted to highlight two indicators that accurately present us with liquidity on the BTC chart.
Connecting the pieces of the puzzle of this prediction - this ABC correction pattern allows the market to absorb the Long position liquidity left in tact on the chart.
Since these long positions leave a trail of leveraged sell orders (stop losses) - we should expect a mass chain reaction of these orders setting off one into the next, with increasing speed and momentum of the drop.
We do not need a black swan event for this to occur. The orders are already in the chart to allow it to happen, as an adverse consequence to open interest and open traders positions during the last 2 years.
There is many confluences to support this correction pattern, if interested in learning more, see my previous posts on Trading View.
Enjoy!
Shortsetup
Reminder - Bitcoin back below these trendlinesI encourage you guys to draw these trendlines on your chart and experiment by doing some exercises.
1. Draw the main two trendlines.
2. Spend time on each by duplicating it, keeping the angle the same, and moving it to different spots on the chart. Notice how Bitcoin works on this ascending diagonal support resistance structure. You’ll find that the correct trendline can be duplicated infinitely and the price respects it at any point you place it.
3. Notice that price consolidates on these ascending lines. We see breaks above or below depending on the stop losses from futures positions and liquidity that’s collected. In other words, a break above doesn’t invalidate it.
4. Notice that Bitcoin moves above and below these trendlines.
5. It’s in my opinion that THIS is the structure that explains why Bitcoin isn’t moving higher, telling me the market wants to keep price below these trendlines and take back the liquidity in these zones (look at my previous posts for liquidity maps)
Personally this is still my trade.
God bless and may you live to trade another day!
Gold price start to adjust yet?⭐️GOLDEN INFORMATION:
Gold prices (XAU/USD) face renewed selling pressure during the Asian session on Friday, retreating toward the $3,030 level in recent trading, inching closer to the previous session’s low. The US Dollar (USD) maintains its upward trajectory for the third consecutive day, prompting some profit-taking on the precious metal ahead of the weekend. However, a confluence of supportive factors is likely to keep bullion resilient, positioning it for a third consecutive week of gains.
⭐️Personal comments NOVA:
Breaking the trend, has gold price really been in the weekend price adjustment rhythm? According to NOVA, it has started. Before the tax policies in early April, the market needs a little balance in terms of liquidity on the selling side.
⭐️SET UP GOLD PRICE:
🔥SELL GOLD zone: $3040 - $3042 SL $3047
TP1: $3030
TP2: $3020
TP3: $3010
🔥BUY GOLD zone: $3019 - $3017 SL $3014 scalping
TP1: $3023
TP2: $3030
TP3: $3040
🔥BUY GOLD zone: $3000 - $3002 SL $2995
TP1: $3010
TP2: $3020
TP3: $3030
⭐️Technical analysis:
Based on technical indicators EMA 34, EMA89 and support resistance areas to set up a reasonable SELL order.
⭐️NOTE:
Note: Nova wishes traders to manage their capital well
- take the number of lots that match your capital
- Takeprofit equal to 4-6% of capital account
- Stoplose equal to 2-3% of capital account
Auction - bearish divergence!Dear My Friends,
The Auction is making a very strong impression on me, as it is going against the current market trend. So, I decided to observe Auction’s chart across different timeframes. On the monthly timeframe, it didn’t give me a clear perspective, as the indicators provided conflicting conclusions.
I then switched to a smaller timeframe, the weekly chart. And everything became very clear here: a bearish divergence is very evident, and the indicators are all in agreement. As you can see, the price is still rising sharply. However, the trading volume is decreasing. The RSI indicator also shows a divergence compared to the price index.
The RSI is currently above 80. Therefore, I will place a Short order and take profits at three price levels as shown on the chart.
I hope my analysis will support my friends. Please manage your risks carefully before entering any trades.
Best Regards,
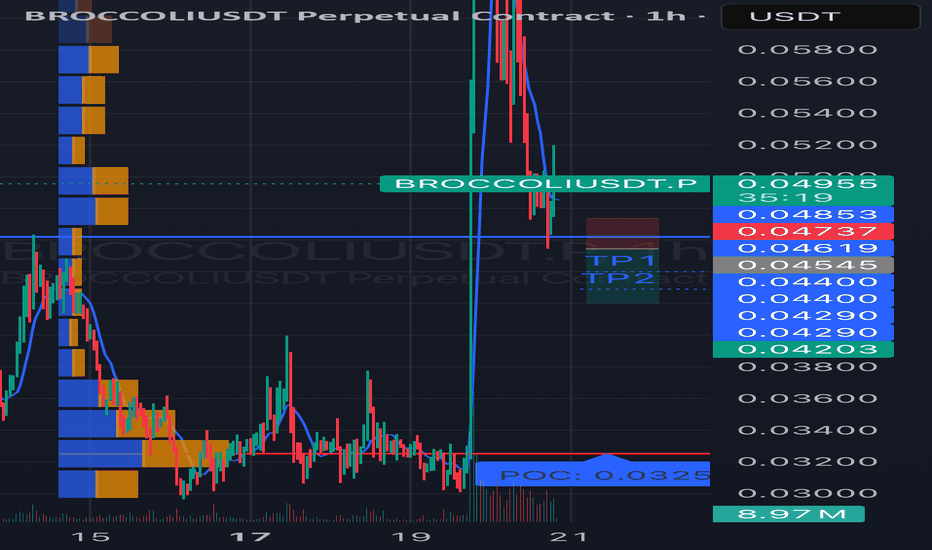
#BROCCOLIUSDT is showing bearish potential SHORT BYBIT:BROCCOLIUSDT.P from $0.04545
🛡 Stop Loss: $0.04737
🕒 Timeframe: 1H
⚡️ Overview:
➡️ BYBIT:BROCCOLIUSDT.P is showing bearish momentum on the 1-hour timeframe after a significant drop from $0.06000 to the current consolidation zone of $0.4203–$0.4885.
➡️ The price recently tested the $0.04545 level (a possible retest of a broken support, now acting as resistance), which could serve as an entry point for a short.
➡️ The volume profile on the left shows strong buyer interest at $0.0325 (POC), which acts as a key support level. However, the lack of significant buying volume at current levels suggests potential for further downside.
➡️ The price structure remains bearish: lower highs and lows are forming after the drop.
➡️ The RSI (14) indicator on the 1H timeframe is presumably around 45 (based on price action), indicating neutral momentum with room for a downward move.
🎯 Take Profit Targets:
💎 TP 1: $0.04400
💎 TP 2: $0.04290
💎 TP 3: $0.04203
⚡️Plan:
➡️ Entry: Sell below $0.04545 after the 1-hour candle closes below this level to confirm the rejection from resistance.
➡️ Stop Loss: Set at $0.04737, which provides a 7% risk from the entry point and protects against a potential breakout.
➡️ Risk/Reward Ratio: From 1:2 (for TP1) to 1:5 (for TP3), making this trade attractive from a risk management perspective.
➡️ After the drop, the price has stabilized, indicating possible consolidation or accumulation.
➡️ Resistance zone: $0.04885 (upper boundary of the current range).
Technical Indicators:
➡️ The chart shows candles in red and green, reflecting bearish and bullish movements.
➡️ After the sharp decline, the price has formed lower highs and lows, but in recent hours, there’s an attempt at recovery.
📢 A price rejection below $0.04545 with increasing selling volume increases the likelihood of reaching the targets.
📢 The $0.04400 and $0.04290 levels may act as areas for partial profit-taking, so monitor price action in these zones.
📢 Risks: If the price breaks above $0.04885, it could signal a false breakdown and a potential reversal to the upside. In this case, consider reassessing the position.
📊 The decline in BYBIT:BROCCOLIUSDT.P aligns with cautious sentiment in the crypto market.
📊 As of March 20, 2025, BYBIT:BTCUSDT.P is trading around $90,000, showing signs of consolidation, which may pressure altcoins like BYBIT:BROCCOLIUSDT.P
BYBIT:BROCCOLIUSDT.P is showing bearish potential on the 1H timeframe.
⚡️A confirmed rejection below $0.04545 is your signal to act!
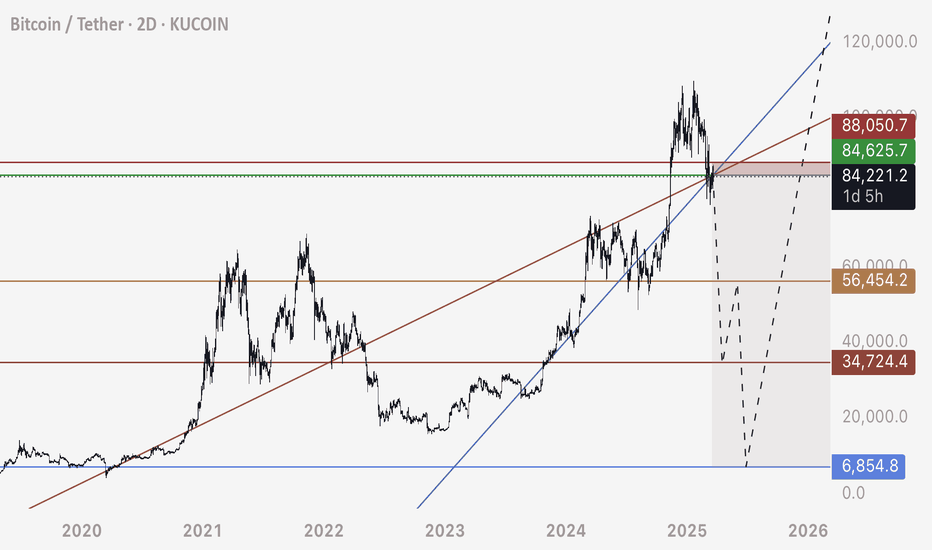
BTC FOMC FLASH CRASH / LIQUIDATION IDEAThe FOMC data this week could be a conduit that sticks the price to play down these two trend lines.
We can see the mass liquidity on the chart in these low zones.
Bitcoins consistent rise since late 2022 has been leaving a train of long stop loss orders (leveraged sell orders) underneath - think of the mechanics of “why it’s possible” as a massive chain reaction of stop losses getting fired off and creating mania and hysteria for further fear based selling.
If we see drops to these low zones, I’m presenting the TA evidence of it so that we know it’s not the bottom - but a liquidation move.
The worst thing people could do is sell at massive losses thinking BTC is going to zero.
I see this move occurring and following that over the next years, a BTC pushing upwards of those $140-$200k zones.
The market is interested in reclaiming this liquidity - we are awaiting the conduit or event to justify it.
This is my personal trading plan.
Happy trading to all and be safe out there.
#AVLUSDT continues its downtrend 📉 Short BYBIT:AVLUSDT.P from $0,4060
🛡 Stop loss $0,4136
🕒 1H Timeframe
⚡️ Overview:
➡️ The main POC (Point of Control) is 0,4201
🎯 TP Targets:
💎 TP 1: $0,4015
💎 TP 2: $0,3975
💎 TP 3: $0,3945
📢 Monitor key levels before entering the trade!
BYBIT:AVLUSDT.P continues its downtrend — watching for further movement!
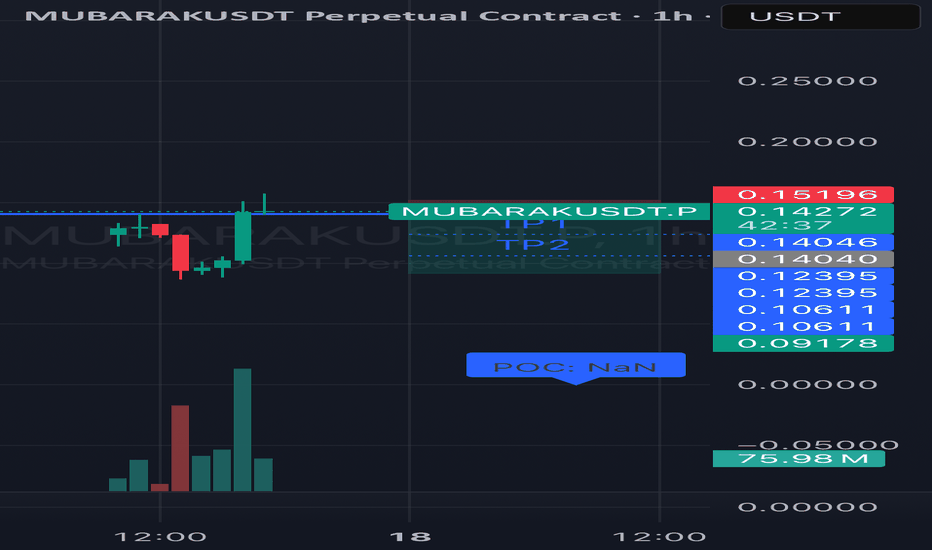
#MUBARAKUSDT continues its downtrend📉 Short BYBIT:MUBARAKUSDT.P from $0,14040
🛡 Stop loss $0,15196
🕒 1H Timeframe
⚡️ Overview:
➡️ The main POC (Point of Control) is Nan
🎯 TP Targets:
💎 TP 1: $0,12395
💎 TP 2: $0,10611
💎 TP 3: $0,09178
📢 Monitor key levels before entering the trade!
BYBIT:MUBARAKUSDT.P continues its downtrend — watching for further movement!
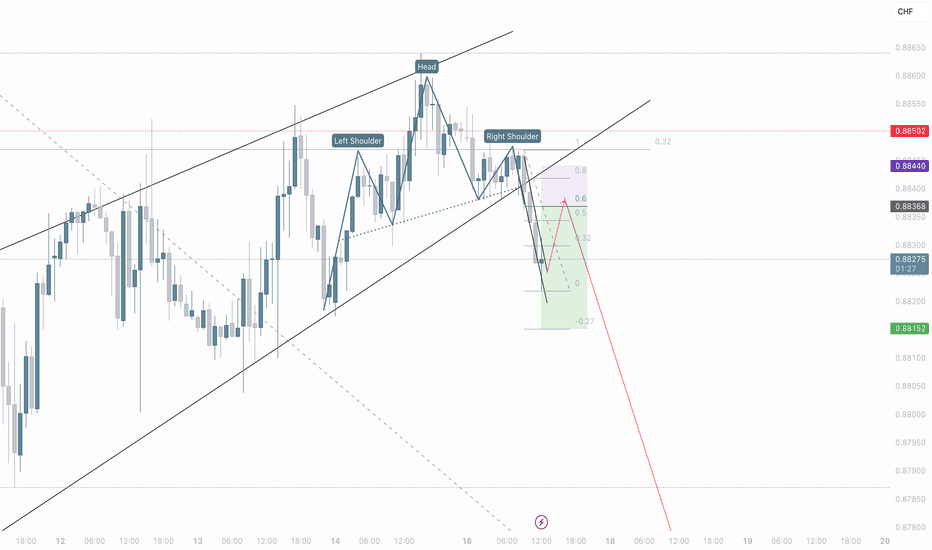
USD/CHF: Selling the Head & Shoulders BreakdownSpotted a clear H&S pattern on USD/CHF 15m chart!
Selling at 0.8826 with stop above 0.8844.
Target: First 0.8815, then possibly lower to the -0.27 Fib level.
The neckline break looks solid and we're still in the channel. Risk-reward looks good here.
What do you think? Are you bearish on USD/CHF too?
#USDCHF #Forex #TradingIdea
Bitcoin’s Battlefield: Support, Resistance and Trade SetupsBitcoin’s price has been showing signs of a sustained downtrend after forming a double top pattern. The recent action, combined with low volume and failure to breach key resistance zones, points to a likely retest of lower levels. Over the weekend, the price couldn’t break past the 85K resistance, and the low trading volume around this level suggests that buyer interest is waning.
6H TF Chart:
Big Picture vs. Short-Term Action
On a higher timeframe (6H), my indicator neatly outlines the bear market of 2022 and the bull market that started in early 2023—when the “cloud” turned green, signaling a shift in momentum. The cloud's lower boundary is currently at $73,364, which is key. Imo, holding above 70K is critical for keeping that bullish vibe alive.
1H TF Chart:
Switching over to the 1H chart, the picture shows a bearish structure. The upper resistance around 95K (which aligns with the yearly open near $93,455.85) is proving a solid resistance. The anchored VWAP from the all-time high also sits right at this level, adding more weight to the resistance. Bulls need to clear this yearly open to signal a true recovery.
Key Levels & Confluence Zones
1.) Upper Resistance – 93K to 95K:
The 95K zone aligns closely with the yearly open ($93,455.85) and the anchored VWAP from the all-time high, both acting as resistance.
Daily moving averages (62 EMA at ~$91,316 and 62 SMA at ~$94,900) provide further confluence.
Additional resistance between 85K-86K.
2.) Critical Support – 73K to 70K Zone:
The lower edge of the cloud on the 6H timeframe sits around 73K.
The 0.382 Fibonacci retracement (from the low at $15,473.78 to the all-time high at $109,354) is at $73,492, while the 0.618 retracement (from $49,217 to the all-time high) is around $72,205.
Moving Averages on Weekly Chart: The weekly 62 EMA ($72,919) and 62 SMA ($71,590) align well with this support region.
Additional Support: A bullish monthly order block at $71,320 adds another layer of confluence.
Psychological Importance: A hold above 70K is critical to maintaining bullish momentum.
3.) Monthly Open – $83,385.74:
This level serves as a pivot: price is currently hovering below it. A reclaim by bulls would be a positive sign for higher price action, while a rejection reinforces the bearish setup.
Trade Setups
Long Trade Setup:
Entry: Consider laddering in between 75K and 70K as the price retests support.
Take Profit: Aim for the monthly open (~84K) initially, and if support holds and flips, a move toward 90K could be considered.
Stop Loss: Set below 70K to protect against a further downturn.
Short Trade Setup:
Entry: A short setup can start at the monthly open, using a laddering approach between 84K and about 86.9K.
Take Profit: Target the previous low or 74K.
Stop Loss: Place just above 87K to keep risk in check.
Thank you for taking the time to read through this technical analysis. I hope it provides valuable insights for your trading decisions. Happy trading!
USDJPY Setup: SHORT on 200 EMA Rejection📉 Best Risk/Reward Setup: SHORT on 200 EMA Rejection
🔻 Entry: Sell in the 148.50 - 148.80 zone after rejecting the 200 EMA (⚪)
🎯 Take-Profit (TP1): 146.50 (RRR: 5:1)
🎯 Take-Profit (TP2): 145.00 (RRR: 9:1)
🛑 Stop-Loss (SL): 149.20
📊 Market Overview & Bias
🟥 Bearish Outlook (Macro Trend - Daily & 4H)
✅ USD/JPY remains in a clear downtrend, trading below the 200 EMA (⚪).
✅ Price has consistently rejected the 100 EMA (🟡) as resistance.
✅ Lower highs and lower lows are forming on the daily & 4H charts.
✅ If 146.50 breaks, next downside targets are 145.00 and 143.50.
🟩 Short-Term Bullish Retracement (1H & 30M)
🔹 USD/JPY has found temporary support at 146.50.
🔹 RSI shows bullish divergence, suggesting a possible short-term bounce.
🔹 If price breaks 148.00, we could see a move toward 149.00 – but this remains a counter-trend move within a larger downtrend.
📉 Why This Trade?
🔻 Major resistance at the 200 EMA (⚪) and previous swing highs.
🔻 The macro trend is bearish, so selling rallies is safer than counter-trend longs.
🔻 RSI may enter the overbought zone, signaling a sell opportunity.
🔻 If price struggles at 148.50, expect another bearish impulse.
⚠️ Trading carries a high level of risk, and past performance is not indicative of future results. Always manage your risk carefully and never trade with money you cannot afford to lose. This is for educational purposes only and not financial advice.
💬 Do you think USD/JPY will respect the 200 EMA or break through? Drop your thoughts below! 👇🔥
XAUUSD - Short Trade after Resistance Test ($3,005 - $3,010)Short after Resistance Test ($3,005 - $3,010)
📌 Entry: Sell within the $3,005 - $3,010 range if there is a clear rejection and price weakness.
🎯 Take-Profit 1: $2,985 (immediate support)
🎯 Take-Profit 2: $2,970 (recent lows)
🛑 Stop-Loss: $3,015 (above resistance)
🔹 Probability: High – Confirmed by weak volume on rallies and strong resistance.
Trade Rationale:
Key Resistance Zone ($3,005 - $3,010): This level has historically acted as a supply zone, where sellers step in to push prices lower. If price action shows rejection (e.g., wicks or bearish engulfing candles), it confirms a high-probability short setup.
Weak Volume on Rallies: Volume analysis suggests that bullish momentum lacks strong participation. A rising price with decreasing volume often signals an exhaustion of buyers, increasing the probability of a reversal.
Technical Indicators Align:
RSI (Relative Strength Index): Overbought or showing bearish divergence, signaling potential downside pressure.
MACD (Moving Average Convergence Divergence): Losing bullish momentum or forming a bearish crossover, indicating potential for a pullback.
Donchian Trend & Moving Averages : Price is testing upper Donchian bands and key moving averages are suggesting overextension.
Risk-Reward Ratio:
> The stop-loss at $3,015 ensures protection against false breakouts.
> The first take-profit ($2,985) targets the nearest support, locking in quick profits.
> The second take-profit ($2,970) aligns with recent swing lows, maximizing the downside potential.
Final RRR (TP2) is 1 : 3,4
Conclusion:
A rejection from the $3,005 - $3,010 resistance zone presents a solid short opportunity, backed by weak bullish momentum, technical confluence, and favorable risk-reward. If the price fails to break higher and shows signs of rejection, this trade setup has a strong probability of success.
⚠️ Final Warning: Trading involves significant risk, and past performance does not guarantee future results. Always use proper risk management and never trade with money you can't afford to lose. This analysis is for educational purposes only and not financial advice.
What do you think about this setup? Would you take this trade? Drop your thoughts in the comments! 👇
#REDUSDT continues its downtrend📉 Short BYBIT:REDUSDT.P from $0,7814
🛡 Stop loss $0,8061
🕒 1H Timeframe
⚡️ Overview:
➡️ The main POC (Point of Control) is 0,5802
🎯 TP Targets:
💎 TP 1: $0,7600
💎 TP 2: $0,7330
💎 TP 3: $0,7112
📢 Monitor key levels before entering the trade!
BYBIT:REDUSDT.P continues its downtrend — watching for further movement!
SOL Trading Plan: Stacking Entries Like a ProSolana (SOL) has been in a slow uptrend over the past five days, after hitting the low at $112. The current price action looks like an ABC corrective pattern, which could mean we’re setting up for lower prices.
To get the best trade execution, we'll use a laddered entry approach, meaning we’ll scale into positions gradually instead of going all in at once. This helps us get a better average entry price while managing risk effectively. By placing orders at key levels, we increase our chances of catching the right move without overcommitting too early.
Resistance Zone ($136 - $143.80)
A major resistance zone has formed between $136 - $143.80, where price is likely to struggle. This area contains multiple technical confluences that suggest a potential reversal or strong reaction:
$136 – 0.618 Fibonacci Retracement
$140.09 – 1:1 Trend-Based Fibonacci Extension
$141.40 – Anchored VWAP from the $179.85 swing high
$143.80 – Point of Control (POC) from the 19-day Fixed Range Volume Profile
This makes $136 - $143.80 a prime area to consider short positions, especially if price starts showing weakness.
Support Zone ($102.1 - $98.50)
On the downside, a major demand zone is forming between $102.1 - $98.50, where buyers are likely to step in aggressively. This zone has multiple technical confluences, making it a high-probability long entry area:
$102.1 – 2024 Yearly Open & Monthly Support
$100 – Bullish Monthly Order Block & Anchored VWAP Support
$98.50 – Final key demand zone
This zone presents a solid long opportunity, allowing for gradual scaling into positions as price moves deeper into support.
Short Trade Setup – Laddered Entry Approach
Instead of entering all at once, we’ll ladder into the short position gradually, starting small and increasing size as price moves deeper into resistance.
Short Entry Levels & Position Sizing
Trade Details
Average Entry Price: $140.12
Take Profit Target: slightly above $102.10 (Monthly Level)
Stop Loss: slightly above $146.70 (Above POC)
Risk-Reward Ratio (R:R): ~6:1
Long Trade Setup – Laddered Entry Approach
For the long setup, we start with small entries at higher prices and increase size as price moves deeper into support, ensuring a better average entry in a key demand zone.
Long Entry Levels & Position Sizing
Trade Details
Average Entry Price: $102.72
Take Profit Target: slightly below $120.00
Stop Loss: slightly below $95.00
Risk-Reward Ratio (R:R): ~2.45:1
Market Outlook
Short Bias: Until price reclaims $143.80, this remains a strong resistance zone for potential short trades.
Short Setup: Laddering into resistance ensures better risk management and higher average entry efficiency.
Long Setup: Starting small at $112 and increasing position size down to $98.50 ensures strong positioning in a high-confluence demand zone.
By scaling into trades rather than committing at a single price, we increase flexibility, improve trade execution, and adapt better to price movements. 🚀
Weekly Timeframe - 200 EMA Support
$100 coincides with the 200 EMA on the weekly timeframe, adding confluence to this area as strong support.
If Solana decisively breaks above $144, it would invalidate the short thesis and suggest a potential move higher toward $150. Conversely, a strong rejection from the resistance zone would likely accelerate the move toward $112 to test demand at swing low.
#OIKUSDT continues its downtrend📉 Short BITGET:OIKUSDT.P from $0,0870
🛡 Stop loss $0,0909
🕒 1H Timeframe
⚡️ Overview:
➡️ The main POC (Point of Control) is N
🎯 TP Targets:
💎 TP 1: $0,0833
💎 TP 2: $0,0795
💎 TP 3: $0,0769
📢 Monitor key levels before entering the trade!
BITGET:OIKUSDT.P continues its downtrend — watching for further movement!
How to continue to short (2)As in my last analysis, currently XAUUSDXAUUSD is about to hit that 2945-2948
Operation policy reference:
Short Position Strategy
1:XAUUSD sell@2945-2948 20%Transaction of funds , tp:2930-2920-2910
2:XAUUSD Buy@2910-2915 20%Transaction of funds , tp:2930-2945-2955
The Signals have timeliness , if you also need to get accurate signals every day,follow the link below to get my daily strategy updates
If your account is still in the red, you need to pay attention to whether the resistance is valid. If the resistance is valid, there may be a decline. You can close your order on the decline and trade in the right direction again
How to continue to short
After experiencing intraday volatility, XAUUSD rebounded from the bottom after the release of the Consumer Price Index (CPI) data in the evening. The price dropped to the 0.382 support level of the upward retracement at the lowest.
In terms of this retracement, the range is relatively small, which fully demonstrates that the bulls remain strong. The price level of 2930 has withstood market tests for many times, and there is a high probability of a subsequent breakout. Therefore, the main trading strategy should focus on going long and anticipating a breakout. Calculated based on the magnitude of the previous upward trend, the price of XAUUSD is expected to rise to 2940/2960.
Operation policy reference:
Short Position Strategy
1:XAUUSD sell@2945-2948 20%Transaction of funds , tp:2930-2920-2910
2:XAUUSD Buy@2910-2915 20%Transaction of funds , tp:2930-2945-2955
The Signals have timeliness , if you also need to get accurate signals every day,follow the link below to get my daily strategy updates
If your account is still in the red, you need to pay attention to whether the resistance is valid. If the resistance is valid, there may be a decline. You can close your order on the decline and trade in the right direction again
