Shortsetup

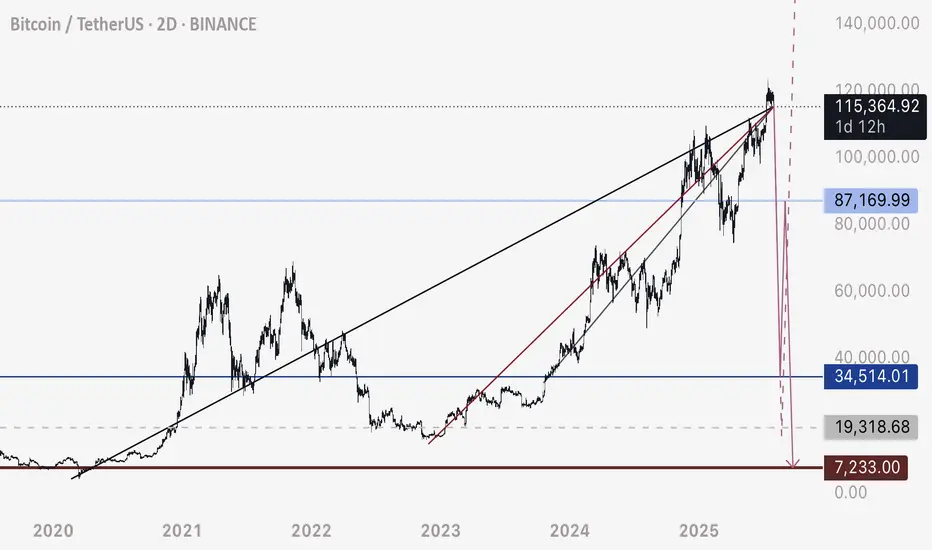
BTC - About to TankBitcoin is holding below these bearish trendlines pointed out on previous posts.
Here we can see liquidation levels on the HTF.
I see two potential moves:
Scenario A)
115,000 to 17,000-20,000 range
Scenario B)
3 Wave Corrective Pattern
115,000 to 35,000
35,000 to 83,000
83,000 to 8,000-10,000
DXY is retesting a major bearish breakdown on the weekly / monthly time frame. This is why we have been seeing the recent drop, and preparation for a mass liquidation / flash crash.
The above stated is my own personal views and is not intended as financial advice. Please trade responsibly.

NZDJPY Bearish Setup in Play!
Pattern confirmed – selling pressure expected. Enter at current price for momentum trade or wait for retracement for a higher-probability entry.
🎯 Risk–Reward management is key – keep stops tight and targets realistic!"

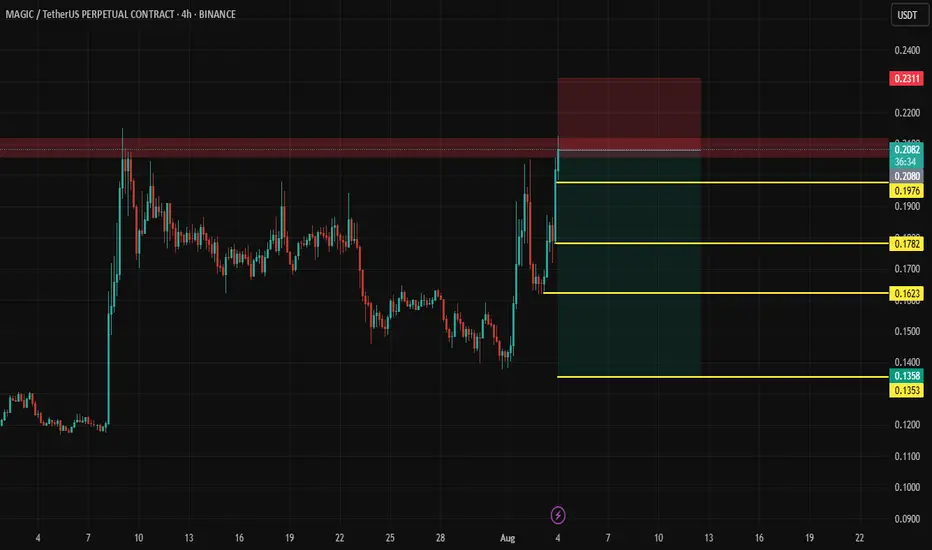
magic short Long upper wicks (like inverted hammers or shooting stars)
Multiple candles failing to close above $0.21–0.215
Bearish volume spike with price stalling = aggressive sellers
Low volume stall = buyers exhausted
Dropping from above 70
Bearish divergence vs price
You can consider a short with a tight stop just above $0.215–0.22
Targets: $0.1980 → $0.1880 → $0.1780
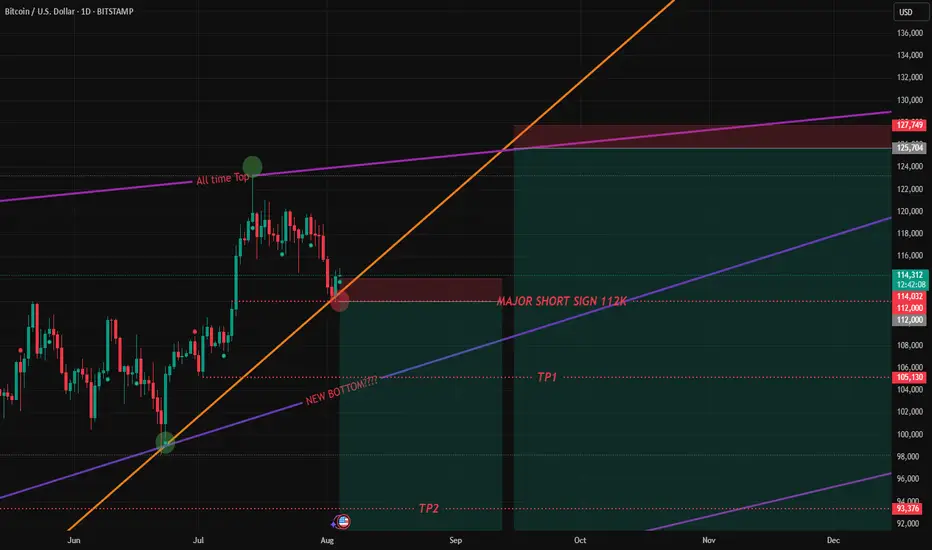
BTC over viewOn BTC 1D chart, we can easily see things started when WW3 news related hovering around. Shows on chart is the most likely SHORT scenario with all major marks. If Btc keep pumping up to 116k, I'll wait it until 125k (at the All time Top mark) to hit another Short on the list.
XAUUSD sclping setupXAUUSD M15 create double doji evning shoting star.
Sell below: 3361.00
Stop Loss: 3364.00
1st TP: 3355
2nd TP: 3351
3rd TP: 3347
4th TP: 3341
If breakout rising trendline and 3340 then gold more downward move 3330, 3318 and 3302.

BTC Hits Premium Zone – Bearish Reversal Loading? BTC Hits Premium Zone – Bearish Reversal Loading?
🧠 Technical Breakdown:
🔹 1. Previous Market Structure & CHoCH
The chart shows a clear shift in structure (CHoCH) on the left, which marked the start of the bearish leg.
Break of Structure (BOS) confirms continuation of lower highs and lower lows until recent liquidity grab near the $112,551 zone.
Equal highs and liquidity above were taken out, making the move into the Premium Order Block zone highly significant.
🔹 2. Liquidity and Fair Value Gap (FVG) Zones
A major Liquidity + FVG zone was left unmitigated between $113,000–$112,000, and price is likely to revisit it.
This aligns with the target zone at $112,890, which is highlighted as a magnet for price to rebalance the inefficiency.
🔹 3. Order Block & Premium Supply Zone
A well-defined Order Block is marked just below the resistance zone near $115,166–$116,021.
Price is currently retracing into this zone, suggesting a potential reaction point for smart money to re-enter shorts.
Volume is expected to pick up here, and a reversal could initiate if price fails to break above this supply.
🔹 4. Volume Profile and Market Imbalance
Volume clusters are heaviest near the $114,000–$114,300 range, indicating high activity and previous accumulation/distribution.
Thin volume near the $112,551 zone further confirms price may drop quickly if rejection happens.
🔹 5. Support & Liquidity Sweep
Support zone around $112,551 is a previous liquidity pool and weak low that has not been fully cleared.
Price is likely to revisit this zone in the short term to clear liquidity and complete market rebalancing.
🔐 Institutional Narrative:
Smart money engineered a liquidity sweep to the downside, then caused a retracement into premium.
Now, BTC/USD is positioned in a high-risk zone where sell-side institutions may enter to push price lower.
If this order block holds, expect a rejection toward $112,890, followed by possible deeper continuation into the liquidity void below.
📌 Key Levels:
Level Price (USD)
Strong Resistance Zone 115,166 – 116,021
Order Block (Sell Area) 114,800 – 116,000 (approx.)
Immediate Support 113,000 – 112,551
Target (Liquidity Zone) 112,890
Weak Low (Final Sweep) 112,000
📉 Trade Outlook & Strategy:
🔺 If price reacts bearishly at Order Block:
Look for lower timeframe BOS/CHoCH confirmation.
Entry: Short on rejection at or near $115,000–$115,500
Target 1: $112,890
Target 2: $112,000 (extended liquidity sweep)
Stop-loss: Above $116,200 (invalidates bearish OB)
🔻 If price breaks and closes above $116,021 with momentum:
Structure flips bullish, and the OB is invalidated.
Look for long setups on retracement to $114,000 zone.
🧭 Conclusion:
BTC/USD is currently trading within a Premium Zone, testing a strong Order Block below key resistance. Price may face a bearish reaction, targeting the liquidity zone at $112,890. Smart money footprints suggest a potential trap for breakout buyers, and if momentum fades, we can expect a downside reversal to sweep remaining liquidity.

Watching for Pullback Below $84 in Citigroup (C)Over the past month, Citigroup shares have appreciated 8.58%, outperforming both the Finance sector's 1.91% gain and the S&P 500's 3.92% increase. This relative outperformance may signal strength, but short-term positioning and market structure suggest a potential shift.
Expecting a Sharp Move Below $84 – Option Flow Insight
Despite the recent strength, I anticipate a significant downward move below the $84 level in the upcoming week. This expectation is based on notable option activity detected in the Times & Sales feed, specifically large put orders suggesting bearish positioning.
In response to this setup, I plan to execute a bearish vertical spread, specifically:
Buying the $84 puts
Selling the $80 puts
This strategy limits downside risk while still profiting from a potential retracement.
Fundamental Picture Ahead of Earnings
Citigroup's next earnings release is scheduled for July 15, 2025. The company is expected to report:
EPS of $1.70 (+11.84% YoY)
Revenue of $20.85B (+3.51% YoY)
For the full year, the Zacks Consensus Estimate forecasts:
EPS of $7.38 (+24.03%)
Revenue of $83.84B (+3.33%)
While these figures suggest healthy growth, it's important to note that recent analyst estimate revisions have been modestly negative, with the EPS estimate decreasing 0.27% over the last 30 days. Citigroup currently holds a Zacks Rank #3 (Hold), reflecting a neutral sentiment from analysts.
Valuation Metrics
From a valuation standpoint:
Forward P/E: 10.75, notably below the industry average of 15.02
PEG ratio: 0.61, versus the industry average of 1.26
This indicates that Citigroup is undervalued relative to its peers, especially when considering growth prospects, which could provide some support. However, short-term bearish flows may dominate price action heading into earnings.
Industry Outlook
The Financial - Investment Bank industry, which includes Citigroup, currently has a Zacks Industry Rank of 96, placing it in the top 40% of over 250 industry groups. Historically, industries in the top half outperform those in the bottom half by a factor of 2 to 1.

GOAT / USDT : Watch closely for a breakdownGOAT/USDT - Watch Closely!
Currently testing the critical support trend line.
Bullish Scenario: If it holds here and bounces, we could see a potential upward move.
Bearish Scenario: A breakdown below this support would confirm further downside, and I'd be leaning bearish in that case.
Pro Tip: Wait for confirmation before entering – either a strong rejection off support for bullish entry or a clean break for a bearish setup.
Stay alert and trade wisely!

EURUSD Down Trend As dxy is bullish Eurusd will be bearish. I need price to go to my eyeing level in the next couple weeks. we wait and see what price we want to do next week, Wednesday.

Bitcoin: New All-Time High — What’s Next?Bitcoin had an incredible run, breaking the old all-time high ($111,980) with strong bullish momentum and setting a fresh ATH at $123,218 (Binance). We just witnessed the first major corrective move of ~6% and a decent bounce so far — but the big question is:
What’s next? Will Bitcoin break higher over the summer or form a trading range here?
Let’s dive into the technicals.
🧩 Higher Timeframe Structure
May–June Range:
BTC was stuck between $110K–$100K, forming an ABC corrective pattern. Using trend-based Fib extension (TBFE) from A–B–C:
✅ C wave completed at $98,922 (1.0 TBFE)
✅ Upside target hit at $122,137 (-1 TBFE)
Full Bull Market TBFE:
➡️ 1.0 → $107,301 → previously rejected
➡️ 1.272 → $123,158 → recent rejection zone
Pitchfork (log scale):
➡️ Tapped the upper resistance edge before rejecting.
Previous Bear Market Fib Extension:
➡️ 2.0 extension at $122,524 hit.
2018–2022 Cycle TBFE:
➡️ 1.618 at $122,011 tapped.
Macro Fibonacci Channel:
➡️ Connecting 2018 low ($3,782), 2021 ATH ($69K), 2022 low ($15,476) →
1.618–1.666 resistance band: $121K–$123.5K.
✅ Conclusion: Multiple fib confluences mark the $122K–$123K zone as critical resistance.
Daily Timeframe
➡️ FVG / Imbalance:
Big daily Fair Value Gap between the prior ATH and $115,222 swing low.
BTC broke the prior ATH (pATH) without retest → a pullback to this zone is likely.
Lower Timeframe / Short-Term Outlook
We likely saw a completed 5-wave impulse up → now correcting.
The -6% move was probably wave A, current bounce = wave B, next leg = wave C.
➡ Wave B short zone: $120K–$121K
➡ Wave C target (1.0 TBFE projection): ~$113,326
➡ Confluence at mid-FVG + nPOC
Trade Setups
🔴 Short Setup:
Entry: $120,300–$121,000
Stop: Above current ATH (~$123,300)
Target: $113,500
R:R ≈ 1:2.3
🟢 Long Setup:
Entry: Between Prior ATH and $113,000
Stop: Below anchored VWAP (~$110,500)
Target: Higher, depending on bounce confirmation.
🧠 Educational Insight: Why Fibs Matter at Market Extremes
When markets push into new all-time highs, most classic support/resistance levels disappear — there’s simply no historical price action to lean on. That’s where Fibonacci extensions, channels, and projections become powerful tools.
Here’s why:
➡ Fibonacci extensions (like the 1.272, 1.618, 2.0) help estimate where trend exhaustion or profit-taking zones may appear. They are based on the psychology of crowd behavior, as traders anchor expectations to proportional moves from previous swings.
➡ Trend-Based Fib Extensions (TBFE) project potential reversal or continuation zones using not just price levels, but also the symmetry of prior wave moves.
➡ Fibonacci channels align trend angles across multiple market cycles, giving macro context — like how the 2018 low, 2021 ATH, and 2022 low project the current 1.618–1.666 resistance zone.
In short:
When you don’t have left-hand price history, you lean on right-hand geometry.
That’s why the $122K–123K zone wasn’t just random — it’s a convergence of multiple fib levels, cycle projections, and technical structures across timeframes.
⚡ Final Thoughts
Bitcoin faces major resistance around $122K–$123K backed by multiple fib and structural levels. A retest of the prior ATH zone (~$112K–$113K) looks probable before the next big directional move. Watch lower timeframe structure for signs of completion in this corrective phase.
_________________________________
💬 If you found this helpful, drop a like and comment!
Want breakdowns of other charts? Leave your requests below.

Head & Shoulders on EUR/USD daily!We're currently observing a significant Head & Shoulders pattern forming on the EUR/USD daily chart, with the price just breaking below the neckline on the right shoulder.
Applying standard Head & Shoulders trading principles, we measure the distance from the head's peak to the neckline and project that same range downward from the breakdown point. Based on this, the estimated target price (TP) for the trade lands around $1.135. The stop-loss will be positioned just above the right shoulder to manage risk effectively.
We'll be watching closely to see how this setup unfolds. 🍻

New targets for Reddit RDDT In this video I recap the previous reddit analysis where we looked for the long which is playing out really well .
I also look at the current price action and simulate what I think could be a target for the stock moving forward using Fib expansion tools as well as levels below for price to draw back too.
Welcome any questions below the chart . Thanks for viewing

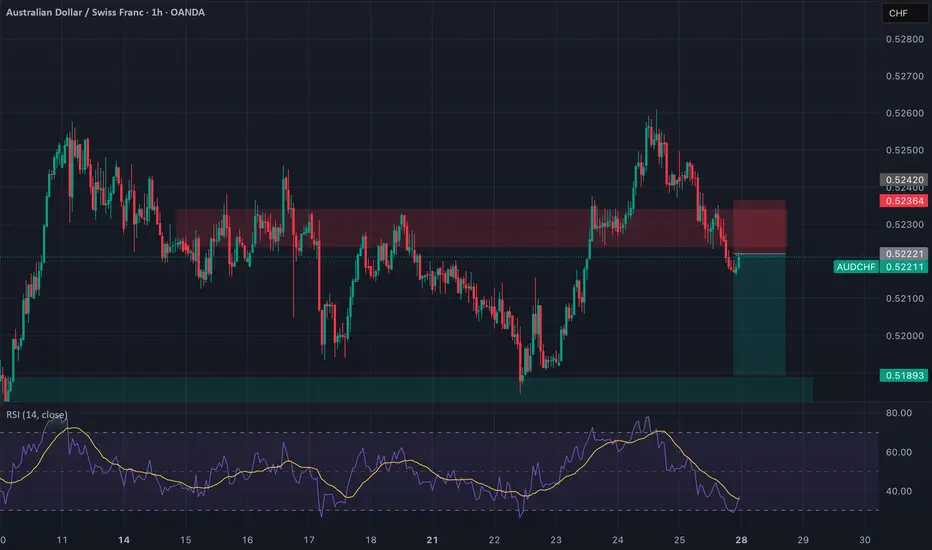
AUDCHF: Broken Support, Bearish Flow In Play Timeframe: 1H
Bias: Bearish
Type: Support Turncoat → Breakdown Play
📊 Technical Setup
AUDCHF previously broke the 4H resistance (0.5236) which flipped to support. However, price has now broken below this support, confirming it as a failed demand zone.
• Entry: Market execution or retest of 0.5236
• SL: Above 0.5245
• TP: 0.5189
• RR: ~1:2
• RSI: Below 50 and heading lower = momentum supports downside
📉 Macro & Fundamental Confluence
• AUD Weakness: RBA dovish, conditional score declining, bearish seasonality
• CHF Slightly Less Weak: Despite SNB dovish stance, CHF is outperforming AUD
• COT + Sentiment: AUD CFTC weakening, CHF holding steady
• Risk Sentiment: RISK ON environment reduces CHF demand but AUD still underperforms
🧭 Gameplan
“Support failed to hold. Bearish pressure intensifies. Target previous swing low zone.”
🔔 Watch for retest of 0.5236 for better RR setup before continuing short.
NF news, can gold selling pressure drop to 3240?⭐️GOLDEN INFORMATION:
Gold (XAU/USD) is trading lower, around $3,285 in early Asian hours on Friday, as a firmer U.S. dollar weighs on the non-yielding metal following new tariff measures announced by President Donald Trump.
The White House said late Thursday that Trump will set a 10% baseline tariff, stepping back from earlier speculation about hikes to 15% or higher, according to Bloomberg. He also signed an executive order raising the tariff on Canada from 25% to 35%, effective August 1, 2025, while extending Mexico’s current tariff rates for another 90 days to allow more time for negotiations.
⭐️Personal comments NOVA:
large frame, gold price is still moving in the downtrend line. will wait for NF result to have strong selling force again 3240
⭐️SET UP GOLD PRICE:
🔥SELL GOLD zone: 3374- 3376 SL 3381
TP1: $3365
TP2: $3350
TP3: $3333
🔥BUY GOLD zone: $3242-$3240 SL $3235
TP1: $3255
TP2: $3268
TP3: $3280
⭐️Technical analysis:
Based on technical indicators EMA 34, EMA89 and support resistance areas to set up a reasonable SELL order.
⭐️NOTE:
Note: Nova wishes traders to manage their capital well
- take the number of lots that match your capital
- Takeprofit equal to 4-6% of capital account
- Stoplose equal to 2-3% of capital account

BTC - Not the End of the DropRather the beginning. Bitcoin has fallen below this bearish intersection. Anticipating price to fall rapidly on one of these two pathways to the Uber low liquidity levels.
DXY is retesting a major bearish breakdown - this is the conduit that will justify a flash crash of this magnitude prior to a 3-5 year bull run.
Happy trading.
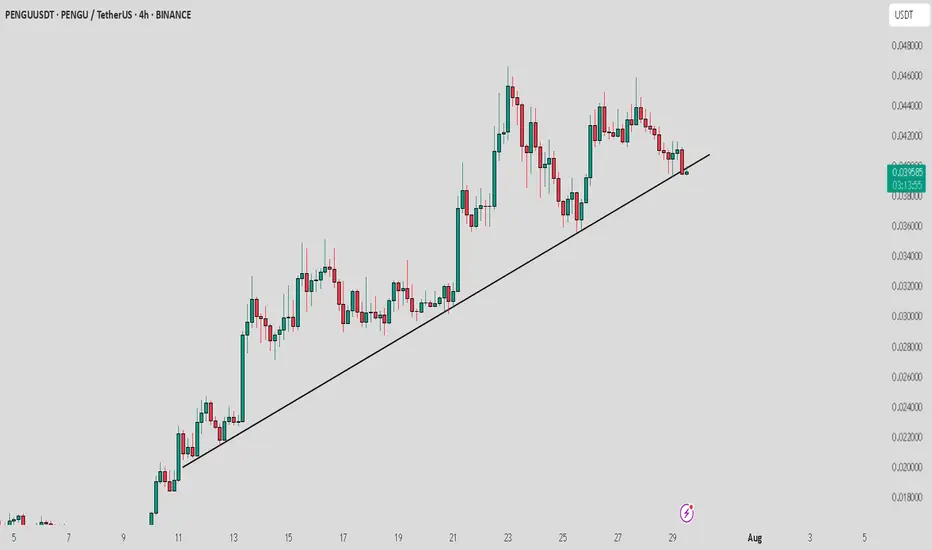
PENGU / USDT : Breaking down from Trendline supportPENGU/USDT is breaking down from the trend line support, but the retest is still in progress. Watch for rejection at key levels.
Pro Tip: Wait for confirmation of rejection before entering the trade and always apply proper risk management to safeguard your position.
Bearish Retest Setup After BreakdownPrice broke down from the recent bounce and lost the 0.098–0.101 zone, which lined up with the 23.6–38.2 fibs. That area is now likely to act as resistance. Momentum is still bearish. MACD histogram is red and expanding, and no signs of reversal yet. On the daily timeframe, MACD has just started to cross bearish, which adds weight to the downside bias.
If price retests that 0.098–0.101 area and shows weakness (like rejection wicks or small-bodied candles), it’s a clean short opportunity. First target would be the recent low around 0.092, and if that breaks, the next key level is 0.077.
Any push above 0.102 would invalidate the setup for me.

downtrend below 3300 , after ADP-NF⭐️GOLDEN INFORMATION:
The Federal Reserve’s policy statement noted that economic activity has slowed in the first half of the year, although the unemployment rate remains low and inflation is still “somewhat elevated.” The Fed reaffirmed its commitment to achieving maximum employment and returning inflation to its 2% target, while also acknowledging that “uncertainty around the economic outlook remains elevated.”
Earlier data showed that U.S. GDP grew in the second quarter, but underlying details painted a softer picture. Consumer spending cooled, and business investment declined significantly. According to Reuters, most economists now forecast full-year GDP growth at 1.5%, below the Fed’s 1.8% projection.
⭐️Personal comments NOVA:
Gold prices reacted negatively as the FED kept interest rates unchanged and Chairman POWELL's hawkish stance. Selling pressure below 3300 is being maintained.
⭐️SET UP GOLD PRICE:
🔥SELL GOLD zone: 3360- 3362 SL 3367
TP1: $3350
TP2: $3340
TP3: $3330
🔥BUY GOLD zone: $3249-$3247 SL $3242
TP1: $3258
TP2: $3270
TP3: $3285
⭐️Technical analysis:
Based on technical indicators EMA 34, EMA89 and support resistance areas to set up a reasonable SELL order.
⭐️NOTE:
Note: Nova wishes traders to manage their capital well
- take the number of lots that match your capital
- Takeprofit equal to 4-6% of capital account
- Stoplose equal to 2-3% of capital account

#PENGUUSDT confirms a bearish impulse📉 SHORT BYBIT:PENGUUSDT.P from $0.034625
⚡ Stop loss $0.035646
🕒 Timeframe: 4H
⚡ Overview:
➡️ A Double Top pattern BYBIT:PENGUUSDT.P has formed, signaling a bearish reversal.
➡️ The price broke the $0.0355 support and is consolidating below, confirming seller strength.
➡️ Increasing sell volume confirms bearish control.
➡️ Main focus on targets in the $0.034–0.033 zone.
➡️ The POC at $0.03113 remains the ultimate bearish objective.
🎯 TP Targets:
💎 TP 1: $0.033947
💎 TP 2: $0.033369
💎 TP 3: $0.032948
BYBIT:PENGUUSDT.P Trade Recommendations:
📢 Hold short towards the TP zones.
📢 Watch for reaction around $0.0339 — partial profit-taking possible.
📢 Invalidation if price reclaims above $0.0356.
⚠️ As long as bearish pressure holds, the price is likely to continue towards TP2–TP3.
⚠️ A recovery above $0.0356 would invalidate this setup.
🚀 The signal confirms a bearish impulse — expecting further downside!

Getting short on EUR/USD!The dollar has looked set for a reversal and coming into the week it didn't hang around at all. I had a bit of a short bias on EUR/USD and was looking for confirmation signal which pretty much came at market open.
Price pushed higher back into the key level taking out a short term high, but was unable to follow through to form a new higher high. Heading into Monday London session, momentum immediately took hold with a clear bearish change of character and price didn't look back > breaking structure and key levels with minimal effort.
I was waiting for a pull back to get short early which didn't occur. But no need to chase price, waiting and patience is part of the game.
Price has now broken another key support level and is set to retest it as resistance. This will be my entry point (see screenshot) > using the 70.5%-78.6% fib retracement level and my stop above Tuesdays high. Keep it simple.
s3.tradingview.com

Is the market panicking over FOMC today?⭐️GOLDEN INFORMATION:
Gold (XAU/USD) fluctuates within a narrow range during the Asian session on Wednesday, showing only modest gains and losses as traders tread carefully ahead of the Federal Reserve’s policy announcement. The metal’s recent rebound from the $3,300 area faces hesitation, with investors awaiting clearer signals on the Fed’s rate-cut trajectory before committing to new positions. As such, attention remains firmly on the outcome of the two-day FOMC meeting, set to be released later today.
In the meantime, pre-Fed uncertainty is lending some support to the safe-haven appeal of gold. Additionally, a slight pullback in the U.S. Dollar—after hitting its highest level since June 23 on Tuesday—is providing a mild lift to the metal. However, expectations that the Fed will maintain elevated interest rates for an extended period are limiting the dollar’s decline and capping upside potential for the non-yielding yellow metal. Adding to the cautious mood, recent optimism on global trade also tempers bullish momentum in XAU/USD.
⭐️Personal comments NOVA:
slight recovery, not big before FOMC news. Gold price will still be under selling pressure when interest rate stays at 3300
⭐️SET UP GOLD PRICE:
🔥SELL GOLD zone: 3373- 3375 SL 3380
TP1: $3360
TP2: $3344
TP3: $3330
🔥BUY GOLD zone: $3283-$3281 SL $3276
TP1: $3295
TP2: $3307
TP3: $3320
⭐️Technical analysis:
Based on technical indicators EMA 34, EMA89 and support resistance areas to set up a reasonable SELL order.
⭐️NOTE:
Note: Nova wishes traders to manage their capital well
- take the number of lots that match your capital
- Takeprofit equal to 4-6% of capital account
- Stoplose equal to 2-3% of capital account

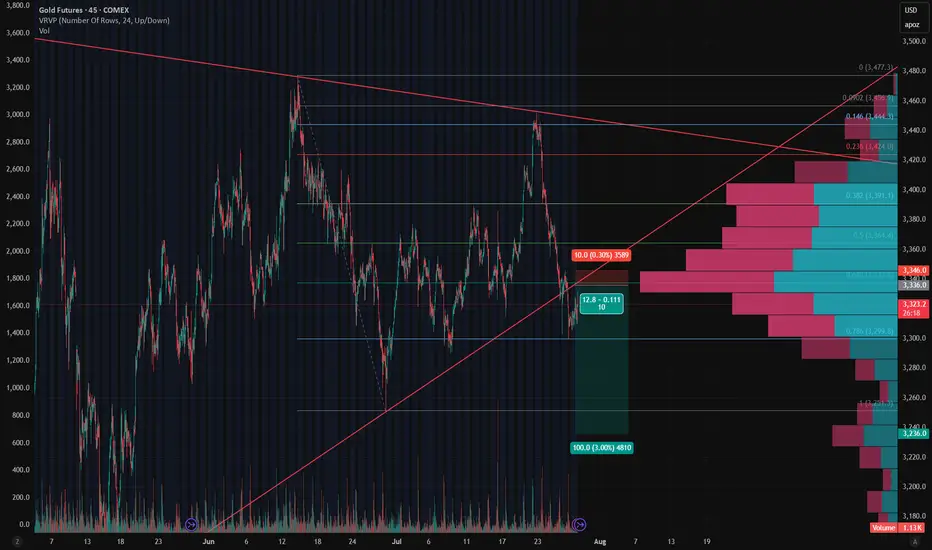
Gold - Short Setup Off Major Trendline Rejection📉 Gold - Short Setup Off Major Trendline Rejection
Gold has broken down through the rising trendline and is now retesting it — the moment of truth! 🧐
🔻 Short Entry: 3,336
🎯 Target: 3,236 (Fib 1.0 + HVN gap fill)
🛑 Stop: 3,346 (Above trendline retest)
⚖️ Risk/Reward: ~1:10
📊 Bonus: High volume node above adds resistance. Bearish volume profile structure confirms the breakdown bias.
Watching for volume to pick up on the move down. Let's see if GC bleeds into August. 🩸📆