SHORT ON NZD/CADNzd/cad has given us a double top with a confirmed change of character (choc)
to the downside.
I am waiting for price to reach into supply sweeping liquidity before taking a sell to the next demand level looking to catch 100-150 pips.
Shortsetup

Strong weekend selling pressure, below 3300⭐️GOLDEN INFORMATION:
Gold prices (XAU/USD) came under renewed selling pressure during the Asian session on Friday, retreating below the $3,300 level after a lackluster performance the previous day. The precious metal is edging closer to the two-week low seen on Tuesday, as investors await the release of the US Personal Consumption Expenditures (PCE) Price Index. This key inflation gauge is expected to offer fresh insight into the Federal Reserve’s policy outlook and could significantly influence US Dollar (USD) movements—ultimately shaping the near-term trajectory of the non-yielding yellow metal.
⭐️Personal comments NOVA:
Selling pressure at the end of the week caused gold prices to fall below 3300, maintaining selling pressure and falling today
⭐️SET UP GOLD PRICE:
🔥SELL GOLD zone: 3326- 3328 SL 3333
TP1: $3315
TP2: $3302
TP3: $3290
🔥BUY GOLD zone: $3248-$3250 SL $3243
TP1: $3260
TP2: $3270
TP3: $3280
⭐️Technical analysis:
Based on technical indicators EMA 34, EMA89 and support resistance areas to set up a reasonable SELL order.
⭐️NOTE:
Note: Nova wishes traders to manage their capital well
- take the number of lots that match your capital
- Takeprofit equal to 4-6% of capital account
- Stoplose equal to 2-3% of capital account

BNBUSDTPersonally, I see BNB struggling to break above that key resistance zone near 648–649. The rejection from that level, especially with decreasing momentum, makes me lean bearish in the short term. We’ve seen this zone hold back price before, and unless there's a strong breakout with volume, I think there's a higher chance we see a pullback toward the 616–618 area. I’m just watching price action closely and waiting for a clean confirmation—no need to rush a position when the structure’s already signaling hesitation.

SHOT ON GBP/CADGBP/CAD has given nice rejection from a major supply area.
There is lots of imbalance to the downside.
I will be selling GBP/CAD looking to catch 100-200 pips to the next demand zone.

USD/CHF – Rejection at Key Fib Confluence, Bearish Continuation We’re seeing a beautiful textbook rejection off the 0.79Fib zone (0.8200), precisely where price tapped into a previous structure break and minor supply block. Price surged into the red zone, wicked just above the 200 EMA, and was instantly met with heavy sell-side pressure — a strong signal of institutional distribution.
📌 Technical Confluences at Play:
Price failed to break the 200 EMA cleanly — acting as dynamic resistance.
0.79 Fib levels aligning with prior supply.
Rising wedge structure broken to the downside.
Entry candle printing a solid engulfing rejection — institutional footprint.
📉 Target Zone:
Primary TP sits at the 0.236 Fib level (0.8101), but the full measured move of this wedge gives us a final downside target near 0.8038, with intermediate stops at key Fibs. Invalidation above 0.82294
🧠 Trader’s Insight:
“Patience is power. You don’t chase moves, you position for moments.”
Let the market come to your zone of interest, validate your thesis, and then strike with precision. The best trades come from areas where multiple confirmations stack in your favor.
📉 Trade Plan:
Entry: 0.81933 rejection zone
TP1: 0.8130
TP2: 0.8101
Final TP: 0.8038
SL: Above 0.82294 (tight invalidation)
@WrightWayInvestments
@WrightWayInvestments
@WrightWayInvestments

EUR/CHF Channel Breakdown – Bearish MomentumThe EUR/CHF pair has broken down from a well-defined ascending parallel channel, indicating a shift in market structure and a possible continuation to the downside. The price had been consistently respecting the resistance zone near 0.9435–0.9440 (marked in red) and the support zone near 0.9375–0.9380 (marked in green), forming an upward-sloping consolidation channel.
After multiple rejections at the upper resistance, the price decisively broke below the support line with strong bearish momentum, confirming a bearish breakout from the channel.
🔻 Breakdown Implication
The height of the channel—measured from the support to the resistance—has been used to project the next potential downside target. The projected breakdown target is marked near 0.9309, which aligns with historical price reaction zones and provides a clean structure-based price objective.
This suggests the bearish move could extend further in the coming sessions unless the price quickly recovers and climbs back above the broken support, which would invalidate the breakdown structure.
🧠 Trading Outlook
Bias: Bearish after confirmed breakdown from channel
Entry (if not in already): Consider selling on retest of broken support (~0.9375)
Target: 0.9309 (based on channel height)
Stop Loss: Above 0.9390–0.9400 (above breakdown point)
This setup is ideal for momentum traders looking to capitalize on trend continuation after a failed bullish structure.
=================================================================
Disclosure: I am part of Trade Nation's Influencer program and receive a monthly fee for using their TradingView charts in my analysis.
=================================================================

F 5M Long Daytrade Aggressive CounterTrend TradeAggressive CounterTrend Trade
- long impulse
- unvolumed T1
+ resistance level
+ biggest volume 2Sp-
+ weak test
+ first bullish bar below close entry
Calculated affordable stop market
T2 5M take profit
1H CounterTrend
"- long impulse
- unvolumed T1
+ resistance level"
1D CounterTrend
"- long impulse
- unvolumed T1
+ resistance level"
1M CounterTrend
"+ short impulse
- exhaustion volume
+ T2 level
+ resistance level
- unvolumed interaction bar
- reaction bar looks to close bullish in 6 days"
1Y CounterTrend
"+ long impulse
+ volumed T2 level
+ volumed 2Sp+
+ 1/2 correction
+ weak test"

AUDJPY SHORT FORECAST Q2 W26 D24 Y25AUDJPY SHORT FORECAST Q2 W26 D24 Y25
Professional Risk Managers👋
Welcome back to another FRGNT chart update📈
Diving into some Forex setups using predominantly higher time frame order blocks alongside confirmation breaks of structure.
Let’s see what price action is telling us today! 👀
💡Here are some trade confluences📝
✅Weekly Order Block Identified
✅Daily Order block identified
✅4H Order Block identified
✅15' Order block identified
🔑 Remember, to participate in trading comes always with a degree of risk, therefore as professional risk managers it remains vital that we stick to our risk management plan as well as our trading strategies.
📈The rest, we leave to the balance of probabilities.
💡Fail to plan. Plan to fail.
🏆It has always been that simple.
❤️Good luck with your trading journey, I shall see you at the very top.
🎯Trade consistent, FRGNT X

LINk/USDTFor the Link currency, I feel that this decline is continuing and it is continuing to decline step by step. The chart was not readable. Tell me your opinion.

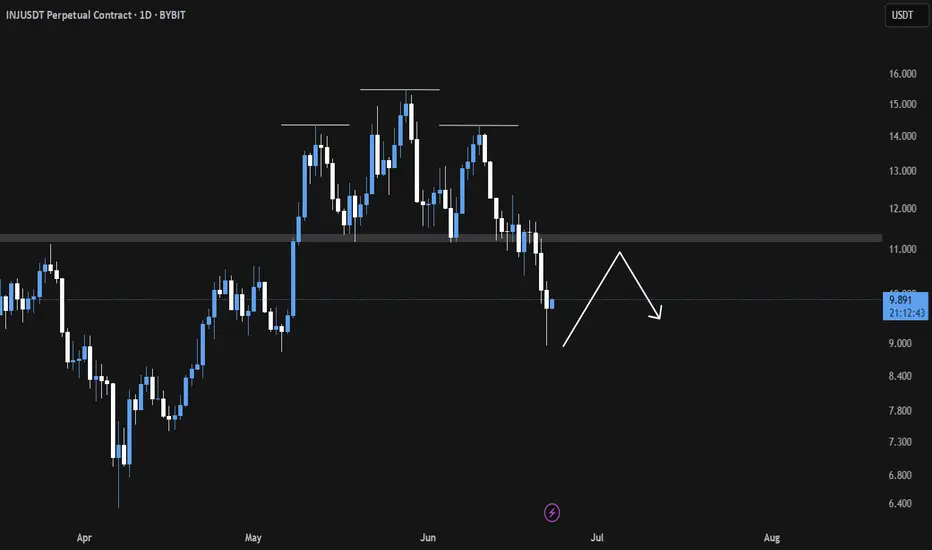
INJ Breakdown in Play Eyeing the Neckline for Precision ShortsINJ/USDT Analysis
〽️ The Head and Shoulders pattern has broken down successfully, confirming a bearish structure.
💠We anticipate a potential relief bounce towards the $11 region which aligns closely with the neckline retest zone. This area is likely to act as a liquidity trap, where institutional sellers may re-enter aggressively 👀.
🎯 Key downside targets remain at
1. $8.98
2. $8.03
3. $6.92
Strategic Plan 🎖️
Look to initiate short positions around the neckline retest near $11, as the risk-reward becomes increasingly favorable from that level.
Trade with discipline. Let the structure lead the execution. 🫡🧠
USDCAD H4 AnalysisUSDCAD Showing a Bearish Flag. If it breaks this zone above, Most probably can fly up to 1.37836 and higher to 1.38654. If no, Can rally between 1.36359, 1.35415 or even lower. Trading Analysis from 23-06-25 to 27-06-25. Take your risk under control and wait for market to break support or resistance on smaller time frame. Best of luck everyone and happy trading.🤗

NASDAQ Short-Term Outlook (Study Purpose Only)The NASDAQ index is showing signs of short-term weakness following a rejection near the 22,000–22,200 resistance zone. The recent breakdown from the consolidation range suggests bearish sentiment is building.
🔻 Key Observations:
Stop Loss Zone: 22,192
Price should ideally remain below this level for a bearish setup to remain valid. A move above this zone may invalidate the downside scenario.
Immediate Support Level: 21,010
If selling pressure continues, this is the first potential bounce zone. Watch price behavior closely here.
Deeper Support Target: 20,223
A break below 21,000 could open the door for a drop toward the 20,200 area — a previous accumulation/support level.
⚠️ Risk Management:
Traders may consider this type of setup if looking for short positions, but only with tight risk controls and clear confirmation of trend continuation.
📝 Disclaimer:
This analysis is strictly for study and educational purposes. It is not financial advice or a recommendation to take a trading position. Please consult a licensed financial advisor before making any investment decisions.

BTC Loses Key Level — Will 100K Hold or Fold?Bitcoin has been locked in a range for the past 45 days, clinging above the critical psychological support at $100K. But cracks are starting to show…
Every bounce from the key level at $102,430 has been weakening — and now, for the first time, we’re breaking cleanly below it. Things are starting to tilt bearish.
So the question is…
⛏️ Will 100K be tested next?
🔍 Key Support Zone: $97.7K–$96.9K
Using the Fibonacci retracement from the swing low at $74.5K to the recent ATH, the 0.382 retracement lands at $97,655 — just below the $100K mark.
But there’s more…
Here’s why the zone between $97.7K and $96.9K is crucial:
0.382 Fibonacci retracement: A common pullback level in strong uptrends.
Anchored VWAP from $74.5K: Currently sitting around $96.9K, tracking cumulative volume-weighted average price — a key level.
Daily Order Block: Sits right at $96,887, aligning with the VWAP and reinforcing the area as demand-rich.
1.272 Fibonacci extension: From the previous move — providing another layer of confluence.
Fair Value Gap (FVG): The imbalance lies right in this zone. Price often fills these before continuing trend.
All of this stacks up to a high-probability long setup.
🕵️♂️ What to Do Now?
Set alerts at $100K and watch for a reaction. If price slices through, shift focus to the 0.382 Fib — monitor price action closely for signs of a reversal.
The first clean test of this zone could present a solid long — but as usual don’t trade blindly. Wait for confirmation.
_________________________________
💬 If you found this helpful, drop a like and comment!
Want breakdowns of other charts? Leave your requests below.

BTC MACRO PLAY - SHORT TRADE SETUP📉 BTC/USDT SHORT TRADE SETUP – WEEKLY TIMEFRAME
🔍 Trade Idea Overview:
We are seeing a bearish divergence between price and volume on the weekly chart — while price makes higher highs, volume is decreasing, signaling a potential reversal or weakening trend.
Further confluence is seen with the VMC Cipher indicator. If a red dot prints, it will confirm the short entry. If not, the trade idea should be abandoned.
📊 Trade Plan:
Entry Zone: Around $106,300–$107,000 (wait for confirmation)
TP 1 🎯: $102,000
TP 2 🎯: $97,500
TP 3 🎯: $93,000
🛑 Risk Management:
Stop-Loss: Above recent highs at $111,800 (or adjusted based on your entry)
⚠️ Disclaimer:
Once TP 1 is reached, move stop-loss to breakeven to protect capital and eliminate risk.
TP 3 may never be reached, but it remains part of the plan to capture extended downside if momentum continues.
If no red dot prints, there is no confirmation — be ready to abandon the trade.

ONDO — Reversal or more Pain ahead? After a strong rally back in 2024, ONDO topped at $2.15 — completing a clear 5-wave impulsive move. Since then, price has entered a prolonged downtrend, dropping over -70%, with no confirmed reversal signs yet.
We’re now trading around a critical zone near $0.70. So the question is: where’s the next potential bottom?
🔎 Technical Breakdown:
📍 VWAP Breakdown:
The yellow anchored VWAP (Volume Weighted Average Price) has been lost — a clear sign of market weakness. This VWAP was previously acting as support but has now flipped to resistance, which often precedes continued downside.
📌 Key Support Zone:
$0.80–$0.70 was a structural support area that has now been broken — another bearish sign.
📉 Fibonacci Confluence:
Taking the structure and applying a Fibonacci retracement, the 0.786 retracement lies at $0.4828 — let’s round that to a critical $0.50 zone. This level is important for several reasons:
Liquidity rests at a previous key low at $0.50128
Anchored VWAP Band (0.618 multiplier) aligns with the same area
The 8/1 Gann Fan also intersects around this zone
All roads lead to the $0.50 level as a potential high-probability reversal zone. A bounce from here — especially with volume confirmation or reversal candlesticks etc. — would be a signal worth watching.
💡 Educational Insight: Importance of 0.786–0.886 Fibonacci Zone + VWAP
While many focus on the 0.618 retracement, bear markets often go deeper.
The 0.786–0.886 zone is where emotional exhaustion kicks in — traders give up, liquidity pools build, and smart money steps in.
Combining this with Anchored VWAP adds precision:
VWAP reflects where the “average buyer” is positioned. When price reaches confluence with both deep fibs and VWAP fib bands, you have a statistically powerful setup for reversals.
🚨 Note: These zones are not automatic buy levels — watch for confirmation signs before entering.
🛎️ Set your alerts, stay patient, and as always let the trade come to you.
_________________________________
💬 If you found this helpful, drop a like and comment!
Want breakdowns of other charts? Leave your requests below.

AMAZON TROUBLENASDAQ:AMZN Is currently trading Just 11% below its all time high and currently Facing exhaustion.
Amazon is currently trading 217$ range which was previous support now turned resistance (Daily Timeframe) , making a double top pattern and a negative divergence on the RSI.
The best Trades are the ones with multiple confirmations
- Trading at a resistance (1D chart)✅
- Negative Price Action at the resistance (Double Top Pattern)✅
- RSI negative divergence✅
- Market Structure ✅
Entry Criteria
- A Red candle at the entry Line Marked
- Stoploss Above the Entry Candle
Target 1- 211$
Target 2- 208$
Keep Your Risk Reward Intact! Not An investment Advice

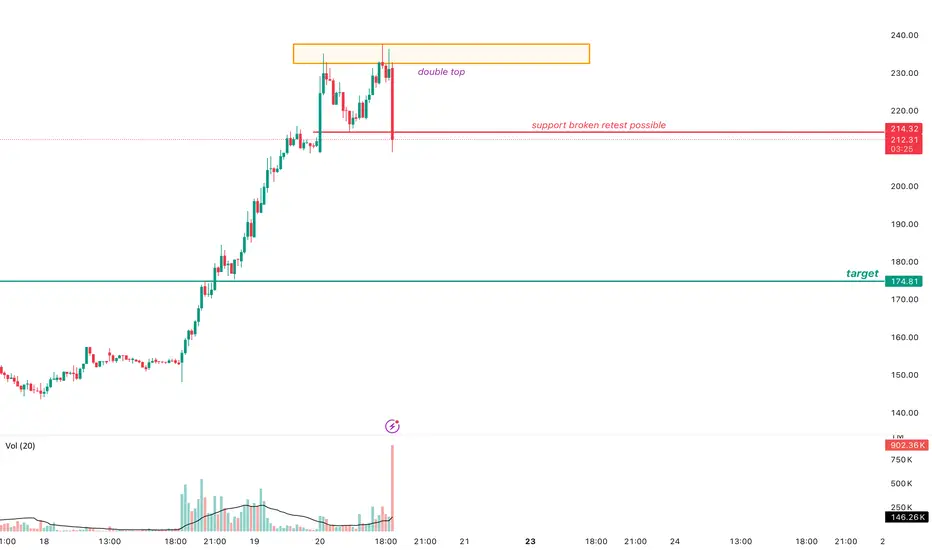
CRCL LOOKS OVERBOUGHTAs you can see after a good ride from 102 to 234 now the stock looks overbought. and on shorter time frames the price action shows a classic pattern of double top and breaking the previous support. simply if the stock closes 15 m candle below the support you might see a short retest to the support from downside that is a good point to short.
SHORT ON EUR/GPBWe have a rising channel (bearish reversal chart pattern) at a major level of resistance (confluence)
Price has given us a breakout of the channel to the downside and is currently respecting resistance.
I will be selling EUR/GBP to the next support level looking to catch over 120 pips.

ADA , 1DAs BTC is Falling And BTC is given Breakout of Pattern in 4Hr , then Remaining coins will also fall drastically .
in 1D pattern of ADA USDT , it is Breaking Down as BTC is also given Break Down of Pattern
Follow for More Ideas like This

Gold prices continue temporary downtrend⭐️GOLDEN INFORMATION:
Gold prices (XAU/USD) came under renewed selling pressure during Friday’s Asian session, dipping to their lowest level in over a week, near the $3,344–$3,345 range. The decline was largely driven by the Federal Reserve’s hawkish tone, which emphasized persistent inflation risks and suggested a more gradual path to interest rate cuts—dampening demand for the non-yielding precious metal. Nevertheless, fragile market sentiment and a cautious risk environment may continue to lend some support to gold, potentially cushioning it against steeper declines.
⭐️Personal comments NOVA:
Selling pressure continues to maintain, pushing gold price down to 3304 today, the downtrend price line is maintaining well.
⭐️SET UP GOLD PRICE:
🔥SELL GOLD zone: 3418- 3420 SL 3425
TP1: $3400
TP2: $3382
TP3: $3370
🔥BUY GOLD zone: $3306-$3304 SL $3299
TP1: $3315
TP2: $3328
TP3: $3340
⭐️Technical analysis:
Based on technical indicators EMA 34, EMA89 and support resistance areas to set up a reasonable SELL order.
⭐️NOTE:
Note: Nova wishes traders to manage their capital well
- take the number of lots that match your capital
- Takeprofit equal to 4-6% of capital account
- Stoplose equal to 2-3% of capital account

XAUUSD , 1D , Short Pattern is breaking Down , it is looking very good
Risk According to your Capital .

Bears under strong pressure, gold price adjusted⭐️GOLDEN INFORMATION:
Gold prices (XAU/USD) saw a modest rebound during Thursday’s Asian session, recovering part of the prior day’s decline and stabilizing around the $3,362–$3,363 zone, marking the weekly low. Lingering trade uncertainties and escalating geopolitical tensions in the Middle East continue to weigh on global risk sentiment, supporting demand for the safe-haven metal.
Meanwhile, the U.S. Federal Reserve concluded its two-day policy meeting on Wednesday by holding interest rates steady, while signaling a more cautious approach to future rate cuts. This shift, driven in part by concerns that President Donald Trump’s tariff policies could fuel inflation, boosted the U.S. Dollar to its highest level in over a week. The resulting Dollar strength is capping gold’s upside momentum, keeping the metal below the $3,400 threshold and prompting investors to remain cautious.
⭐️Personal comments NOVA:
Bears continue to put selling pressure on gold prices. Accumulating below 3400.
⭐️SET UP GOLD PRICE:
🔥SELL GOLD zone: 3414- 3416 SL 3421
TP1: $3402
TP2: $3390
TP3: $3376
🔥BUY GOLD zone: $3347-$3345 SL $3340
TP1: $3355
TP2: $3368
TP3: $3380
⭐️Technical analysis:
Based on technical indicators EMA 34, EMA89 and support resistance areas to set up a reasonable BUY order.
⭐️NOTE:
Note: Nova wishes traders to manage their capital well
- take the number of lots that match your capital
- Takeprofit equal to 4-6% of capital account
- Stoplose equal to 2-3% of capital account

SHORT ON USD/CADUSD/CAD has given a confirmation choc (change of character) from up to down on the lower timeframe (5min) from a MAJOR supply area.
I will be selling USD/CAD looking to make over 100 pips to the next demand level.
