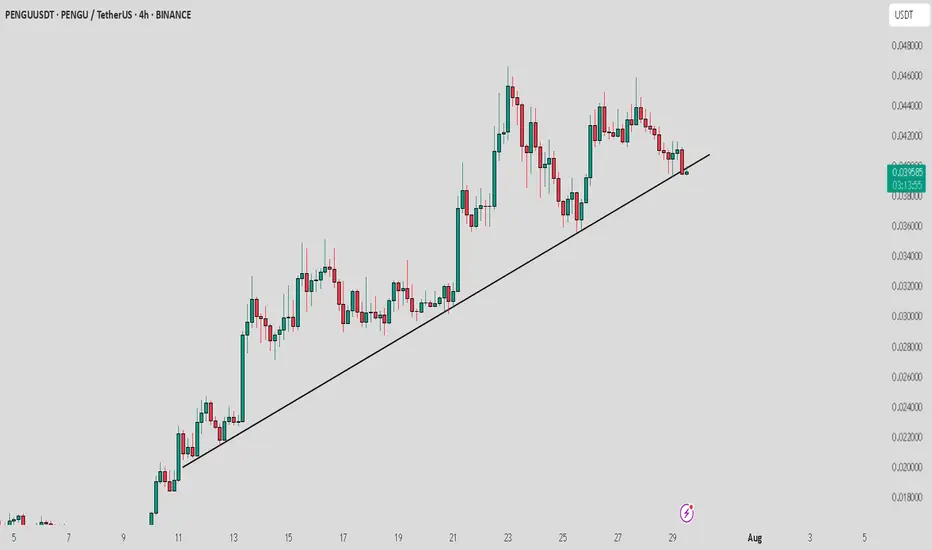
PENGU / USDT : Breaking down from Trendline supportPENGU/USDT is breaking down from the trend line support, but the retest is still in progress. Watch for rejection at key levels.
Pro Tip: Wait for confirmation of rejection before entering the trade and always apply proper risk management to safeguard your position.
Shortsignal
maintain selling pressure around 3300, GOLD ⭐️GOLDEN INFORMATION:
Gold prices extended their slide for a fourth straight session, falling over 0.60%, as the U.S. and European Union reached a weekend trade agreement that halved proposed tariffs on EU goods—from 30% to 15%. XAU/USD is currently trading around $3,312, after earlier touching a high of $3,345.
The trade breakthrough lifted market sentiment, boosting risk appetite. Meanwhile, the U.S. Dollar is regaining strength, with the Dollar Index (DXY)—which measures the greenback against a basket of six major currencies—rising 0.99% to 98.64.
⭐️Personal comments NOVA:
Gold price maintains selling pressure around 3300, continuing the downtrend
⭐️SET UP GOLD PRICE:
🔥SELL GOLD zone: 3353- 3355 SL 3360
TP1: $3345
TP2: $3332
TP3: $3317
🔥BUY GOLD zone: $3287-$3285 SL $3280
TP1: $3295
TP2: $3307
TP3: $3320
⭐️Technical analysis:
Based on technical indicators EMA 34, EMA89 and support resistance areas to set up a reasonable SELL order.
⭐️NOTE:
Note: Nova wishes traders to manage their capital well
- take the number of lots that match your capital
- Takeprofit equal to 4-6% of capital account
- Stoplose equal to 2-3% of capital account

SHORT ON EUR/NZDEZ Has given a nice CHOC to the downside with plenty of sell side liquidity to be collected.
I will be selling EZ to the next level of demand looking to catch 300-500 pips

Gold selling pressure decreased at the end of the week⭐️GOLDEN INFORMATION:
Gold price (XAU/USD) remains under modest pressure during Friday’s Asian session, unable to build on the previous rebound from the mid-$3,300s. Renewed strength in the US Dollar, which extends its recovery from a multi-week low, acts as a headwind for the non-yielding metal. Additionally, fresh optimism surrounding the US-Japan trade agreement has dampened safe-haven demand, keeping gold on the defensive for the third consecutive day.
That said, lingering uncertainty over the Federal Reserve’s rate-cut trajectory, along with concerns about its independence amid growing political pressure, could limit the USD's upside. Meanwhile, rising geopolitical tensions—this time along the Thailand-Cambodia border—may lend some support to bullion. Investors now await US Durable Goods Orders data, which could influence the greenback’s direction and provide short-term cues for the XAU/USD pair going into the weekend.
⭐️Personal comments NOVA:
Gold prices are consolidating and starting to fall below 3400 to stabilize. The momentum for an early rate cut is waning.
⭐️SET UP GOLD PRICE:
🔥SELL GOLD zone: 3399- 3401 SL 3406
TP1: $3390
TP2: $3380
TP3: $3370
🔥BUY GOLD zone: $3310-$3312 SL $3305
TP1: $3325
TP2: $3333
TP3: $3345
⭐️Technical analysis:
Based on technical indicators EMA 34, EMA89 and support resistance areas to set up a reasonable SELL order.
⭐️NOTE:
Note: Nova wishes traders to manage their capital well
- take the number of lots that match your capital
- Takeprofit equal to 4-6% of capital account
- Stoplose equal to 2-3% of capital account

SHORT ON USD/CHFUSD/CHF has given a nice head and shoulders pattern on the 2hr timeframe.
I expect price to sweep sell side liquidity below the uptrend line and tap into the next level of support.
Looking to catch over 132 pips to the downside.

SHORT ON EUR/CADEUR/CAD has given us a nice CHOC (change of character) to the downside followed by a nice retest to supply.
I expect price to push up a little more into supply before dropping to the next support/demand level.
Looking to Catch 300-400 pips over the next few days.

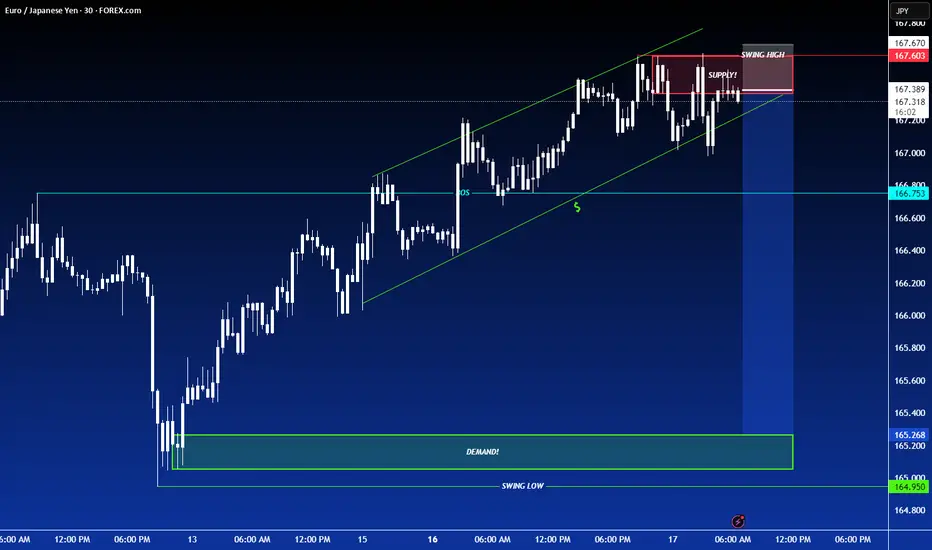
SHORT ON USD/JPYNice CHOC (Change of Character) on USD/JPY
Followed by a retest to the supply area/zone with massive wick rejection.
I will be selling USD/JPY looking to catch over 200 pips to the next level of support/demand.

SHORT ON CHF/JPYCHF/JPY has given us a nice CHOC change of character to the downside after creating a new high.
I expect price to tap into supply before falling to the next demand zone. this is a SELL LIMIT order.
Looking to catch over 200 pips to the next demand zone.

SHORT ON SILVER XAG/USDSilver has given us a CHOC (change of character) on the lower timeframe with a nice retest to the supply zone.
Bears have shown up and I expect silver to drop seeking sell side liquidity to the next demand level.

SHORT ON GBP/JPYGJ currently has broken a strong low of a rising wedge pattern (which is a bearish reversal pattern.
I am waiting for price to hit the supply zone before entering for a sell.
So a sell limit order will need to placed at the supply zone to take advantage of this opportunity.

Bears pressure early week below 3300⭐️GOLDEN INFORMATION:
Gold prices (XAU/USD) face renewed selling pressure, dipping toward the $3,320 level during the early Asian session on Monday. The pullback comes as June’s stronger-than-expected US Nonfarm Payrolls (NFP) report has reshaped market expectations around the Federal Reserve’s (Fed) policy path. Investors now turn their attention to the upcoming release of the FOMC Minutes on Wednesday for further guidance.
The US economy added 147,000 jobs in June, beating expectations and slightly up from May’s revised figure of 144,000. Meanwhile, the Unemployment Rate held steady at 4.1%. These figures reinforced the view that the labor market remains resilient, thereby lowering the odds of an imminent Fed rate cut. As a result, the US Dollar has strengthened, weighing on non-yielding assets such as Gold.
⭐️Personal comments NOVA:
Downtrend at the beginning of the week, gold price returns to accumulate below 3300
⭐️SET UP GOLD PRICE:
🔥SELL GOLD zone: 3337- 3339 SL 3344
TP1: $3328
TP2: $3312
TP3: $3300
🔥BUY GOLD zone: $3297-$3295 SL $3290
TP1: $3308
TP2: $3320
TP3: $3330
⭐️Technical analysis:
Based on technical indicators EMA 34, EMA89 and support resistance areas to set up a reasonable SELL order.
⭐️NOTE:
Note: Nova wishes traders to manage their capital well
- take the number of lots that match your capital
- Takeprofit equal to 4-6% of capital account
- Stoplose equal to 2-3% of capital account

SHORT ON BITCOINBITCOIN has continue to create lower highs at a major resistance zone.
I will be selling bitcoin looking to make over 8000 to 20,000 points.

BTC/USD Short Setup – Breakdown from Bear Flag Edge🚀||| 👆Your Boost is appreciated in Advance👆 |||🚀
Thesis: Bitcoin is trading within a well-defined descending channel, potentially forming a bear flag on the higher time frame. Price is currently hovering just below the key resistance zone near $108,600 (“The Edge”), failing to reclaim the upper boundary of the flag.
==================================================================
Entry: 🔻 Short at $106,850 – Price is rejecting the upper channel resistance and failing to break above “The Edge”
Stop-Loss: 🔺 $109,000 – Above the recent swing high and invalidation of the flag structure
Take-Profit 1: ✅ $104,700 🎯
Take-Profit 2: ✅ $102,400 🎯
Optional extended:
TP4: $98,000 – Full measured move of the flag breakdown
Risk-Reward Ratio: ~1:1 to 1:4 depending on target
====================================================================
#MJTrading
#BTCUSD #Bitcoin #CryptoTrading #ShortSetup #BearFlag #TechnicalAnalysis #PriceAction #MarketStructure #SwingTrade #TradingView

SHORT ON EUR/USDEUR/USD has a rising wedge within a consolidation zone.
The dollar looks like it will rise which will cause this pair to fall.
I will be selling EU looking to catch 150-300 pips this week.

SHOT ON GBP/CADGBP/CAD has given nice rejection from a major supply area.
There is lots of imbalance to the downside.
I will be selling GBP/CAD looking to catch 100-200 pips to the next demand zone.

SHORT ON EUR/GPBWe have a rising channel (bearish reversal chart pattern) at a major level of resistance (confluence)
Price has given us a breakout of the channel to the downside and is currently respecting resistance.
I will be selling EUR/GBP to the next support level looking to catch over 120 pips.

Gold prices continue temporary downtrend⭐️GOLDEN INFORMATION:
Gold prices (XAU/USD) came under renewed selling pressure during Friday’s Asian session, dipping to their lowest level in over a week, near the $3,344–$3,345 range. The decline was largely driven by the Federal Reserve’s hawkish tone, which emphasized persistent inflation risks and suggested a more gradual path to interest rate cuts—dampening demand for the non-yielding precious metal. Nevertheless, fragile market sentiment and a cautious risk environment may continue to lend some support to gold, potentially cushioning it against steeper declines.
⭐️Personal comments NOVA:
Selling pressure continues to maintain, pushing gold price down to 3304 today, the downtrend price line is maintaining well.
⭐️SET UP GOLD PRICE:
🔥SELL GOLD zone: 3418- 3420 SL 3425
TP1: $3400
TP2: $3382
TP3: $3370
🔥BUY GOLD zone: $3306-$3304 SL $3299
TP1: $3315
TP2: $3328
TP3: $3340
⭐️Technical analysis:
Based on technical indicators EMA 34, EMA89 and support resistance areas to set up a reasonable SELL order.
⭐️NOTE:
Note: Nova wishes traders to manage their capital well
- take the number of lots that match your capital
- Takeprofit equal to 4-6% of capital account
- Stoplose equal to 2-3% of capital account

SHORT ON USD/CADUSD/CAD has given a confirmation choc (change of character) from up to down on the lower timeframe (5min) from a MAJOR supply area.
I will be selling USD/CAD looking to make over 100 pips to the next demand level.

SHORT ON AUD/JPYAUD/JPY has given us a choc (change of character) from up to down at a major resistance zone.
I will be selling AUD/JPY to the next demand level looking to catch 100-200 pips

SHORT ON EUR/JPYEJ has created a (Rising Channel) with a (Double Top) at a major resistance zone.
Both Chart Patterns are Bearish Reversal Patterns.
I will be Selling EJ to the next demand level as it seeks out liquidity to the downside for 100-200 pips.
GBPUSD consolidates resistance zone and declinesPlan GBPUSD day: 16 June 2025
Related Information: !!!
The Pound Sterling (GBP) ticks up to near 1.3590 against the US Dollar (USD) so far on Monday, remaining inside Friday’s trading range. The GBP/USD pair is expected to keep trading within a tight range as investors have sidelined ahead of monetary policy announcements by the Federal Reserve (Fed) and the Bank of England (BoE), due on Wednesday and Thursday, respectively.
At the start of the week, the US Dollar Index (DXY), which tracks the Greenback’s value against six major currencies, edges down to near 98.00.
Investors will closely monitor the interest rate guidance from both central banks, while they are expected to leave those unchanged at their current levels
personal opinion:!!!
At the beginning of the week, there was not much important news. GBPUSD price was sideways and reacted to resistance and support zones.
Important price zone to consider :
SELL point: zone 1.35950
Sustainable trading to beat the market

Adjusted down 3385 at the beginning of the week⭐️GOLDEN INFORMATION:
Gold prices (XAU/USD) climbed toward $3,445 during the early Asian session on Monday, marking their highest level in over a month as mounting tensions in the Middle East and growing expectations of a Federal Reserve rate cut bolstered demand for safe-haven assets.
Despite stronger-than-expected US economic data on Friday, investors remained focused on geopolitical risks. The University of Michigan’s Consumer Sentiment Index for June jumped to 60.5, well above the consensus forecast of 53.5 and May’s reading of 52.2. However, markets largely shrugged off the data.
Instead, attention turned to the escalating conflict in the Middle East, where Israel’s recent strike on Iran has intensified fears of broader regional instability. In response, Iranian authorities warned they would “respond firmly to any adventurism,” reinforcing gold’s appeal amid global uncertainty.
⭐️Personal comments NOVA:
At the beginning of the week, gold prices adjusted slightly down, returning to the liquidity zone of 3385, before continuing the uptrend.
⭐️SET UP GOLD PRICE:
🔥SELL GOLD zone: 3462- 3464 SL 3469
TP1: $3450
TP2: $3440
TP3: $3430
🔥BUY GOLD zone: $3390-$3388 SL $3383
TP1: $3400
TP2: $3410
TP3: $3422
⭐️Technical analysis:
Based on technical indicators EMA 34, EMA89 and support resistance areas to set up a reasonable SELL order.
⭐️NOTE:
Note: Nova wishes traders to manage their capital well
- take the number of lots that match your capital
- Takeprofit equal to 4-6% of capital account
- Stoplose equal to 2-3% of capital account

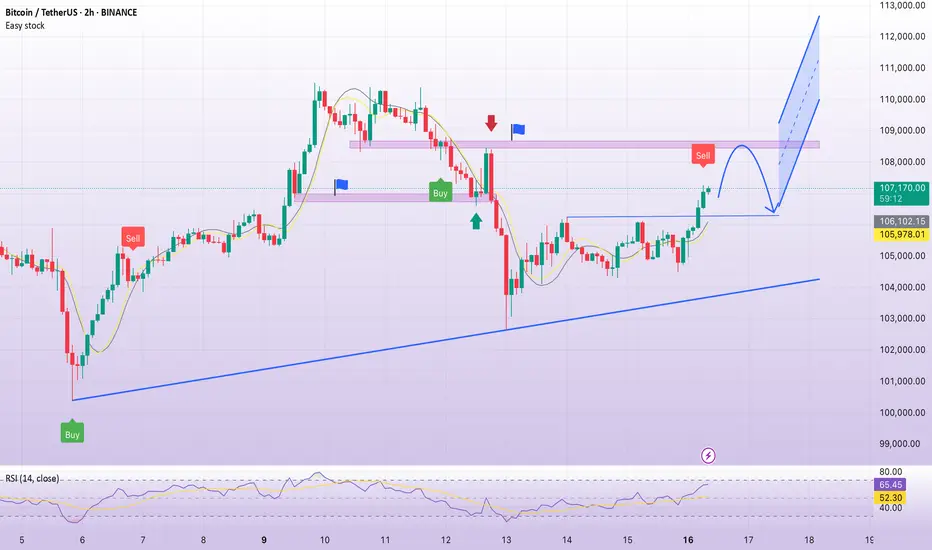
BTC accumulates, back to 108,500Plan BTC today: 16 June 2025
Related Information:
The price of gold is nearing its all-time high as tensions in the Middle East escalate, but analysts say they’re doubtful Bitcoin will do the same as investors prioritize other safe-haven assets.
The price of gold rose to $3,450 per ounce on Monday, just $50 shy of its all-time high of just below $3,500 in April, according to TradingView.
The usually slow-to-move asset has gained a whopping 30% since the beginning of the year, catalyzed by US President Donald Trump’s trade tariffs and, more recently, an escalation of military action in the Middle East following an Israeli missile strike on Iran on June 13, which caused Bitcoin prices to fall.
Gold prices have also been linked with inflationary pressures, as it is considered a safe haven and an inflation hedge by investors.
personal opinion:
The crypto market recovered at the beginning of the week after being affected by war news. It will almost certainly continue to maintain the 4.5% interest rate, so it will be difficult to break ATH this week.
Important price zone to consider :
Sell point: zone 108.400 - 108.600 SL : 109.100
Take profit : 107.900 - 107.000 - 106.000
Sustainable trading to beat the market