Selling pressure remains, gold price adjusts down⭐️GOLDEN INFORMATION:
Suki Cooper, an analyst at Standard Chartered, noted, “Gold is often seen as a liquid asset that investors turn to when they need to meet margin calls in other areas, so it's not uncommon for gold to decline following a risk event, considering its function within a diversified portfolio.”
On the data front, the US economic calendar showed a solid employment report, with private sector employers adding more than 200,000 jobs in March. Although the Unemployment Rate ticked up slightly, Bloomberg suggested this was “largely due to rounding.”
According to figures from Prime Market Terminal, money market participants have already priced in more than 1% worth of rate cuts from the Federal Reserve by 2025.
⭐️Personal comments NOVA:
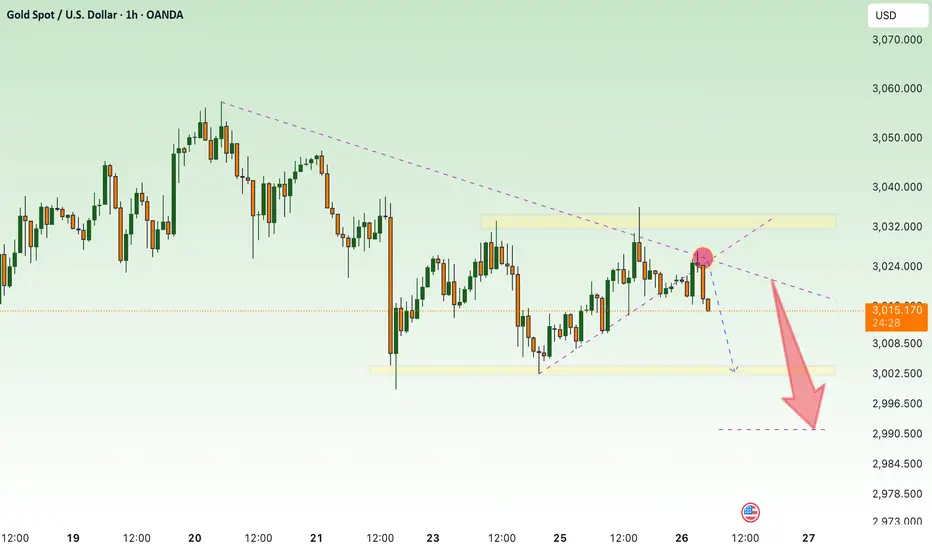
Short-term downtrend, disputed price zone 3054 - 2975. Gold price continues to adjust down at the beginning of the week.
⭐️SET UP GOLD PRICE:
🔥SELL GOLD zone : 3084 - 3086 SL 3091
TP1: $3070
TP2: $3055
TP3: $3040
🔥BUY GOLD zone: $2973 - $2971 SL $2966
TP1: $2980
TP2: $2990
TP3: $3000
⭐️Technical analysis:
Based on technical indicators EMA 34, EMA89 and support resistance areas to set up a reasonable SELL order.
⭐️NOTE:
Note: Nova wishes traders to manage their capital well
- take the number of lots that match your capital
- Takeprofit equal to 4-6% of capital account
- Stoplose equal to 2-3% of capital account
Shortsignal

Gold prices start to cool down - back to 3000✍️ NOVA hello everyone, Let's comment on gold price next week from 04/07/2025 - 04/11/2025
🔥 World situation:
Gold (XAU) prices deepened their decline on Friday, sliding to a seven-day low of $3,015 before rebounding slightly, after remarks from Federal Reserve (Fed) Chair Jerome Powell suggested that inflation may accelerate again due to the impact of tariffs. At the time of writing, XAU/USD is trading at $3,029, representing a 2.70% drop.
Market volatility persisted as tensions escalated in the ongoing trade conflict between the United States (US) and China. In addition, Powell dampened hopes for imminent Fed rate cuts, stating that tariffs are expected to affect the US economy by slowing growth and pushing inflation higher.
According to a Financial Times (FT) report, hedge funds faced their largest margin calls since the Covid-19 pandemic, triggered by President Trump’s Liberation Day announcement.
🔥 Identify:
The FOMO increase in gold prices is starting to show signs of stopping due to concerns about economic recession. Gold prices will continue to decline back to the price range below 3000, stabilizing the market again.
🔥 Technically:
Based on the resistance and support areas of the gold price according to the H4 frame, NOVA identifies the important key areas as follows:
Resistance: $3054, $3076, $3105, $3135
Support : $2998, $2953
🔥 NOTE:
Note: Nova wishes traders to manage their capital well
- take the number of lots that match your capital
- Takeprofit equal to 4-6% of capital account
- Stoplose equal to 2-3% of capital account
- The winner is the one who sticks with the market the longest

NF - Will gold prices continue to fall?⭐️GOLDEN INFORMATION:
Gold price (XAU/USD) finds it difficult to build on Thursday’s late recovery from the $3,054 region—its lowest level in a week—and comes under renewed selling pressure during Friday’s Asian session. The metal has dipped back below the $3,100 threshold in recent trading; however, the broader market backdrop still suggests caution is warranted before anticipating any significant correction from the record high reached just a day earlier.
⭐️Personal comments NOVA:
Waiting for gold price to react to decrease at trendline H1, still a downward trend, fear of trade crisis, world economy
⭐️SET UP GOLD PRICE:
🔥 SELL 3134 - 3136 SL 3141
TP1: $3125
TP2: $3110
TP3: $3090
🔥BUY GOLD zone: $3033 - $3035 SL $3028
TP1: $3045
TP2: $3060
TP3: $3075
⭐️Technical analysis:
Based on technical indicators EMA 34, EMA89 and support resistance areas to set up a reasonable SELL order.
⭐️NOTE:
Note: Nova wishes traders to manage their capital well
- take the number of lots that match your capital
- Takeprofit equal to 4-6% of capital account
- Stoplose equal to 2-3% of capital account

SHORT ON AUD/NZDAUD/NZD has given a perfect setup for a sell.
I has bearish divergence as well as a rising channel/wedge into a Major Supply Area from the Higher TF.
We have also change structure from Up to Down on the Lower Timeframe.
I will be selling AUD/NZD to the pervious swing low / demand area for about 100 pips. OANDA:AUDNZD

ALPHA - Nice Signal/TA.Those Levels played out beautifully.
i expected 2 %
7,5 % 🎯 👌
after that clear rejection, should let it run ....
Retracement to Golden Pocket and then BOOOOM ...🎯 👌
Here the original Signal/TA :
Follow for more ideas/Signals. 💲
Look at my other ideas 😉
Just donate some of your profit to Animal rights and rescue or other charity :)✌️

Will APTUSDT Bounce or Break? Last Chance for the Bulls?BINANCE:APTUSDT.P
🚨 APTUSDT is sitting at a crucial level. After multiple CHoCH and BoS signals, price has dumped into the key Demand Zone (PDL) . Now it’s either a spring up or a deeper dump to the next liquidity zone.
📌 Technical Outlook:
CHoCH → BoS → Liquidity Grab: Clear bearish structure.
Equilibrium broken: Bulls failed to hold control.
Now: Price is testing the blue Demand Zone (PDL) with big orders possibly resting.
🎯 Trade Plan:
Scenario 1: Long from support zone
Entry: bounce from 5.45–5.50 USDT
Stop-Loss: under wick low at <5.38 USDT
Take-Profits:
TP1: 5.70 USDT
TP2: 5.90 USDT (Equilibrium zone)
TP3: 6.00–6.15 USDT (Imbalance + Premium zone)
Scenario 2: Short after PDL breakdown
Entry: break and retest below 5.45 USDT
Stop-Loss: above 5.55 USDT
Targets:
TP1: 5.20 USDT
TP2: 5.00 USDT
📊 Confluence Factors:
Volume spike = buyer activity
Local CHoCH inside zone = reversal signal
Strong impulse down may sweep liquidity
💬 Final Thought:
APT is at a pressure point — it’s spring or capitulation. Clear setup, no tilt.

ENA - Beautiful Easy Signal/TA.signal was given hours ago to my group.
Easy instant money 3.5% 🎯 👌
The new blue marked daily level is another level.
If it breaks (volume TA too), then Short the sht out of it ...
Follow for more ideas/Signals. 💲
Look at my other ideas 😉
Just donate some of your profit to Animal rights and rescue or other charity :)✌️

LINK - Excellent Signal yesterday.Look at what i wrote about OBV line in previous TA.
OBV Broke the line and jumped in short.
Almost 9% till now 🎯 👌
BOOOOOM ... !
Look at original Signal from yesterday :
Follow for more ideas/Signals. 💲
Look at my other ideas 😉
Just donate some of your profit to Animal rights and rescue or other charity :)✌️

AAVE - Amazing PERFECT Signal/TA YesterdayBOOM. 9 % 👌 🎯
Original TA from yesterday :https://www.tradingview.com/chart/AAVEUSDT.P/M3HGP1df-AAVE-Possible-Good-Short/
Follow for more ideas/Signals. 💲
Look at my other ideas 😉
Just donate some of your profit to Animal rights and rescue or other charity :)✌️

ETH - Nice Prediction I was expecting a drop. The drop was forming as "3 Fan Principle". The perfect FP didn't happen but the drop was expected. BOOM the drop.
Almost 7% an going on ... 🎯 👌
Original TA here:
Follow for more ideas/Signals. 💲
Look at my other ideas 😉
Just donate some of your profit to Animal rights and rescue or other charity :)✌️

BTC - Wonderful Prediction. What a Signal/TA :)my Last Words : " A break out downward from grey lines would be more natural regarding Volume."
That natural move happened :)
What a nice prediction.
Even retested the grey line and blue box.
Original TA here:https://www.tradingview.com/chart/BTCUSDT.P/UGWDDY3U-BTC-New-Local-TA/
Follow for more ideas/Signals. 💲
Look at my other ideas 😉
Just donate some of your profit to Animal rights and rescue or other charity :)✌️

XRP - Excellent Signal/TA days ago. Look at Now.I gave the TA/Signal 3days ago.
Wrote "Short the sht out of it" .
Now : 13 % 🎯 👌 until now an ongoing.
Original TA here:https://www.tradingview.com/chart/XRPUSDT.P/V6Skh0wm-XRP-Looks-Bearish/
Follow for more ideas/Signals. 💲
Look at my other ideas 😉
Just donate some of your profit to Animal rights and rescue or other charity :)✌️

LINK - Nice Levels for Short Soon !OBV :
i wanna see a nice break out from white line or even better from pink line and retest.
Often OBV breaks out before price, which is a nice indication.
Chart:
I wanna see a nice break out from that void line (which is the previous POC too) and from blue trend line.
EYES ON ....
Follow for more ideas/Signals. 💲
Look at my other ideas 😉
Just donate some of your profit to Animal rights and rescue or other charity :)✌️

FET ANALYSIS🔆 #FET Analysis : Breakdown
📊As we can see that #FET is following ascending channel on 4hr time frame. There is a breakdown in #FET and if it sustain this breakdown then we would see a dump first then a pump.
⁉️ What to do?
- Keep your eyes on the chart, observe trading volume and stay accustom to market moves.🚀💸
#FET #Cryptocurrency #ChartPattern #DYOR

MANA - PERFECT SIGNAL. OMG! That level was magical.1- I gave a blue box on 16th March and i wrote :
" There are some bullish divergences in Volume in 2h+.
Even daily Volume is really bullish.
We may have missed a Long opportunity. But a Short at those marked Levels are reasonable! "
We were waiting for that level .
That Level gave us really nice 7 Shorts.
2- Original Signal was here 16th March:https://www.tradingview.com/chart/MANAUSDT.P/adttA7xG-MANA-it-looks-bullish-regarding-Volume/
3- Days Later these nice 4 Shorts happened:https://www.tradingview.com/chart/MANAUSDT.P/7BnxvY62-MANA-Beautiful-Signal-4-Trades/
4- On 20th March i gave 2 new Levels (void lines).
OMG ! To The Fcking Point. Sniped
Look how that upper grey trend line played out too.
6 % 👌 🎯
4.6 % 👌 🎯
5.5 % 👌 🎯
Follow for more ideas/Signals. 💲
Look at my other ideas 😉
Just donate some of your profit to Animal rights and rescue or other charity :)✌️

ENA - What a Beautiful Signal/TAI gave a signal in group (forgot to share here in TV :/ )
Short gave almost 7% 👌 🎯
Follow for more ideas/Signals. 💲
Look at my other ideas 😉
Just donate some of your profit to Animal rights and rescue or other charity :)✌️

SHORT ON US30US30 Has given a change of character (choc) on the 4hr TF indicating the end of its uptrend pullback on its overall downtrend.
I will be selling US30 to the next level of demand looking to capture over 1000 points.

continue downtrend , GOLD⭐️GOLDEN INFORMATION:
Gold price (XAU/USD) holds steady above the key $3,000 level for the second consecutive day on Wednesday, though it struggles to reclaim the previous session’s peak. Ongoing uncertainty surrounding US President Donald Trump’s proposed reciprocal tariffs set for next week continues to bolster demand for the safe-haven metal. At the same time, the US Dollar (USD) remains under pressure following Tuesday’s weaker-than-expected macroeconomic data, providing additional support for gold’s upward momentum.
⭐️Personal comments NOVA:
Gold price continues to decrease, around 2990 - 3000
⭐️SET UP GOLD PRICE:
🔥SELL GOLD zone: $3039 - $3041 SL $3046
TP1: $3030
TP2: $3020
TP3: $3010
🔥BUY GOLD zone: $2992 - $2990 SL $2985
TP1: $3000
TP2: $3008
TP3: $3018
⭐️Technical analysis:
Based on technical indicators EMA 34, EMA89 and support resistance areas to set up a reasonable SELL order.
⭐️NOTE:
Note: Nova wishes traders to manage their capital well
- take the number of lots that match your capital
- Takeprofit equal to 4-6% of capital account
- Stoplose equal to 2-3% of capital account
SHORT ON NZD/JPYNZD/JPY Has rejected a major resistance area and is breaking structure to the downside.
The JPY index is looking strong from a major demand level. XXX/JPY pairs do the opposite of whatever the index does.
Therefore I will be selling NZD/JPY looking to catch over 200 pips easy.

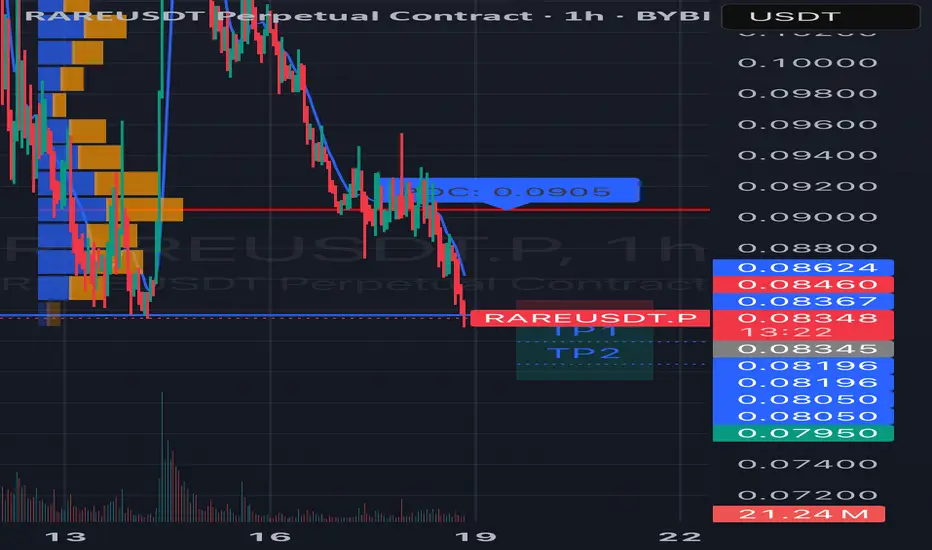
#RAREUSDT continues its downtrend📉 Short BYBIT:RAREUSDT.P from $0,08345
🛡 Stop loss $0,08460
🕒 1H Timeframe
⚡️ Overview:
➡️ The main POC (Point of Control) is 0,09094
🎯 TP Targets:
💎 TP 1: $0,08196
💎 TP 2: $0,08050
💎 TP 3: $0,07950
📢 Monitor key levels before entering the trade!
BYBIT:RAREUSDT.P continues its downtrend — watching for further movement!
SHORT ON GBPUSDGBPUSD has reached a key supply area and has given a change of character from up to down on the hour timeframe.
There is plenty imbalance/fvgs to the downside that I expect price to go and fill.
The Dollar Index is currently shifting to up from down, this should aid in this pair falling.
I will be selling GBPUSD to the next demand level for 300 pips.

#1000RATSUSDT maintains bearish momentum📉 SHORT BYBIT:1000RATSUSDT.P from $0.01823
🛡 Stop Loss: $0.01855
⏱ 15M Timeframe
✅ Overview:
➡️ BYBIT:1000RATSUSDT.P is in a downtrend after rejecting the descending trendline, confirming buyer weakness.
➡️ Volume Profile suggests that the main liquidity (POC) is positioned at $0.01938, reinforcing selling pressure.
➡️ The Head and Shoulders pattern strengthens the bearish case, and a break below $0.01823 will trigger further decline.
➡️ The main downside targets are in the $0.01800 – $0.01764 range, where profit-taking may occur.
⚡ Plan:
➡️ Short entry upon breaking $0.01823, confirming the bearish scenario.
➡️ Stop-Loss at $0.01855—placed above the nearest resistance to minimize risk.
➡️ Main targets: $0.01800, $0.01780, and $0.01764, where downside movement may slow down.
🎯 TP Targets:
💎 TP 1: $0.01800
🔥 TP 2: $0.01780
⚡ TP 3: $0.01764
🚀 BYBIT:1000RATSUSDT.P maintains bearish momentum — expecting further downside!
📢 BYBIT:1000RATSUSDT.P remains weak, and a breakdown below $0.01823 could accelerate the decline.
📢 Watch for price reactions near $0.01764, where a slowdown or bounce may occur.

TONUSDT: Bearish Setup or Bulls' Last Stand?
Hey, traders! 😱📉 BINANCE:TONUSDT.P is in a high-risk zone, and the market is tense. We see the price testing support at *3.6191 USDT*, while resistance at *3.6891 USDT* is keeping the pressure on.
The classic scenario: if support fails, we could see a sell-off. But what if the whales are lurking, ready to turn the price around?
🔑 *Key Levels:*
*Support:*
*3.6191 USDT* – bulls are defending this level aggressively.
*3.0087 USDT* – deep liquidity zone, where the price could drop if support breaks.
**Resistance:**
**3.6891 USDT** – if sellers hold this level, the downtrend continues.
**3.8000 USDT** – a breakout above here could mean a bullish reversal.
🚩 *Trading Strategy:*
*Short Entry:* After breaking *3.6191 USDT* with a retest.
*Stop-Loss:* Above *3.6891 USDT* – if bears are wrong, it's time to exit.
*Profit Targets:*
*3.5000 USDT* – quick scalp target.
*3.3000 USDT* – solid take-profit zone.
*3.0087 USDT* – full breakdown potential if panic selling intensifies.
📈 *Technical Analysis Insights:*
Sellers are dominating – market structure remains bearish.
Volume shows liquidity accumulating in this range.
If we see a bounce from *3.6191 USDT*, a short squeeze could trigger a sharp move up.
💡 *What to Watch For?*
*Manage risk!* A downtrend doesn’t mean going all-in.
*Wait for confirmation!* No clear break = possible liquidity grab.
*Watch volume!* False breakouts are common without strong volume support.
Is BINANCE:TONUSDT.P about to dump, or will bulls hold the line? Share your thoughts below! 🧐🔥
