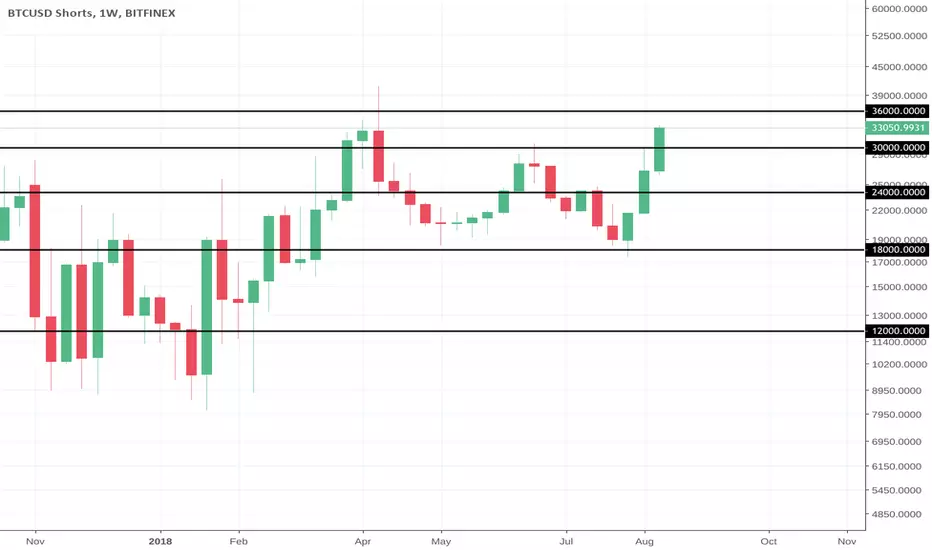
BTC SHORT LIKE A BOSS, OR FAILING THAT,... FAILwe are well into the area of stupidest place to initiate a short position, yet the shorts have shown up in record numbers.
the pain cannot be far off.
#FAIL
Shortsqueeze
BTC SHORT SQUEEZErecord short positions with massive bullish divergence.
hold on to your space lunch!

[TRX Analysis] Where is the herd?
There are four levels that I am currently watching on TRX/BTC chart on the weekly.
In anticipation for the founder of Tron Justin Sun's "secret announcement" the market has seen a minute short squeeze. Justin Sun has switched his normal spam like tempo to one of more hush and lull leading up to this announcement. With its new found spot light on futures trading site Bitmex.com there is potential for short squeeze to occur from over leveraged short positions. If this plays out I am watching these levels as resistance to the trx bulls. Over 36 exchanges have integrated withdrawals and deposits of the Tronix coin from its ERC-20 token migration. Ledger nano has also begun accepting the coin for cold storage security. Does the herd value trx enough to place their coins under cold storage, time will tell. But scarcity and liquidity deems themselves important in positive price action.

$XRP - Massive amount of shorts for Rocket Fuel$XRP is currently sitting on a support line with Bullish Divergences on the 4HR.
On the 1D we are also way oversold as XRP has just been punished in this Bear Market.
What's more insane to me, is the crazy amount of Shorts that have currently built up on XRP which could provide a massive short squeeze launching the price.

BTC SHORT = FUEL FOR BULL MARKETshort positions are still in denial of bull market and I would expect them to be even up to $10,000.
possibly when bitcoin passes $10,000 the non commercial shorts will take notice.


Is TDOC a takeover target of AMZN?For all fundamental reasons the success of Teladoc is noble but you can see from this accumulation/distribution chart that someone is heavily accumulating the stock. There are multitude of reasons this could be happening. One super exciting and others very typical of trading in growth companies.
So let's start with my far flung idea. Amazon is pushing aggressively to get into the healthcare space. There was talks of Amazon buying a large insurance provider such as Aetna. A much more reasonable acquisition, and one that would be the perfect fit to stair-step them into the space is Teladoc. Teladoc conducts medical exams entirely online and over the phone. They boast almost 20 million customer accounts around the world and have an opportunity in the U.S. alone to do at least 75 times their current volume of consultations. What better place for people to find that than the Wal-mart of the online world. Amazon. For that matter if Wal-mart took notice they would also be a suitor.
Catalyst 2: Short interest. For a long time short traders were rooting for Teladoc to fail because they were spending heavy to acquire competitors and pushing growth over all else. Well those bets have not paid off at all. As a matter of fake with an estimated 38% of the float short we could see a short squeeze for the record books playing out before our eyes.
Catalyst 3: The future prospects for TDOC without it being sold. Even with no buyer TDOC has grown over 100% this year with their own internal marketing push and the acquisition of their second biggest competitor. They are insurmountably the leader of the pack in tele-medicine. They are the uber of doctors if you will. They are in the critical mass stage. Twenty million customers turns into 50 million real fast when people start to tell their friends how their doctors 'visit' fell from $160 to $40. There is no doubting it is a disruption of the mega status quo and several of those companies have gone on to be worth 60-100 billion dollars. That is a 30x-50x from today's 3.8 billion dollar value.
*** These opinions are my own and not meant to be financial advice. I am currently long TDOC calls.

ETHUSD SHORT again at ATH, short squeeze likelyTL:DR - Set up for another short squeeze as fear overcomes the market.
This is the ETHUSD SHORT graph with 1 D candles. Anyone feeling deja vu? Because I sure am. When Ethereum went from $574 down to $492 on 5/28/18 we saw an all time high interest in shorting Ether as seen in the first blue oval. If you read my post here you'll see I called for a short squeeze with subsequent bullish price action. We then got just that as priced rallied from $512 to a local high of $620. Unfortunately that is where momentum stopped but I was able to get one good trade out of that price action.
Today we again see all time high interest in shorting Ether with a parabolic rise in the number of open shorts as indicated in the second blue oval. Price looks again to be well set up for a bullish short squeeze. Generally, the ETHUSDSHORT graph seems to spike AFTER price has made its biggest move downward.
Now, price does not HAVE to go up and history does not HAVE to repeat itself but this chart to me looks like another short squeeze is imminent. It is very possible price collapses even further before any sort of short squeeze occurs. But as I said in my post yesterday I am long from $451. I have a stop loss around $430 and my target is about $530.
***This is not investing advice. I am not an investing professional. Do not invest what you cannot afford to lose. All investors should seek guidance from licensed financial advisers and not random people on the internet.***

Litecoin Short Squeeze Incoming?BITFINEX:LTCUSDSHORTS
Litecoin Short Squeeze incoming or further into over bought conditions?
Analysis: Double top in progress with TD Sequential passing a 9.
Level to watch: 136,000
Prediction: Shorts about to get wrecked.

BTCUSDSHORTS: UPDATEUpdate on the "TA doesn't work" chart I did for the shorts. Put my expected target (pink FIB.) Hoping it gives us a better squeeze on BTC, hasn't been to impressive thus far.

Possible short term trade / short squeezeShorts are ramping up again and a squeeze could be in order. Keep in mind this is a counter trend trade so don't expect this to go beyond previous highs.
What I would suggest is look for an entry in the 397 to 414 range and aim for 580 as profit target.
This is a high risk trade.
Other indicators are also looking ready for a squeeze, it could take another 1 to 3 days before there is enough build up selling pressure to squeeze.
-RSI is almost below 30, aiming for 25-26 ish.
- Up trend line is in the 400 area
- MACD bearish
- Buyers have left the space looking at the DMI, needs a bit more selling pressure. It's currently at a 9.1 (green line) and would like to see it at 7.8 or 8.
- Shorts are high.
This is no exact science and lots of selling pressure could send us tumbling through the uptrend line etc, because we are still in a bear trend. So instead of placing limit orders right now and hoping for the best, it probably is a good idea to set an alarm at $432 ETH and look at the price action from there. If you see buyers returning on a smaller timeframe (1H for example) then a swing trade long could be in place. Be careful out there ;)

BTCUSDSHORTS: Data says squeezePulled some data on BTC shorts. We could have quite a BTC pump if we get a short squeeze. It's already taking off and no short squeeze yet. This could make us launch above 8k. Hopefully this helps give an idea of where to expect RSI to stop as well.

SGYP Is Setting Up for A Big Move!SGYP seems to be setting up for a big big move. The Squeeze Momentum Indicator has been forming a triangle which is now about to close and the crosses in the indicator have been black for some time meaning that a release of the squeeze should be about to manifest. My guess is that spike will be to the upside, and it could go as high as 3.60$ (90%+ appreciation), which is the 0.382 retracement level of 17's highs and the 1.618 retracement level of this year's highs.

CHKE Very Strongly Oversold CHKE a marketer and manager of fasion portfolios of fashion brands, its brands are licensed with retail and wholesalers in 50 countries and about 9000 retails. After reaching a high of $29.75 in the summer of 2015 it has dropped to a low of $.65. Looking at the company financials reveals possible under evaluation by the market. With a market cap of about$13mil and an enterprise value (MRQ) of $56mil, total assets of $103.597mil and a new deal with Bearpaw Holding CHKE could be on its way back up. In the last 3 weeks we have seen CHKE spike to $1.30 and retreat. A break through of $1.30 could create a large move to the upside and we saw an all time high on volume two days ago. Watch this for a strong move to the upside, possible short squeeze.

SNAP long NYSE:SNAP , 4h and 1D close about key resistance can skyrocket SNAP higher (high short interest). Resistance at $12, next target at $14 (20%). No 4h candle close above $12 = no entry.
The Citron report will add some fuel for the longs: money.cnn.com

[ETH] Open Eth Short Positions Indicate Potential Short Squeeze The purple line is the ETHUSD price overlayed short volume in the last 9-10 months
Looking at ETHUSDSHORTS which shows the amount of Ether used for open short positions on Bitfinex has spiked enormously in the last couple days. This charts data, going back nearly a year, clearly show us that there is a huge amount of Ether that has been "artificially" taken out of the market in just the last few days, not to mention the last couple weeks.
Those Ether need to be brought back into the market whether the short sellers want to or not. Of course we know exactly how powerful the uncoiling of a short squeeze can be if we look at early April on Bitcoin charts.
There does need to be a catalyst that eventually breaks the camels back and triggers the buybacks of all those Ether. Could happen on just a small move upward setting off a chain reaction. Some fundamental news could drive bulls to trigger the squeeze also. Bullish stock market moves after a long weekend in the US could contribute to that tomorrow.
We could also see some more sideways or slow upwards grind in ETH price over the next few days which would most likely look very choppy and untradable in terms of TA as shorts slowly close out and eventually high volume liquidation prices trigger, sending price upwards.

"What if?" scenario. What if a Short Squeeze hadn't taken place?In April 12th Bitcoin's price shot from 6.8k to 8.1k in less than 10 minutes. I remember waking up, since it was 7 am where I live, looked at the price and was surprised to see a sudden drop from ~7k to ~6.8k. I went to the kitchen and started my coffee, took the dog outside, came back and turned the computer on. It light's up in less than 30 seconds. Cryptowat.ch is my homepage so when I hit Chrome, not ten minutes after getting out of bed, the price was at 7.9k. I thought the cache was bugged or something so I loaded up Coinmarketcap. I couldn't believe it. Luckily I had a Long order open since 6.1k and rode that bitch up. I was expecting just another Pump/Dump scheme since those had been happening quite regularly (price shotting up in a 5 minute candle, going sideways for hours and then slamming down). That and the fact we were still in a bear market made me use my gains from this move to open up a short. We were in the 6k's for days, weeks, with no relevant movement other than the fucking PnD's. Opening a short at 8.1k was awesome. And a mistake. This crazy rise wasn't a pump; it may have ~started from a pump~, but Short's stop-losses started to get triggered, creating buy orders, and a domino effect ensued. We had the opposite of a flash crash. All was fine until then, since we were still in a bear market I expected the price to eventually drop again. But then something weird started happening. People started calling "the bulls are back" like crazy. People FOMO'd in like crazy. I remained skeptical, waiting for the dump. It never came, and the price just kept rising. Make no mistake, the amazing rise from 6.8k to 10k was mostly fueled by FOMO created by the Short Squeeze, and the Short Squeeze was probably caused by one of those Pump/Dump schemes, but it finally had an irreversible effect: indirectly caused major FOMO.
So, after thinking all this through in the shower today, while I was watching the price slowly going down from 10k to 9k, I wondered: "What if that fucking Short Squeeze never took place?"
So very rudimentary, I took a graph and "blanked out" the Short Squeeze candle, and dragged the price down accordingly. This "vision" does NOT account for the FOMO generated by eventual buy orders that ensued in rallies AFTER the ShortSqueeze. The price would be around 8200.
Had that not happened, I believe the price would still be struggling to break 7k, and would've possibly plummeted down to 5k, after finally breaking the major support in the 6k area. There, at 5k, a reversal would probably take place and price would slowly crawl back to the 6k's for probably weeks, maybe months, as people kept losing interest. That would be the "Early Accumulation" phase that starts coinciding with "late distribution" on bear market cycle and starting a new bull market cycle.
Since that's not the scenario and the Short Squeeze took place, we could very well already be in "Mid-Accumulation", where we have a Markup (a fast rise in price, but even for Crypto a jump from 6.8k to 8.1k happened ~way too fast~) and the price starts making higher lows and higher highs.
But.
We just witnessed a rejection at the 10000's, a big psychological barrier (it wasn't during the bullrun because hype was so big and buyers were so many that this barrier was just trampled; this is not the case now as way less people are interested in Bitcoin). Bitcoin shyly touched it and the zombie hungry bears came back, causing the price to drop ~10% in a day. I believe the Short Squeeze's effect didn't anticipate Mid Accumulation. I believe it just triggered another bull trap. Traps happen on FOMO rallies, and I'm fairly sure that is what happened. And I honestly believe this could cause the bubble pop/crash to continue to where it should've been, possibly even lower.
Get your fiat ready to buy the lows. 6000's offered great support and a bounce is expected there. Ride it up, close your long and wait it out.
Image for What If Scenario in comments.

AMD mid-term fundamental and technical guidance There is no doubt AMD under the leadership of Lisa Su and the advantages of its IPs is on track for high growth by gaining market share on Intel and staying relevent if not competitive against Nvidia. AMD's P/B ratio is significantly lower than similar stock and PE ratio is also lower than the average in the industry. AMD also sees very high revenue growth as well as earning beats and guidance beats above industry average that are likely to continue due to its robust product refreshes. With that said, lets look at the technical.
AMD has been oversold due to crypto scare and stock downgrade manipulation, which allows for a significant upside for the undervalued stock and allows for an incredible upside. The recent gains also provides a great entry point as the bull trend is established after the amazing Q2 earnings and a break out looks ripe.
Range bound analysis sees an immediate resistance above 13$ at the downward trend line(last ditched effort for shorts), but a more than likely blowout Q2 announcement around end of july will crush that bearish bias and squeeze the shorts to test the recent highs around 15.
15 would be a fair value for AMD by the time Q3 comes out(provided with a decent market sentiment). More than a 30% upside for those with the patience. At least a 15% upside to 13$ in the near term.
Disclosure: I doubled my money with call options bought before Q2 after losing 30% by buying before Q1. Has a mixed portion of stock and options now.
Suggested strategy: Sell the stock and buy options when AMD stock dips and sell option to buy stock as AMD rally to major resistance levels.

ETHUSD: The Little Bull That Could Pt. 2If you have read Pt. 1 of the series, you have seen that my ETHUSD price prediction has been fairly accurate. We bounced around $600 and have found mid term support in this area. The volumes are fairly healthy too, which is a good sign for longs.
I have been reading a lot of other traders' analyses and have noticed that there is a general consensus on a few ideas.
1. The price will fall over the next few days. Traders are predicting the price to fall below $600 but there is no agreement where the next support would be.
2. Long term, the price will surpass the previous ATH.
3. There is a large amount of manipulation in the market.
I've taken these three ideas to come up with the following conclusion: ETHUSD will not fall below $600 again.
There are a lot of ideas here on trading view predicting that the price will continue to drop. The ETHUSD Shorts chart I referenced in Pt 1 of this post shows there are a large amount of people in short positions. Whales and manipulators will see traders predicting a price drop, buy the shares that are being sold because of these posts, and therefore forcing shorts to cover their positions. What happens when a trader covers a short? A SHORT SQUEEZE! Take a look at the hourly chart above. We have maintained steady support above $600 and in the last hour, we saw an unexpected burst of buying which drove the price above $640. As I type, the price is getting pushed higher on fair volume. As more shorts scramble to cover their positions we will see ETHUSD continue to climb. Where will it stop? My guess is the next resistance level, around $850. Because so many predict that the price will surpass the previous ATH, I predict we will see the price push past the $850 resistance. If we can overcome that resistance, ATH will be inevitable.
Regardless, I think this is a great scenario for longs. Good luck and happy trading!

BTCUSD: Squeeze Is Just Beginning. Waiting For A Retrace.BTCUSD update: Now you know what a short squeeze looks like. After the inside bar long trigger at 6900, price climbed dramatically and took out the 7492 level within hours. In that same move, price compromised the bearish trend line that has been intact since the beginning of this year. The swing trade that was called on S.C. reached its target for a 560 point profit.
Andrew pointed out that short interest has been at extreme highs for at least two weeks now and this is the fuel that drives the squeeze once it triggers. The herd, which is always wrong at tops and bottoms, was short at the bottom. Stop orders and margin liquidations on top of new buyers jumping in are driving price into the next resistance zone as I write this.
This is the type of price action that signals the bulls have taken control. The 7490 level was the .382 of the recent bearish swing which helped to define that bearish momentum was intact. That level was blown through the second time price tested it. The next important level was the bearish trend line in the 7800 area which was also blown through. These are the confirmations that I look for to indicate a trend reversal is in effect. What does all this mean? On pullbacks, support is more likely to hold and resistances more likely to break.
The 8091 to 8543 resistance zone (.618 of recent bearish swing) is a minor area but within it, the 8442 level is the .382 resistance relative to the broader bearish structure measured from the 11549 high. If price pushes this level, that is further confirmation that the next retrace should lead to a higher high and will serve as a high probability buying opportunity.
Where is a reasonable area to anticipate a retrace? The 7076 to 6815 minor support zone (.618 of current bullish swing). That is the area we will be looking for reversal patterns for another swing trade long.
In summary, we have been writing about bullish signs for weeks and have been maintaining long inventory as well (go back and read all the reports). Remember this market has been sitting in the largest support zone relative to the entire bullish structure up to 20K. The chances of it finding support and developing a bottom are high and now it is starting to unfold. Bottoming is a process, and this impressive squeeze is the initial move that establishes a broad double bottom. If you missed the move, there is no need to feel bad because there are always more opportunities. Keep an eye on S.C. because when we call the next swing trade, the details will be there.
Questions and comments welcome.

BTC, I calling a mad Bullish scenarioG'Day Cobbers,
This is my latest update, If this comes to fruition, you will be glad you came across this TA today. Shorts at a massive ATH so much liquidity, I think my charts speaks volumes in itself, so take a look, do some of your own TA and make a call. Im laddered in down to 6400 but be careful, anything under that is extremely knife edge as it will push us under the triangle structure but be aware the big boys may squeeze out all the high leverage longs and trap even more shorts by creating a bear trap outside this structure. This is why this is a zero sum game, this is where you put on your big boys pants and stand by your call, dont risk more than you are willing to lose and for the love of koala shit, don't come fomoing in and blame me if a) you scare easily and pull out at a loss or b) this goes completely goana balls bad and we drop even further. We are playing a game of probablilties with people with lots of experience and lots of capital to back them, we may get lots of push back by shorts well and truly underwater.
Good Luck my friends, lets hope it works out well.
G'day
Thanks for dropping by, hopefully you garner something valuable from my post, be it educational or an idea towards a trade of your own. Please share, like and comment and engage with me, I am here to help.
Trader, Chart analyst and all round larrikin. Reside in NQ Australia, surrounded by Crocodiles, snakes & giant spiders, not to mention the boxing Kangaroos and devilish Drop bears. It makes my job quite hazardous but strewth mate, I love it.

BTC Short Chart... History repeating itself? This is for educational review. This is not financial advice.
Wanted to show that a short squeeze can move the price up impulsively on the flip, but doesn't indicate a bull market. More likely just the big boys taking retail heroes money who don't have enough margin to cover shorts. Everyone was eyeing 7500 as a stop loss but the real stop loss is at nearly 9K before we reach meaningful levels. Got to have deep pockets to play in the range we're in now, unlike 10-20K.
M

Short Squeeze for the Treasury bearsTypically I have seen that when everyone is on one side of the trade its quite easy for the market to make fools of the participants.
The speculative short position on US treasuries, specifically the 10 year, is massive (and for good reason).
While I remain a longer bear view on these treasuries I think we might end up seeing a short squeeze before we see 3% yields.
The 10 year is showing some signs this could accelerate and hurt alot of bears who need to cover their positions.
