Is a good long position happening?First of all. I believe the general trend will not change for several weeks. This is just a short-term opportunity. (check Related ideas)
I expect the yellow trend line to be broken by tomorrow. The price could rise to around 37.5 K
however, if it is broken from below. A hard fall is likely
Shortterm

EURNZDEURNZD
This trade has broken away from its correlations to GBPAUD and EURAUD preforming as one of the best pairs in the last 24 hours.
This was to to an inefficient price rise that seen EURNZD rise above its efficient range. For the next moves in this pair and its correlations we look to sell those corresponding trades.
For the EURNZD we are looking to take a sell trade back to the bullish area of the top of the efficient range. Price action at this level will give us further information on price reversing bullish or remaining bearish.

HINDOIL EXP (209) Can be a Good bet for Med-Long termHINDOIL EXP (209) chart looks strong - this could be a Good bet for Med-Long term as it's heading to 400++ levels
Do your own research before investing.

Possible BTC Short Term Breakout Soon It looks like BTC has bounced back up quite fast, and its possible it could have enough momentum to break out of this falling wedge pattern. If it does, I could expect BTC hitting resistance around 33k price range.

Bitcoin - Can we expect a short term bounce now?Traders,
Here's what you can prepare for short-term, mid-term, and some potentials for the longer term as well.
- Stew
*Note: TV subs, I have trouble streaming to this portal. If you watch my videos exclusively on TV, you may be missing context.

AVAX APPROACHING TO ITS REVERSAL ZONE.avax is dropping for past few days . it can rise now .
the price can go up right now from here <
the price can go a little dipper to green zone and then rise .
current price is a good price to buy < if it reaches 22-21.5 it is much better opportunity of course.
you can say your opinion about this .
hope you like everything about trading like me .

BTC Small movement | Short TermA small move, The downward trend continues...
Once established in this area, we should be ready to test 28,400.

BTC Dump (This breakout is fake) | Short TermThose who sell sooner will lose less
Just sell it sooner, tether dominance is scary...

DOT TA - Short term Trade HIGH Risk Reward Ratio 2h timeframeI opened a Long just few minutes ago. Let's see what will happen 🚀. Just remember: Stick to your plan and have a good risk management 👍
And that's the main reasons I decided to take a long on SOL :
► Bounce from the 0.618 fib level
► Retrace from the support line (yellow)
► Confirmation on the breakout (yellos)
► Momentum is shifting up
► High risk reward ratio
Trading setup:
Entry: $9.49
SL: 9.2
TP1: $10.59 (60% of position)
TP2: $11.8
⚡Just to notice. We are right now in a very volatile market phase in the crypto. Crazy and unpredictable things could happen. That's why you should use a stopp loss. ⚡
Disclaimer: DYOR. No financial advice. Just for your impression.

DXY Possible Short term Reversal Its quite odd that DXY is forming a bullish flag pattern coming from a downtrend channel, usually bearish flags would cause higher lows and higher highs in such cases but right now it seems to being doing the opposite. Last time DXY created a bullish flag was when it pumped on may 4, here we are seeing a sort of similar play where it has bounced from the same support on the RSI, as well broke through the trend line resistance on the RSI. If DXY breaks out of the flag pattern to the upside, we could be looking at a upward price action for short term.

DE40 Shortsmall picture trade idea, which could turn into big picture trade idea of Weekly trend in the DAX.
Please see my DAX Longterm downtrend idea.

Cup and Handle Ideal on Axs After some downside for weeks , #Axs has now formed Cup and Handle pattern on 1 hrs TF , pattern goes invalid if there is a close below 15 mins close at 18 usd

HDFCLIFE showing strength from here.Expecting some good moves from here in #HDFCLIFE
After long time coming out of Bearish channel.

BTCUSD On BTC is massive consolidation between $28-30k . My next target after this ping-pong game is over $35k , then I see another drop.. take care

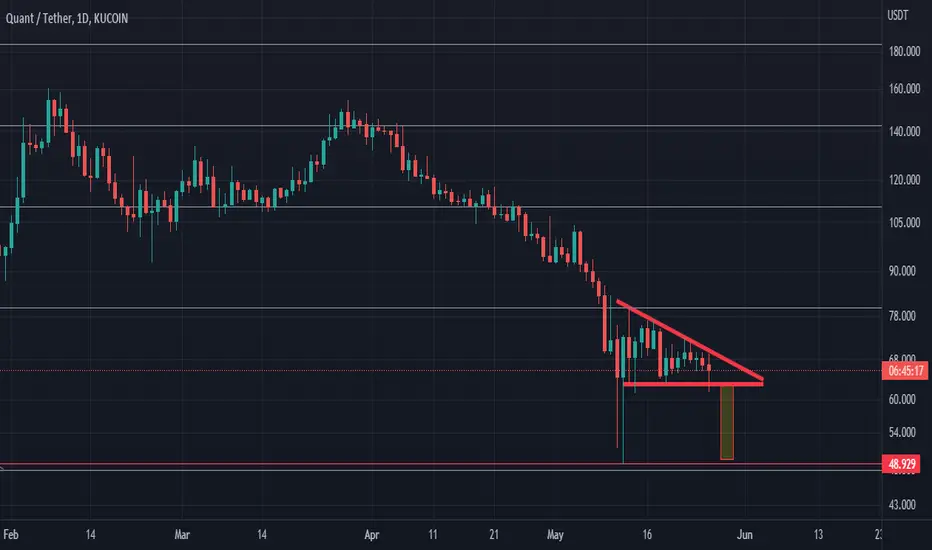
Quant descending triangle short term 2022We have a descending triangle that is a bearish pattern. If this plays out we could see QNT at $48-$49. It would make sense if QNT plays out on a drop in price thus respecting this descending triangle pattern and we drop to the previous low, this would give us a double bottom and a healthy position for a rebound.
AMD Break Out (Short Term)As we see AMD breaking out a major resistance within the rising wedge, we could expect it to keep rising and hitting resistance around the circled area on the resistance trend line of the rising wedge. On the RSI, it also shows AMD has been continuing on a uptrend channel thus showing it has already hit support and its ready to move upwards.

Possible Descending Widening Wedge SNDLSNDL has been, along with the Canadian cannabis sector, in a long downtrend since June 2021. If you exclude the 2 sharp jumps in prices, the pivot points have been making a Descending widening wedge. This reversal pattern, in addition to the company's recent acquisitions and diversification of assets, may lead to both a sharp jump in price in the short term and an overall reversal of trend in the next year or two. Additionally, the US, Canada's bordering country, has a bill that will be approaching the Senate floor for the decriminalization of cannabis on a Federal level. The news of a vote on said bill will most likely be a catalyst to an increase in price prior to the actual vote; leading to a jump in price. Sndl is currently in a curing stage to increase it's stock price to $1 for 10 days within the next few months. The company also has a stock buyback plan yet to be implemented.

Possible sell on GBPUSDConsidering weakness around current area of resistance, I will look to short the pound on the short term

AllianceBlock short term price action 2022where will ALBT be within the next couple of months? Will we move lower into the $0.06 price range or higher? Are we at the bottom with Bitcoin yet? I personally think we may have just one more dip to test the support we hit back on May 12th. If not, then we may have seen the bottom for BItcoin and AllianceBlock may move higher from here.

Short term APE entry and possible levelsThis is a very short term IDEA. As asia wkes up to a pure rout and realizes that there are no more macro news to be priced in this month. I believe we will see a very short lived rally. I stand by my prediction that over the course of the next couple of weeks APE will reach 1.03$. However for a quick scalp it is looking sweet to buy 7.70 and sell 9.50-10.05$.
High risk play given current market volatility. Maximum 1% cap trade.

Bitcoin will keep bleeding, alt season coming.Bearish flag.
Bitcoin dominance is falling.
Could this be the beginning of alt season?
bitcoin 70% drop TBA...

USDCAD#USDCAD on 1H time frame ready for a bearish wave
our suggested position for this area is a sell stop
⚜️Type: Sell Stop
🎚EP: 1.28121
✅TP1:1.27787
✅TP2:1.27302
✅TP3:1.26863
⛔️SL:1.28447
If you like this post or have any comments, leave a comment for me here and share it with your friends.

