GBPCAD - Weekly Forecast - Technical Analysis & Trading Ideas!Midterm forecast (Daily Time-frame):
While the price is below the resistance 1.82310, beginning of downtrend is expected.
Technical analysis:
A peak is formed in daily chart at 1.82320 on 12/19/2024, so more losses to support(s) 1.79228, 1.78439, 1.76819 and minimum to Major Support (1.74790) is expected.
Take Profits:
1.79228
1.78439
1.76819
1.75765
1.74790
1.72705
1.70900
1.69267
1.67670
1.65599
1.63703
1.60894
Short-term forecast (H4 Time-frame):
A Head and Shoulder Reversal Pattern has formed and the neckline has also been broken.
Price is touching the neckline again.
It is very likely that the downward wave will start from this area.
__________________________________________________________________
❤️ If you find this helpful and want more FREE forecasts in TradingView,
. . . . . Please show your support back,
. . . . . . . . Hit the 👍 BOOST button,
. . . . . . . . . . . Drop some feedback below in the comment!
🙏 Your Support is appreciated!
Let us know how you see this.
Have a successful week,
ForecastCity Support Team
Shortterm

BALRAMCHINi Observed these Levels based on Price Action and Demand & Supply which is my own Concept "PENDAM CONCEPTS"... Please don't take any trades based on this chart/post... Because this chart is for educational purpose only not for Buy or Sell Recommendation... Thank Q

Uptrend Channel BreakdownWill this channel decisively break down? Or will it bounce?!
It's a stable uptrend channel... started the 12th of november...
Will it hold?
Take your positions; bulls or bears!
-------
CO
BITSTAMP:BTCUSD

Ramco Cements: Bullish Flag BreakoutNSE:RAMCOCEM Ramco Cements has recently given a bullish flag breakout at ₹1040, indicating a strong upward momentum in the stock. A bullish flag pattern is a continuation pattern that signifies the resumption of an uptrend after a brief consolidation phase. The breakout from this pattern suggests a renewed buying interest, backed by robust volumes.
Trading Setup:
Entry Price: ₹1040
Stop Loss: ₹987 (below the consolidation zone)
Targets:
First Target: ₹1072.10
Second Target: ₹1104.10
Third Target: ₹1136.10
Fourth Target: ₹1168.05
Final Target: ₹1200.05
Risk-Reward Ratio:
This trade setup offers a favorable risk-to-reward ratio of 1:3, making it an attractive opportunity for swing traders.
Key Observations:
The stock has been in an uptrend, supported by strong institutional buying.
The breakout is accompanied by above-average volumes, adding conviction to the move.
Key resistance levels are expected at the target prices, while the stop loss is strategically
placed below the recent consolidation range to minimize risk.
Recommendation:
Traders can consider buying Ramco Cements at ₹1040 for the above-mentioned targets. Ensure strict adherence to the stop loss of ₹987 to manage risk effectively.
Disclaimer: This analysis is for educational purposes only. Please conduct your own research or consult with a financial advisor before taking any trading or investment decisions.

EUR/USD Short term short to long idea pending...This week, my focus for EUR/USD is on the supply zone near 1.05800. I anticipate a reaction from this level, making it a key area for potential sells at the start of the week. Following this initial move, I expect a bullish rally to develop midweek.
If the price drops to 1.05200, aligning with my 11-hour demand zone, I’ll shift my focus to potential buys. After receiving valid lower-timeframe confirmations, I plan to target the nearest liquidity pool to the upside as the price resumes its bullish trend.
Confluences for EUR/USD Sells:
Shift in Market Character: Price has shown signs of a downside reversal, suggesting a potential sell-off.
Unmitigated Supply Zone: A clean 2-hour supply zone remains untapped.
Liquidity Below: There’s significant liquidity to the downside that price may target.
Trend Recalibration: Despite the overall bullish trend, a pullback is necessary for continuation.
Note: If the supply zone at 1.05800 fails to hold, it will further confirm bullish momentum. In this case, I’ll wait for a nearby demand zone to form, providing an opportunity to capitalize on the move to the upside. Patience will be key in this scenario.

SWING IDEA - MEGASOFTNSE:MEGASOFT 's stock price has been retesting around the 50 resistance level for approximately one and half years. Following multiple retest, the stock finally broke out above this level in December 2023 and has since established it as a key support.
The stock subsequently surged to a peak of 107, representing a 104% increase. However, it then experienced a sharp correction, plummeting 50% to revisit the 50 support level again. This pivotal point, formerly a resistance, has now become a robust support.
Currently, MEGASOFT is exhibiting an upward momentum, poised to retest its swing high at 107. The weekly MACD crossover, occurring after the establishment of support at 50, indicates a bullish trend reversal. Immediate Short Term Target as mentioned in the chart with a potential to reach 13% from current Price Point is also observed.
KEY OBSERVATIONS:
- One year resistance level of 50 broken in December 2023
- Stock surged 104% to 107 before correcting 50%
- 50 level now serves as robust support
- Weekly MACD crossover indicates bullish momentum
- Upward momentum poised to retest swing high at 107
RECOMMENDATION:
Based on this technical analysis, I would recommend holding MEGASOFT for a Long Term horizon. This could potentially yield:
- 37% returns from the current price (as of writing)
- 104% returns from the support point (50)
This analysis highlights a compelling buying opportunity in MEGASOFT, driven by its breakout and momentum reversal.
IMPORTANT NOTE: Investors should be aware that there is a possibility that the stock may revisit this Support level at 50 in the near future before resuming its upward momentum towards the swing high at 107. This potential pullback should be monitored closely, and investors may consider adjusting their strategies accordingly.
DISCLAIMER: This IDEA is for informational/educational purposes only and should not be considered as investment advice. The analysis presented is based on technical indicators and historical data but does not guarantee future performance. Please conduct thorough research based on financial goals and risk tolerance, and consult with a financial advisor before making any investment decisions.

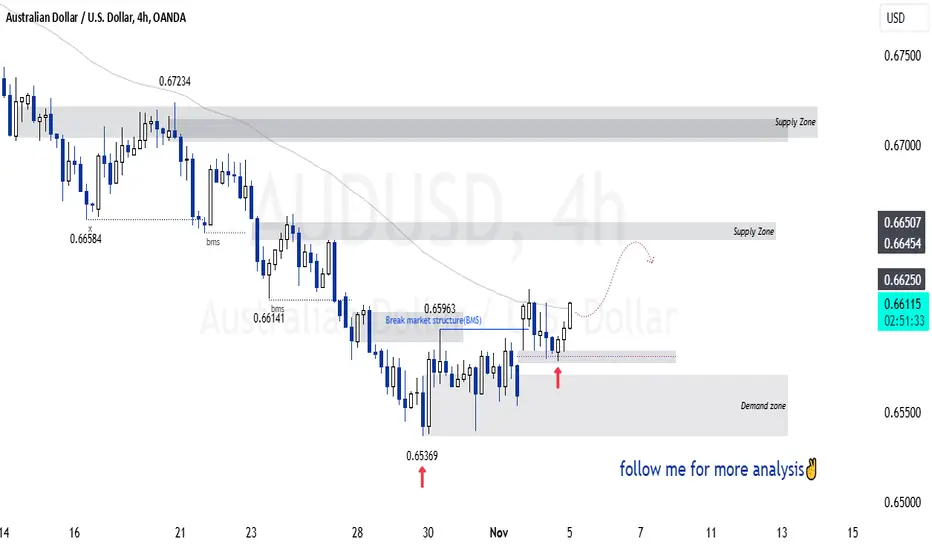
SasanSeifi| Will the Price Continue Its Short-Term Rise?In the 4-hour timeframe, as observed, the price entered a consolidation (range) phase after correcting around the 0.65500 price zone. It then broke previous highs at 0.65950. Following this structural break, the price returned to the gap zone and, supported at the 0.65800 level, experienced positive fluctuations with slight growth, currently trading at the 0.66000 level.
In the short term, it’s expected that the price could reach levels of 0.66250, 0.66450, and 0.66500, continuing this short-term upward trend toward these target zones. A possible scenario for the next price movement is that if it consolidates above 0.66000, the price may move upward in the short term towards the mentioned areas and supply zones.
To assess the continuation of this uptrend and anticipate future price behaviour, it’s essential to closely monitor price reactions at these levels. Key support areas in the 4-hour timeframe include 0.65800 and 0.65650.
💢This analysis is my personal viewpoint and not financial advice. If you found this helpful, please like and comment – I’d love to hear your thoughts! Happy trading! ✌😊
SasanSeifi| Can We Expect Short-Term Corrections?Hey there, ✌ In the short-term timeframe, we've observed that Bitcoin has surged from the $60,000 range to a high of $69,000. However, following this peak, the price has shown a negative reaction, undergoing a minor correction down to the $67,000 levels after a brief period of fluctuations.
Currently, the price has remained in a range after encountering the Exponential Moving Average (EMA) at the $67,000 mark. The significant resistance level ahead in the 4-hour timeframe lies between $67,750 and $68,500.
Analysing the chart in the lower timeframes, it appears that the price may be inclined to experience further corrections. If a candle closes below the $66,950 to $66,850 levels, we might witness a price correction down to the demand levels at $65,500, and potentially further to $64,250 to $63,000. Understanding how the price reacts to these levels will be crucial for assessing the ongoing trend. Additionally, if the price faces increased demand and breaks above the established resistance levels, the corrective scenario could be reconsidered. The potential trend is clearly outlined in the chart above.
💢 This is just my personal analysis, not financial advice. If you found this helpful, feel free to like and comment – I'd love to hear your thoughts! Happy trading! ✌😊

ACHR NYSE --On a Close Trend of spiking as could break 200MA 4.8This is one of many Electric Aviation company's with some nice numbers moving up to 4.8$ which is a shows (me?) 200MA..thus could be a nice Swing.
I'm in from 5.10$ as for this trade..will wait some days, As it also shows fast dumps..so need an eye on it, But for me looks like Tree Shaking..
Good luck if helps anyone

BTC - Bearish Short-Term...Hello TradingView Family / Fellow Traders. This is Richard, also known as theSignalyst.
📉After breaking below the previous low of $68,000 (marked in red), BTC's momentum shifted from bullish to bearish in the short term.
The question is: until when or where?
As long as the bears remain in control, the next major support zone that could hold BTC up is the $63,000 demand zone.
📈Around that demand zone, we will monitor price action and look for bullish setups to confirm a potential reversal.
📚 Always follow your trading plan regarding entry, risk management, and trade management.
Good luck!
All Strategies Are Good; If Managed Properly!
~Rich

SasanSeifi|Will 0.66800 - 0.66500 Support the Price Movement?Hey there, ✌ In the 4-hour timeframe, a downward trend is evident from the level of 0.69400. Currently, due to the breakdown of the significant support level at 0.68, the price has corrected to the liquidity zone of 0.67. If the momentum weakens in this price range and the level of 0.67 is maintained, we may witness a ranging trend with minor positive fluctuations. To better understand the continuation of the trend, attention should be given to the price's reaction at levels 0.67500, 0.67800, and 0.68.
Overall, our outlook leans more towards a decline and correction towards the target of 0.66800 and the demand zone at 0.66500. It is expected that the price will be able to correct to the desired support levels. Subsequently, if the price maintains the ranges between 0.66800 and 0.66500 and confirms it, we will enter a ranging phase with positive fluctuations. The potential trends are also illustrated in the image above.
⭕The important support levels are 0.66500–0.66.
💢 This is just my personal analysis, not financial advice. If you found this helpful, feel free to like and comment – I'd love to hear your thoughts! Happy trading! ✌😊

SasanSeifi| Is Ethereum Poised for a Move to Higher Levels?Hey there, ✌ In the daily timeframe analysis, as shown, the price has entered a downward trend from the $4,000 range. Following this price drop, it reacted at the important support level of $2,100, oscillating between the price ranges of $2,100 to $2,800. Currently, after observing demand at the $2,300 level, the price has experienced slight positive fluctuations and is trading around $2,600.
Based on the candlestick behaviour, it is anticipated that in the short term, the price may rise towards the important resistance levels of $2,700 to $2,820, with some minor positive fluctuations. If the price breaks above $2,820 and stabilizes in lower timeframes, the likelihood of further price growth towards the resistance zone of $3,000 to $3,250 increases. In such a scenario, monitoring the price reactions at these levels will be essential for evaluating the next trend. However, if the $2,820 level is not breached and the price fails to maintain its stability, the possibility of a price retracement may rise.
The long-term outlook remains bearish, with expectations for the price to move towards the $1,800 to $1,500 range.
In the daily timeframe, the $2,450 to $2,300 levels serve as critical support. Maintaining the price above these levels is crucial for the desired scenario.
Sure, if you have any more questions or need further clarification, feel free to ask. I'm here to help!
If you found my analysis helpful, I would appreciate it if you could show your support by liking and commenting. Thank you!🙌✌

BTC - Bearish Pressure Ahead!Hello TradingView Family / Fellow Traders. This is Richard, also known as theSignalyst.
📈 As per our latest analysis, BTC has rejected the $50,000 - $52,000 support zone and has been trading higher since then.
However...
BTC is currently approaching the upper bound of the red channel.
Thus, for the bulls to remain in control, a break above the upper red trendline is needed. In this case, a movement towards the $70,000 resistance would be expected.
Meanwhile, BTC would be bearish medium-term and can still reject the red trendline for one more leg down.
📚 Always follow your trading plan regarding entry, risk management, and trade management.
Good luck!
All Strategies Are Good; If Managed Properly!
~Rich

CUP AND HANDLE BRECKOUT Buy level 1589-1599
Target 1766
Stoploss 1521
Hold for Positional
BEST STOCK FOR SHORT TERM GAIN

SasanSeifi| Will Price Break Through 1.32390?Hey there, ✌ FX:GBPUSD In the 2-hour timeframe, as observed, the price started an upward move from the 1.30 level, reaching up to the previous high of 1.32390. After failing to break this previous high, the price retraced and pulled back to the liquidity level at 1.31400. Following this correction and some sideways movement, new demand emerged, and the price is currently trading around the previous high of 1.32290.
With the current momentum, there is potential for a breakout above the 1.32290 and 1.32390 levels. If the price can hold above 1.32, the upward trend is expected to continue, targeting 1.32650 next. After a minor pullback, the price could also rally towards the 1.33 target.
To better understand the ongoing trend, it’s important to monitor the price’s reaction to key levels. Key support areas in the short-term timeframe are located at 1.31850 and 1.31400. Additionally, if the price breaks below the 1.31400 – 1.31100 range and holds, the likelihood of a deeper correction increases for some time.
This analysis is my personal viewpoint and not financial advice. If you found this helpful, please like and comment – I’d love to hear your thoughts! Happy trading! ✌😊

SasanSeifi| BITCOIN: Will a Pullback Lead to Lower Levels?Hey there, ✌
Bitcoin is currently trading around the $58,500 range. Given the lack of stabilization above the $60,000 level, we could be facing a bearish trend. Additionally, with the recent break below the $59,300 mark, the short-term outlook on the 1-hour chart appears bearish.
We expect that after completing a pullback, the price may move towards the corrective targets of $57,500, $57,000, $56,700, and $56,000.
❌ Key resistance levels to watch are around $59,000 and $59,700.
💢 Keep in mind that this is just my personal perspective and not financial advice. I’d love to hear your thoughts and exchange ideas!
Good luck and happy trading! ✌😎
Feel free to reach out if you have any questions – I’m here to help!✌

IDBI Bank-Short term-Penny Stock- Acceleration required!!
09.08.2024
Buy 98
Target 144
Stoploss 74
Risk-reward- 01:02
Holding time: 3-6 Months
1. Inside candle breakout with good support from RSI
2. Now price has reached 10 year old level.
3, Price reclaimed from 50% Fibonacci
4. Volumes are very good in upward movement and
decreased volumes during retracement.
5. Price rejected at resistance turned support
zone also crossed 21 EMA
6. Price is under consolidation from 6 months in same zone
7. Fundamentals are very good.
NSE:IDBI

Stock for Short Term Investment
Buy range 193
Target 210,230,240,280,300,325
Holding Period Short Term

BTC - Wait for It!The two roads diverged in a yellow wood :)
Critical area for BTC at the moment.
Break above $62,000 for a bullish continuation towards $68,000.
Break below the lower trendline for a deeper bearish correction towards $52,000.
Which scenario do you think is more likely to happen first and why?
All Strategies Are Good; If Managed Properly!
~Richard Nasr


SasanSeifi| Will Gold Continue to Correct? (1H)Hey there, By analysing the OANDA:XAUUSD chart in the short-term 1-hour timeframe, it is observed that the price has experienced corrections from the $2531 level and is now showing a positive reaction within the demand zone, currently trading around $2510. In this timeframe, the outlook leans towards a bearish trend, with a potential decline to corrective targets at $2494, $2490, $2482, and $2477.
The potential trends are highlighted in the above chart, and there is a possibility of a price reversal from the $2514 to $2523 range. To better understand the next price movement, it’s essential to observe how the price reacts to these levels. If momentum weakens and the necessary confirmations are received from the specified levels, the corrective scenario will gain significance. Conversely, if the price encounters increased demand and successfully penetrates and stabilizes above the mentioned levels, the possibility of further growth and invalidation of the corrective scenario increases. (For the uptrend to continue and to reach higher targets, the $2531 resistance needs to be broken, and the price must stabilize above this level.)
💢 Please remember that this is just my personal viewpoint and should not be taken as investment advice. I’d love to hear your thoughts and share opinions!
Happy trading!✌😎
Sure, if you have any more questions or need further clarification, feel free to ask. I'm here to help!✌

CLSEL potential breakout 5 months base.
Breakout with good volumes.
Forming a bull flag outside base.
Trading in a narrow range.
High relative strength.
Looks good for a quick 10% up move.

IDBI Bank-Short term-Penny Stock- Acceleration required!!
09.08.2024
Buy 98
Target 144
Stoploss 74
Risk-reward- 01:02
Holding time: 3-6 Months
1. Inside candle breakout with good support from RSI
2. Now price has reached 10 year old level.
3, Price reclaimed from 50% Fibonacci
4. Volumes are very good in upward movement and
decreased volumes during retracement.
5. Price rejected at resistance turned support
zone also crossed 21 EMA
6. Price is under consolidation from 6 months in same zone
7. Fundamentals are very good.
NSE:IDBI
