Shortterm

Buy Intellect Design Above 778 stop loss 711 target 894 , 1059As per my study i feel the stock is in good risk to reward ratio. stop loss of 711 is on closing basis as you can also see the stock never closed below 711 in its last swing . as per P&F charts also very good setup .

Buy Sundram Fast Above 923 stop loss 850 target 1017 sundram is in range and ready for a blast . so with strict stop loss of 850 closing basis . always and always follows risk to reward .

BTC/USDTJust follow the numbers
leverage trade
1 *long : 42900 < 44122
2 *short : 44122 > 43556
3 *long : 43553 < 44944
4 *short : 44944 > 44000
*ST : 41710

Buy IDFC @ 64 sl 59 target 83stock is ready to breakout from current zone . long bullish candle and also retracement. as per point and figure chart pattern this pattern is ARF pattern .

ETC - Long-Term and Short-Term Plan!Hello everyone, if you like the idea, do not forget to support with a like and follow.
ETC is approaching a strong support zone 25-30 in green so we will be looking for buy setups.
Long-Term: right
on DAILY, ETC is forming a channel in blue but the upper trendline is not valid yet, so we are waiting for a new swing high to form around it to consider it our trigger swing. (projection in purple)
Since ETC is sitting around the lower blue trendline and support, we will also be looking for buy setups on lower timeframes.
Short-Term: left
on H4, ETC is forming a trendline in red but it is not valid yet, so we are waiting for a new swing high to form around it to consider it our trigger swing. (projection in purple)
Trigger => Waiting for that swing to form and then buy after a momentum candle close above it (gray zone)
Meanwhile, until the buy is activated, ETC would be overall bearish can still trade lower.
Good luck!
All Strategies Are Good; If Managed Properly!
~Rich

Buy EPL LTD @ 197.10 stop loss 185 target 230 buy Epl ltd on short term basis with strict stop loss. stock is in lower range of the trend and one can take risk of 13 points . risk reward is favorable

TATA POWER READY TO FIREEEEBreakout and retest done in Tata Power. (1st confirmation)
looking strong above the resent resistance at 237 .
Keel SL near 213-215
Also taken support on 50 EMA .(2nd confirmation)
After ATH break it can give long rally immediately.

BUY M&M ABOVE 849.75 TGT 870 SL 835M&M is in very short range . possibility of breakout very soon . so place a buy above 849.75 sl 835 and target 870. always keep stop loss

IS BITCOIN READY? If you look closely, according to Elliott, the whole current bitcoin correction is a simple zigzag pattern (5-3-5) and there is still a upside to around 43500 and a correction around 37700 to 37300.
In this area, it is located on the Fibonacci floor 78.6 (from A to B).
It is located on the floor of a Falling wedge pattern.
and Previously supported in this range.
In my opinion, Correction continues

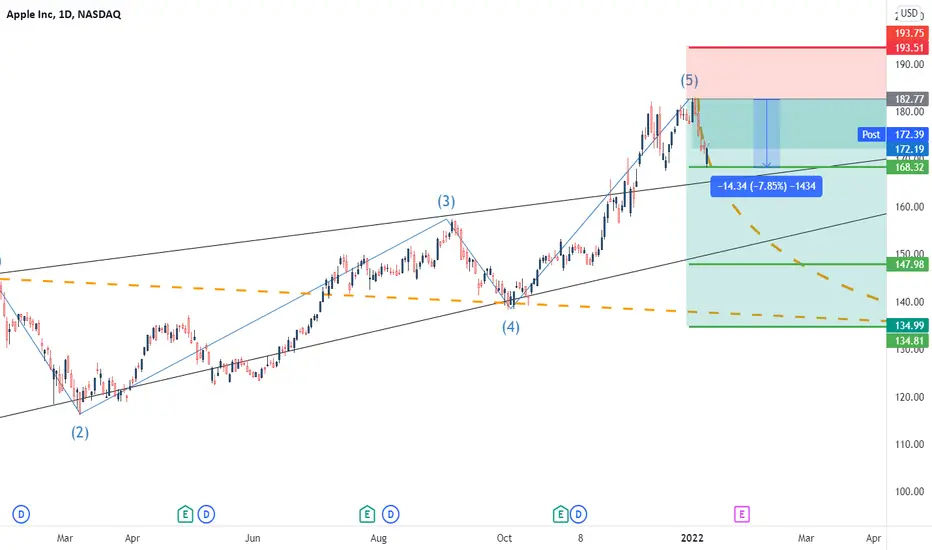
AAPLEHello Traders
As we shared our opinion about APPLE stock with you, this stock fall down about 8% and our first target is already done.143 pip from the enter point
our position is free risk from here and we are waiting for second target.
It is better for you to do the same
DATA/BTCI think you can make a good profit from this position
I hope it is profitable for all of you
Stick to the stop loss
#DATA/BTC
Buy: 255-265
TP1: 289
TP2: 325
TP3: 380
Stop Loss : -%8

Gujrat ambuja exports, Breakout above 100 EMAGujarat Ambuja Exports is principally involved in agro-processing and trading and has focused on exports, competing in the global market.
The company has put in place a strong infrastructure that constitutes technologically advanced plants with captive power generation at each plant, most modern quality control, improvement setup and human resource. GAEL is poised to scale newer heights and is fully geared to achieve the magical Rs 1,200 crore operational turnover.
It's closing near 100 ema, even it gave a breakout with higher volume. So I expect to give atleast 5-10% returns.

next short on AUDUSDFor this analysis we will be looking at the daily and 4h charts.
AUDUSD recently broke the uptrend by setting a LH (lower high) snd breaking the trendline, which indicates a retest, followed by a drop.
Entry: my entry is in a area where the price tends to reverse, you can find these areas by looking for candles (multiple candles, more than 2 would be great) and wicks which end in this area. In these areas many other traders will place their sell/buy orders as well. In addition to that the sell order is slightly above the red resistance and underneath a daily key level. The black area is a sell area.
Stop Loss: MY S/L for this trade is above the previous high, which is pretty logical, since we expect the price to drop further and not expect it to make a HH (higher high). The grey area just below the S/L is a orderblock (OB), I wrote about them in another published idea.
Take Profit: My TP is at a major daily support level. I think that's a good spot to exit because 1) I'm taking the trade in 4h and daily support > 4h support 2) I am expecting buy orders to be there, since it is a pretty obv. lv 3) it perfectly fits my trading plan of having at least a 3:1 RRR.

Buying opportunity in HDFCAMCTrendline is the short term target, 2nd target is at ATH 3880.
If it breaks ATH, then new target will be updated based on Fibonacci.
NOTE: Never invest more than 5% of your capital in a single stock.

Long On Tembo Look for fresh Entry Above 50 DMA .
Stock is in continuous Uptrend
Targets are shown on screen i.e 480+
Hope it do well . Inshallah

MOTHERSON SUMI READY FOR BREAKOUT WITH INCREASAING VOLUMEAll 3 targets are shown on the chart.
Motherson sume ready to give breakout.
Supertrend indicator is also giving confirmation.
increasing volume is also confermation for trade after breakout.

A CHAIN is only as strong as its weakest LINK (Short-Term view)My previous idea for LINK proposed that it would rise toward the upper resistance of the channel (see below) and indeed it moved toward it for a good profit.
LINK is now facing local resistance at ~27.55 and if we move to the 1h timeframe, we can see it rejected this area multiple times and has made a slightly lower high.
Depending on your risk appetite this can be interpreted in different ways but due to the conditions we are currently in, a cautious approach may limit poor decisions.
With LINK being one of the few fearless altcoins even with BTC falling, it is only a matter of time until it also feels BTCs power. I think we may have a rejection from the current area toward the green support at ~22 based on the resistance, RSI and BB's. As LINK approaches the support area it is a good idea to zoom into lower timeframes to look for buy setups.
Of course, LINK can continue to rise within the channel if BTC begins to recover and turn its new resistances into supports again but that seems unlikely for now.
Please note I am not a financial advisor and this is not financial advice. All ideas are for educational purposes only :)
Please feel free to leave your comments and thoughts below!

CHFJPY ShortPrice create a nice pattern and also touched weekly high structure and reversed
Broken out of pattern and trying to close below 200 MA

Short term Bitcoin bounce.Nothing falls on a straight line. In the short term Bitcoin will bounce to the 55EMA.
Here's the daily projection:
This is a 4H chart. Don't expect the price to start moving right after you buy or sell.
The result of this projection will be seen between 24 to 48 hours. Be patient.
Kia Kaha,
Rio.

XRPUSD What's Next? SHORT!Price is moving in a bearish channel and we can see it has been respected and showing signs of bearish pressure through multiple wick rejections .
In this week I will be looking for a selling opportunity around 0.8243 level if wee see a break below the low it will confirm our idea!


AUDUSD short to go long...Break and retest of lower timeframe triangle pattern within a horizontal channel. Break below horizontal channel will confirm bearish trend on lower timeframes (1H and below). I have weekly timeframe on a bullish bounce from recent swing low. Currently looking for pullback to downside for liquidity grabs before the continuation to the upside to next weekly area of interest (not shown on this chart). Anyone else with a similar idea? Definitely interested in your thoughts!
