Nasdaq structure shift 2021-11-09Long or short? what do you think?
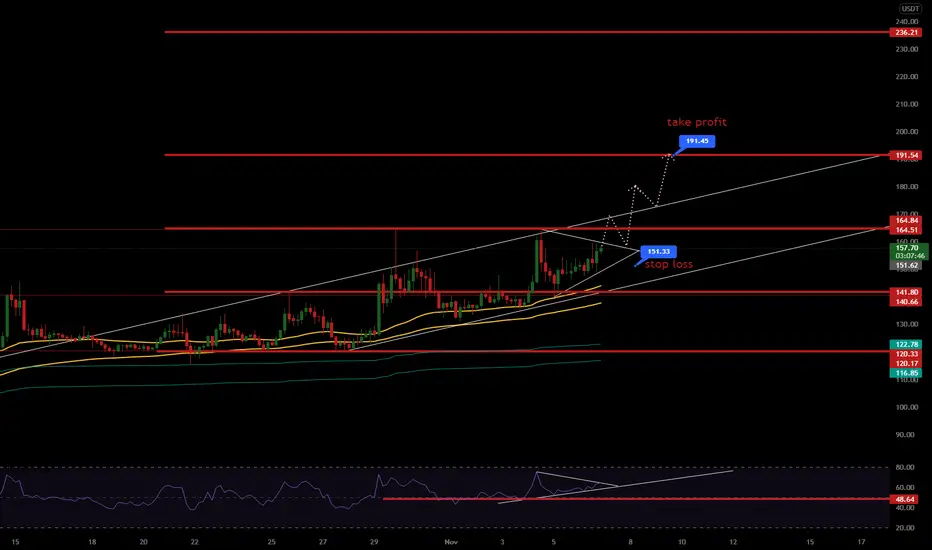
in the picture you see trend lines and fibbonacci retracement
and SMA 21 50 200
.
.
.
.
.
.
.
.
.
.
.
.
.
.
.
.
.
.
Shortterm

LUNA/USDTif u satisfy with my chart plzzz like now
@ ___=___ @
don't miss to buy luna
buy zone = now
sell at = 55 to 58
if u satisfy with my idea plzzz like now
short-term


Btc Buy Zone. (Short Setup).A sharp drop anticipated till the buy zone as per my opinion do your own ta not a financial advice thanks.

Laxmi Machines strong results + TechnicalsCharts is showing a convincing breakout and the results issued by the company can take hike the price by 10-12%

Tata power ready againcharts is forming inverted head & shoulder pattern have kept less targets because market is very volatile

#AFFLE(INDIA)LTD .... (NSE:AFFLE)on the chart pattern ,it is moving nicely towards its minor RESISTANCE of 1115 after taking support of 1020.
.
Im waiting when price will break resistance line(1115) and will show good upward movement towards its ATH 1260 in the short term period. it might be nice SWING TRADE. Hope the chart moves nicely.
.
So Im waiting breakout and pump.
This is article not financial advice, always do your own research.
best of luck


Laxmi organicChart is forming a Bullish Bat formation at 392
price should bounce 20% from 392 levels!

$WKHS november update*This is not financial advice, so trade at your own risks*
*My team digs deep and finds stocks that are expected to perform well based off multiple confluences*
*Experienced traders understand the uphill battle in timing the market, so instead my team focuses mainly on risk management*
Workhorse Group $WKHS is a soon to be tech giant that manufactures and sells high performance trucks. Earlier this year my team road the $WKHS wave from the low 20's to the high 40's. This was back when everyone thought they were a sure pick for a USPS deal that ultimately fell through.
recap: My team entered $WKHS on 11/3/21 at $7.20 per share capturing a nice -7% dip. $WKHS is currently trading at $6.55 per share.
My team has now added a stop-loss at $5.95. We still believe in the long-term success of $WKHS, but if price swings below our stop-loss then my team expect $WKHS to consolidate at lower levels short-term.
$WKHS is expected to announce their third quarter earnings on 11/11/21 but this date is subject to change.
ENTRY: $7.20
TAKE PROFIT 1: $9.50
TAKE PROFIT 2: $16
STOP LOSS: $5.95
If you want to see more, please like and follow us @SimplyShowMeTheMoney


Next move for EthereumAre we going to see a small pullback or do we fly sky high........to the mooooooooon!!!!!!1

AXS/USDTentry zone = now
exit zone = 191
if u happy with my idea pls like my sweet followers
* ___ *
COLPAL READY FOR UPMOVEcolpal has completed bullish bat formation and is ready for a upmove to 1580!

RELIANCE INDS NEAR SUPPORTvery good fundamental stock has fallen after a rally hope it doesn't reverse now and comes to our level for entry!

How much more obvious could it beWe are at an inflection point for the ETH/BTC pair and things are looking promising after support held in october.
Two scenarios that are likely, and they both end with a .087 BTC ether in the near-term (zone taken from past relative high)
Sit back and watch your portfolios fly

USDJPY SELLE.P 113.936
S.L 115.164
T.P 112.052
According to the graph, the pair is in a bull trend, but we can have a possibility to enter short, using the retracement of the graph. The indicators suggest us that there will be a little down slight blending. Be careful because we are in the positive trend. the take profit will be checked during the time.
No financial advise.

Diwali Pick - SRTRANSFIN (Rs.1576) 02-Nov-2021, (Dhanteras)
Diwali Pick - SRTRANSPORT FINANCE (Rs.1576)
Please do your own research as well before investing

Diwali Pick - Route Mobile(Rs.1977) 02-Nov-21 (Dhanteras)
Diwali Pick - Route Mobile(Rs.1977)
Please do your research as well before investing

YGG Good Buying Chance (30%)Yield Guild Games (YGG) is a decentralized autonomous organization (DAO) for investing in non fungible tokens (NFTs) used in virtual worlds and blockchain-based games.

BTCST PUMP LOADINGOn short term, we should see BTCSTUSDT pump up to $54 but it faces strong resistance at $57.2 due to major liquidity.
Therefore, checking the daily timeframe , I reason that BTCSTUSDT could fall to $22 after pumping to $54. Since BTCSTUSDT already made a break structure to the downside around $37 I expect it to dip to $22, after it's short term pump, before making new ATHs up to $1000.
However, during this short term pump, if the bulls can push the price above $57.2 even with just a dollar. The BTCSTUSDT could retrace a bit before mooning up to $1000 and above.

Warning Signs for BTC short term drop!Bitcoin is showing some Strong reversal signs for at least short-term drop.
Let's look at all those points that might be pointing towards a pullback or short-term drop for BTC -
1) Shooting Star or Inverted Hammer on Weekly of Bitcoin and on same time Bitcoin went up with decreasing and low volume which is VERY WORRISOME :-
2) Head & Shoulder on Hourly :-
3) Potential Completion of Wave 1 in Bull case for BTC :-
4) Potentially Irregular running flat or maybe Expanded flat possibility for Bitcoin :-
5) 10 Years Yields might be looking bullish for at least short term and might be going upto 2.4/2.5 and touch highs of downward channel :-
6) US Dollar also looking somewhat bullish for short term :-
7) Big Money doesn't have good reasons to buy Bitcoin at high levels.
8) This is Earnings season for market and especially this week has big companies earnings so you never what might happen.
I am creating this post to raise some points that might be valid for bear case for Bitcoin for short term. Feel Free to share your thoughts in the comment section below.
However, I would love to be wrong as i am long as well for long term and would love if Bitcoin continue it's Bullish run as it would be better for all of us.
In the end, stay safe. And Enjoy everyone.

ES1 short the price's kinda getting tired, and it hit a resistance with a significant wick saying clearly it'll drop for the closest support
