JPY SHORT TERM BULLIn my past video on YouTube, ive mentioned that JPY will be short-term bullish. Price took SSL and the run for the buy side. im hoping for the price to retrace to its weekly 50% Av, making its cross pair go lower like AUDJPY & EURJPY.
Shorttermbull

Market Moves as Expected—Caution for a Potential ReversalDXY Update : The movement remains in line with my expectations, with the ongoing correction being held by the Fibonacci cluster. At this stage, DXY still has the potential to strengthen, testing the 102.791–103.150 area to form wave iv of wave (v).
However, caution is advised for a potential reversal toward the 100.462–100.946.

SBICARD – Descending Triangle Breakout 920 to 1100+ TargetSBICARD has been trading within a descending triangle pattern for an extended period, with lower highs and a strong horizontal support. This pattern is typically bearish but can lead to bullish breakouts when resistance is breached, as seen in this case.
Breakout Confirmation & Key Levels
Resistance Breakout:
The stock has successfully broken above the descending trendline resistance, indicating a potential trend reversal.
Buying Zone:
Above ₹800 – A sustained move above this level confirms the breakout.
Stop-Loss Level:
Below ₹750 – Any close below this level could invalidate the bullish setup.
Target Levels:
Initial Target: ₹920+
Projected Target: ₹1100+ (based on pattern height projection)

BLUE STAR CUP & HANDLE PATTERNentry will be considered only above 2400 with good volumes & with strong close of daily candle.
fisrt target will be 2763
SL will be the low of handle

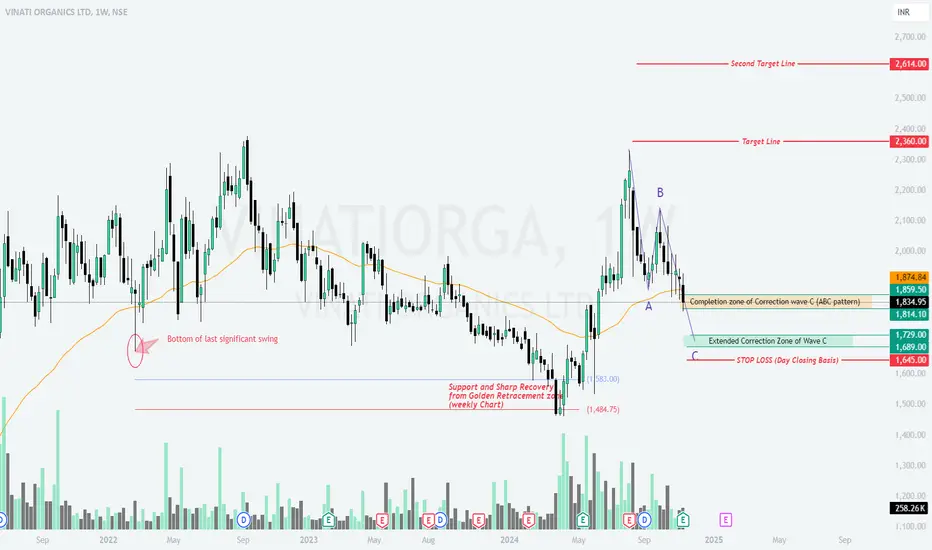
VINATIOR - ABC Correction Near Completion (weekly)Vinati Organics Ltd – Weekly Chart Analysis
1. Current Correction and Support Zone
The price has completed the ABC corrective structure with wave C nearing its completion in the Extended Correction Zone (₹1,729-₹1,689) .
The current price (₹1,834.95) is hovering near the completion zone of wave C , and a sharp recovery is anticipated if support holds.
2. Key Levels and Trading Plan
b Bullish Scenario
Sustained buying from the current levels or the demand zone (₹1,729-₹1,689) could lead to a recovery toward the following target zones:
Target 1: ₹2,360
Target 2: ₹2,614
b Bearish Scenario
A break below ₹1,645 (on a day closing basis) could invalidate the bullish setup, with potential downside to lower levels.
3. Observations and Indicators
Support at Golden Retracement Zone: The stock had shown sharp recoveries in the past from the 61.8% Fibonacci retracement levels, as seen in earlier price movements on the weekly timeframe.
Volume Analysis: A noticeable increase in volume during previous support testing phases indicates buyer interest around key levels.
4. Key Risks
A failure to hold the current correction zone could push the stock toward lower levels. Watch for macroeconomic factors or company-specific news that might impact sentiment.
📈 What’s Your Take on the Setup?
Are we heading toward the targets, or will bears take over? Share your insights in the comments! 🚀📉
[Short Term] Symmetrical Triangle Reversal in SYRMAThis chart of SYRMA on the 1-day timeframe shows a Symmetrical Triangle Pattern formation, a pattern typically indicating potential price consolidation before a breakout.
Resistance Line (Red Zone):
The price has repeatedly been rejected around this downward sloping resistance, as highlighted by the red arrows.
The price consistently meets selling pressure at these levels, pushing it back down.
Support Line (Green Zone):
The price finds support at this upward-sloping line, bouncing back every time it reaches this level, as marked by green arrows.
This support forms the lower boundary of the triangle.
Pattern Height:
The vertical distance between the resistance and support lines is labeled as the Pattern Height. This height is used to project the breakout target by adding it to the breakout point.
Breakout Targets:
Breakout Initial Target ~ 500+: After breaking above the resistance line, the first target lies around this level.
Target 2 ~ 550+: The next price target, following continued bullish momentum.
Final Breakout Target ~ 600: The price target, based on the full height of the triangle added to the breakout point.
Reversal Target (450+):
Before the breakout, the price could reverse and approach this target (~450), where you can decide to either hold or exit positions based on further price action.
Entry & Stop Loss:
Entry Point: A long position can be considered above the 417 level, as marked in the chart.
Stop Loss: The recommended stop loss is set below the 395 level to protect against potential downside risk.
This technical analysis indicates a possible bullish breakout if the price can sustain above the resistance level. The Symmetrical Triangle Pattern suggests a neutral consolidation, but a breakout could lead to a strong upward rally towards the mentioned targets.
Disclaimer:
This analysis is for educational purposes only and should not be considered financial or investment advice. Always conduct your own research and consult with a financial advisor before making any investment decisions.

Euro Technical Analysis: EUR/USD Stalls Inside of Yearly HighEUR/USD has put in a very bullish outlay so far in Q3 trade. But last week saw bulls stall inside of the 2024 high and that brings questions to topside continuation in the pair.
EUR/USD continued the advance last week following the rate cut rally following the European Central Bank’s move two weeks ago. There was technical context for bullish continuation as the pair broke through the topside of a bull flag formation but, to date, buyers haven’t been able to push for a re-test of the yearly high at the 1.1200 handle.
There was seemingly an open door for a test of the highs last week as the pair showed three consecutive days of swing highs within 25 pips of that big figure. This week started with pullback but that also shows a bit of indecision as sellers were unable to test below last Thursday’s swing-low.
EUR/USD Bigger Picture
At this point it’s difficult to argue with the intermediate-term outlay in the pair, which has been decisively bullish since the rally began around the Q3 open. The pair was working around the 1.0700 at the time and as USD-weakness, prodded by a sell-off in USD/JPY, continued to drive DXY to fresh lows, EUR/USD continued its upward advance.
But taking a step back, the argument can be made that the pair remains in the confines of a longer-term range and last week’s respect of the 1.1200 handle further speaks to that, as that, itself, is a lower-high from the 2023 swing at 1.1275.
This sets up for an important few weeks as price remains within that shorter-term bullish trend into the Q3 close, with those very obvious resistance levels lurking overhead.
I had written about the US Dollar to finish last week, and if the USD is going to rally, it’s probably going to need some help from EUR/USD bears.
EUR/USD Shorter-Term Strategy
Sellers made a quick push at the start of this week’s trade but as noted above, they haven’t been able to make much of a mark yet. But – this does set up some additional lower-high context as last week’s stall around 1.1175 is inside of the prior high at 1.1200, which is inside of the 2023 high at 1.1275.
The 1.1140 level that I’ve been tracking in webinars is in-play as of this writing and there’s additional context for a possible lower-high up to prior short-term support, around 1.1155. If bears can defend that, the focus is on tests of deeper support. I’m tracking a Fibonacci level at 1.1081 that helped to bring the post-Fed bounce last week, and that’s followed by a swing at 1.1055.
After that is the 1.1000 level and that’s the price that was vigorously defended into and around the ECB’s rate cut.
Bears aren’t necessarily out of the woods on a first test below 1.1000, however, as the 1.09424 Fibonacci level could be a lead-in for bear trap potential on a bigger picture basis. That’s the 50% mark of the same Fibonacci retracement that set the high last year at the 61.8% (1.12697) and the low so far this year around the 38.2% (1.06152).
--- written by James Stanley, Senior Strategist

Alembic Pharma-Bullish view- Short to Medium term analysis NSE:APLLTD
09.09.2024
Buy-1203
Target 1- 1282
Target 2-1575
Stop Loss- 1020
Risk Reward- 1:2
Holding period- 3 to 6 Months
Very good fundamentals along with below technical analysis
1.Inside bar breakout in weekly TF
2.Trend- Continues uptrend from last one year
3.Price has taken retracement at very strong key level
4.Gradual increase in volumes.
5. Very strong rejection from FVG

medium term trading opportunity in samvardhna mothersonHi,
NSE:MOTHERSON has given a Bullish Flag Breakout on Weekly charts with very good volume.
MACD is also on the bullish side on Weekly time frames. RSI is also on the bullish side on daily, weekly and monthly time frames.
In the current market scenario, I am expecting that the bullish momentum will continue.
Complete price projection like entry, stop loss and targets mentioned on the charts for educational purpose.
Don't Forget to Follow me to get all the updates.
Please share your feedback or any queries on the study.
Disclaimer: Please consult your financial advisor before making any investment decision

Dollar index in classic zigzag corrective patternGreetings,
Dear friends, I hope you are well and have a week full of successful and profitable transactions.
My analytical view:
DXY analysis is one of the most challenging markets out there in my opinion. If we just want to see the overall structure on the daily chart, there is a bearish impulse pattern, and wave A or 1 is formed in the larger degree of the wave.
Next is an impulse pattern for wave A and the continuation of a deep correction, which can also be seen as multiple zigzags, which I labeled as wave B in my aggressive idea. But what happened after wave B looks like a diagonal pattern that consists of formula 3.3.3.3, and only 3 waves are left to complete it in the bull market. A classic zigzag pattern is formed for wave B or 2 in a larger degree, and after that, we will see a drop in the dollar index.
This fifth wave of the diagonal pattern after the price crossing, i.e. the price action, should be formed from the middle line of the corrective channel. Next, any corrective pattern can be a green light to enter the transaction, and then the probability of exiting the channel will increase.
The point of invalidity of this analysis is based on the fourth wave of the diagonal pattern that has been completed.
There is also an idea about the continuation of the downward trend, which I will share if needed
Note: I am an analyst in the world of principle wave, who has entered the fourth year of my work experience, and I am developing an analytical idea. In financial markets, there is no 100% certainty due to the complexity of different patterns that can change. However, I do my best to back up every analysis I share with you guys with everything I've learned so far.
A brief explanation of the three fundamental laws of the wave principle:
1. The second wave should never go beyond the beginning of the first wave.
2. The third wave should never be the shortest wave between waves 1, 3, and 5.
3. The fourth wave must never enter the territory of the first wave.
Ralph Nelson Elliott was the founder of this theory, and when asked about his view of the market, he always referred to five waves in the direction of a larger trend and three waves against the direction it was taking. After completing an eight-wave cycle, a larger cycle is formed in the future, simply.
May his memory be cherished, and may his soul rest in the shelter of God Almighty and the eternal world.
I am attaching the analysis of this market that I shared with you earlier to this current analysis.
The last word of my analysis text is repetitive, except to explain the current analysis because I also trade in the financial markets and I am active in my social networks, and I work hard to improve my skills in analysis and trading to reach my goal.
I apologize for repeating the text.
I welcome suggestions and criticisms, and I will respond, but a logical reason is important to me.
Thank you for taking the time to review my analysis.
First of all, I wish good health and success to all my dear friends and colleagues.
Mr. Nobody

WES - SELLWesfarmers have reach all time highs and due a correction
- RSI divergence indicating SELL
- Buy @ $58 - $60 range
- This would be a high probability trade to gain for Short Term Trade

Trend Extend SPX short term futures bullThis algo and automatic drawing system can indicate that an oversold short term furtures index price can retrace to trend extend levels.
the projection in the algo and short term futures or money network index risk may accumulate according to trend regularity 33, with automatic drawings suggesting a cross.
a bear pullback could look like something as indicated on the chart, where the market overall USI:TICK SP:SPX $DXY/SPY is still a weekly sell.

Head and Shoulder pattern in Nifty hourly tfNifty has shown a formation of a Head & Shoulder pattern in Hourly time frame. This is a short term outlook as long as medium term remains bullish i.e., daily close is not below previous low. Monthly call options/ futures can be used to trade this.

Nifty Head and Shoulder on fifteen mins tfNifty has once again given a chance. Head and Shoulder pattern has formed in a 15-minute time frame. Given that it is Budget tomorrow, there is a high chance that we will achieve the targets and then reverse from their trapping bulls like last year. I am going to be very quick in booking profits intraday.

FDC Facing resistance after 3 months.FDC is facing resistance after August 2023. If it breaks either we can go long or wait for it to retest. Or is on weekly timeframe so I may go long immediately instead of waiting for it to retest.
15% achievable.

bullish for 60% up move1) very good 2023 Q2 results
2) stock at listed price level
3) results as good news for the stock and sentimental good for this stock
4) sentimental and chart-two combination can give better result
5) 185 level next target in 9-12 month
6) 125 is short-term target
7) no recommendation for buy-and-sell

Quick 3 R:R trade setup on the GBP-USD retraceIn a HTF support bounce and much needed liquidity push for the buyers, we are looking to see a pretty sustained and strong push to the upside to mitigate upper supply levels and resistance levels on the fib.
Potential 3 R:R trade if we mitigate this LTF demand zone and make another BOS

How I confirm a signal and enter a tradeQuick 2:00 clip of, LTF trade signal and entry for potential short-term reversal trade.
This is a more risky version of my trading strategy which doesn't put much emphasis on the HTF trends and structure. Do not take this trade - this is just an example that if signals lined up with HTF and there was confluence, this is how I would trade it.
Happy trading :)

USD/CHF Scalp strategies - Approaching HTF 6.6 R:R shortAs I mentioned in my setups last week, we broke out of a HTF triangle to the downside. We are currently in an uptrend pullback but are at 2 key retrace levels on the fib from recent swing high and low that we can target as scalp trades prior to taking our longer term short trade. Since we just broke out of a strong downtrend trend line to the upside, we expect an upside push for further liquidity.
Confluence for upside scalps:
1. Breakout of strong downward channel - Short term upside momentum
2. Approaching 61.8% retrace level which lines up perfectly with the bottom of the triangle that we broke out of.
3. 70.7% level is sitting right at the bottom of a strong unmitigated supply zone which was created by the former swing high. Sellers could use this zone for larger push to downside (and trend continuation)
If price does not fail at this 50% resistance level with strong volume, I expect first a retest of the 61.8% retrace level at .8930 (80 pip profit) and if break that level we will be expecting price to mitigate the 70.7% level and supply zone above at the .898 level (125 pip profit).
This gives us multiple scalp opportunities to the upside prior to taking our large short trade (6.6 R:R) once price reaches these supply zone levels.

Anyone Has The Same Trading Ideas With Me For ETH/USDT
Personally, according to Channel Analysis and Trend Line Analysis, on the 1h and 4h Chart (ETH/USDT), I Do Think Ether's Up Trend is Not Over.
Currently, Ether's price is touched the lower Channel, and Looks like it is Rising.
Moreover, 1h RSI is 45.84 and 1h MACD is about to form a golden cross, for me its bullish in the short-term at least.

DAILY TIME FRAME - AMBICAAGARThe Structure looks good to us, waiting for this instrument to correct and then give us these opportunities as shown on this instrument (Price Chart).
Note: Its my view only and its for educational purpose only. Only who has got knowledge about this strategy, will understand what to be done on this setup. its purely based on my technical analysis only (strategies). we don't focus on the short term moves, we look for only for Bullish or Bearish Impulsive moves on the setups after a good price action is formed as per the strategy. we never get into corrective moves. because it will test our patience and also it will be a bullish or a bearish trap. and try trade the big moves.
we do not get into bullish or bearish traps. We anticipate and get into only big bullish or bearish moves (Impulsive Moves). Just ride the Bullish or Bearish Impulsive Move. Learn & Know the Complete Market Cycle.
Buy Low and Sell High Concept. Buy at Cheaper Price and Sell at Expensive Price.
Keep it simple, keep it Unique.
please keep your comments useful & respectful.
Thanks for your support....
Tradelikemee Academy

USDJPY Short Term Trend ChangeChanging a trend is not a simple task; it requires significant time and effort. However, the market typically provides us with valuable information in the form of a trend changing pattern before we witness a confirmed shift in the trend.
The strength of the existing trend plays a crucial role in determining the duration needed for the trend reversal to materialize. Consequently, the stronger the current trend, the longer it may take for the change to occur.
In the case of USDJPY, we anticipate a retest of the high of Tuesday's New York Session.
Wishing you successful trading!

KAJARIACER is looking good for 2-3 % in a weekKAJARIACER looking good for 2-3 % in a week because it breakout the tradeline and resistance as well after retest . so there is a high probability to give 2-3 % in 3-4 days . will post again once it reaches to it target.
