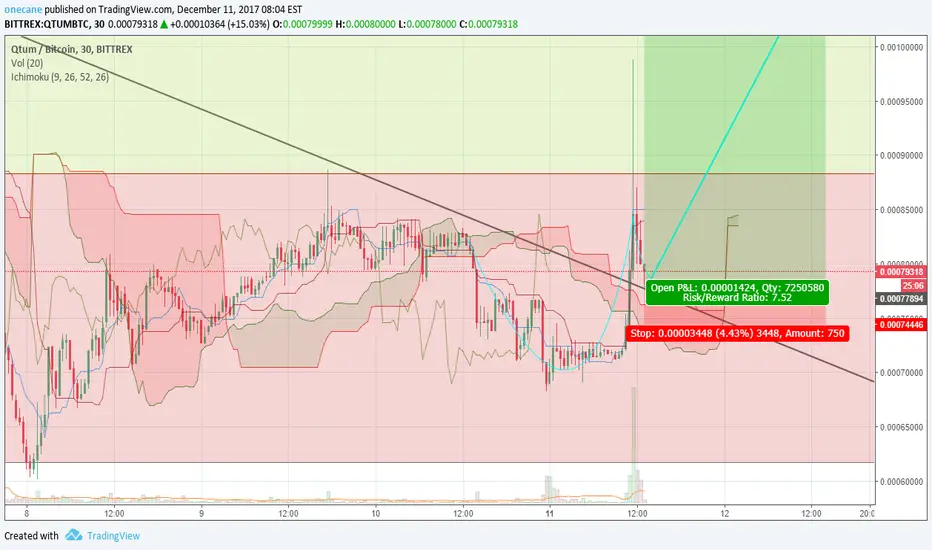
Long Term bullish till 13000!!! What do u thinkI have a feeling that we are ending an ABC correction and tomorrows conference might give a push to the bulls) lets see what will happen after, opened a long position from 3400.
Shorttermbull

LONG SOYOILWEEKLY CHART FOR SOYOIL
THE BUY SIGN IS CONFIRM
LONG SOYOIL
ALL MAJOR COMMODITIES TURN BULL

BITCOIN to hit $10,000 in 4-6 daysBitcoin should now start to trend up for the next week or so. I expect to be at the top of my BLUE downtrending channel again in 4-6 days or at around $10,000. In almost 3 months, the bulls have not yet proven that they have the strength to break out. I personally will be looking to sell (at least half, maybe more, maybe less) again once we get there. I want proof. So far, these bulls have not delivered.
Beyond my blue channel you have the first and second necklines and a few other strong resistance points. But you can read more about those in my previous posts. For the purpose of this idea, I'm mainly making traders aware of a temporary short term bullish move to 10k.
Peace. And happy trades.


VIABTC Cup&HandleThe price successfully reached our previous target mentioned in the last analysis of this coin and went dip. We carefully tracked its movement and for now it has consolidated and is ready for another wave of growth. Formed Cup&handle proves VIA's bullish mood. Use this analysis for a self trading, join our telegram channel to see targets stop loss and a buying zone

XMRBTC XABCD and double bottomXMR grew significantly yesterday and started a correction. Double (triple) bottom was formed which completed XABCD pattern. We expect a reverse of the trend and mid - long term growth of this coin. Moreover a great fundamentals and growing dark net demand will skyrocket the price of XMR. Furthermore there is an upcoming fork XMV.

Long!! long!!I have bought 70 bitcoins at 11200 betting it will goes up at least to the previous high. I believe it will break its previous high very soon. I'm looking for 200 to 300 points profit.

USDJPY - Range-bound play?I have started expanding slowly into the fx market, so we shall see how that works out over time.
This is just a straight-up range bound play I see here. There seems to be an initial move already from the support level.
I am bullish from this point onward unless it's a false move the breaks down below the support level.
Stop at 108.109
Target at 112.654

ETH - Quick trade ideaSet buy order at $690 to $730. Will go up to long term resistance level. Sell around $900-930. Should take about a week to develop. Then dropping to lower low, below $600.


Bitcoin Short Term Going UP on the 4H chartWhy?
- Price is on top of the Komo cloud.
- Price reached the 0.681 Fibonacci retracement line.
- At the bottom of the Pitchfork channel.
To where?
- A retest of the 17K resistance, so that's where i'd set my TP.

Nifty Selling may Halt The nifty index fall from 10150 to 9850 some dead cat bounce or pullback may happen.

MAID 5-10% LONG for next 6 HoursWoke up this morning and MAID was one of few coins not a 24H high, but there is a nice consolidation in play for the next couple of hours that will see it shoot to 15000 over the next 6 hours IMO.
Got some good people telling me this will be good in the long term at Beta and Release stages but for the moment there is a short term opportunity
Need to be quick on this one traders to get in before the break upwards.
Stay focused and trade to trade well


Long XRPBTCRipple is doing higher and higher lows after consolidating for a long time. This is creating a bullish trend-channel as you can see. Short-term there is a rising wedge with the fibbonacci retracement.

Contrary To Some Analysts; Gains Ahead For Macy'sMacy's has been in a bearish downtrend since late 2015. Although the overall trend is down, the stock does cycle up and down throughout the trend. On May 19, the stock bounced off support and should slightly cycle up over the course of the next month and a half. This is the first indicator the stock should move up. With mixed earnings from retail out of the way for now, the following points will highlight why the stock should move upward.
When we take a look at other technical indicators, the relative strength index (RSI) is at 27.2540. RSI tends to determine trends, overbought and oversold levels as well as likelihood of price swings. I personally use anything above 75 as overbought and anything under 25 as oversold. Currently the RSI is overbought and due to drop. This indicator has recently exited oversold territory. The stock is due to slowly move, or move up over the next few weeks. This is the second indicator of potential upward movement.
The true strength index (TSI) is currently -35.5789. The TSI determines overbought/oversold levels and/or current trend. I solely use this as an indicator of trend as overbought and oversold levels vary. The TSI is double smoothed in its calculation and is a great indicator of upward and downward movement. The current movement has the stock moving down.
The positive vortex indicator (VI) is at 0.7106 and the negative is at 1.2909. When the positive level is higher than 1 and higher than the negative indicator, the overall price action is moving upward. When the negative level is higher than 1 and higher than the positive indicator, the overall price action is moving downward. Currently both indicators are at extreme levels which typically lead to a reversal of the stock. The positive indicator should begin to move upward while the negative indicator heads down. This is the third indicator the stock should begin moving up.
The stochastic oscillator K value is 11.4677 and D value is 7.5284. This is a cyclical oscillator that is highly accurate and can be used to identify overbought/oversold levels as well as pending reversals and short-term activity. I personally use anything above 80 as overbought and below 20 as oversold. When the K value is higher than the D value, the stock is trending up. When the D value is higher that the K value the stock is trending down. The stochastic is oversold and the K has finally moved above the D. This is the fourth indication of pending near-term upward movement.
Considering the RSI, TSI, VI and stochastic levels, the overall direction favors a move to the upside. Based on historical movement compared to current levels and the current position, the stock could gain at least 5% over the next 31 trading days if not sooner.

Short-Term Upside For Teck ResourcesTeck Resources has been in a clearly defined downward trend since November 2016. The trend does however cycle up and down very well. Currently the stock is at the bottom of the channel and due to rise for the reasons in this article.
When we take a look at other technical indicators, the relative strength index (RSI) is at 29.9555. RSI tends to determine trends, overbought and oversold levels as well as likelihood of price swings. I personally use anything above 75 as overbought and anything under 25 as oversold. The current reading has the stock flirting at the oversold level. This means the stock will rise at some point in the near future. This is the first indicator of a reversal to the upside.
The true strength index (TSI) is currently -15.73. The TSI determines overbought/oversold levels and/or current trend. I solely use this as an indicator of trend as overbought and oversold levels vary. The TSI is double smoothed in its calculation and is a great indicator of upward and downward movement. The current reading declares the stock has been trending down. Due to the delayed correlation in the movement of the stock, this indicator does not signal the bottom until after the fact. I have used light blue lines on the chart above when the bottom was reached for the stock. The current TSI position is roughly at the same point in the wave. This is the second indicator of a reversal to the upside.
The positive vortex indicator (VI) is at 0.7367 and the negative is at 1.1367. When the positive level is higher than 1 and higher than the negative indicator, the overall price action is moving upward. When the negative level is higher than 1 and higher than the positive indicator, the overall price action is moving downward. Currently the negative indicator is near the top of its cycle, meaning the stock should move up soon. This is the third indicator of a reversal to the upside.
The stochastic oscillator K value is 8.2772 and D value is 7.3369. This is a cyclical oscillator that is highly accurate and can be used to identify overbought/oversold levels as well as pending reversals and short-term activity. I personally use anything above 80 as overbought and below 20 as oversold. When the K value is higher than the D value, the stock is trending up. When the D value is higher that the K value the stock is trending down. Currently this indicator is clearly in oversold territory, due for upward movement in the stock soon. This is the fourth indicator of a reversal to the upside.
During the current trend channel, the stock has risen from bottom to top 3 times. On these movements, the median rise is 25% and median trading days to achieve the movement is 20 days.
Considering the moving average crossover, RSI, TSI, VI and stochastic levels, the overall direction clearly points to some sort of upward movement soon. Based on historical movement compared to current levels and the current position, the stock could gain at least 14% over the next 32 trading days.

EURUSD Bullish BAT 30min chartPRZ at 1.06088
Stop Loss at 1.05889
Target 1 Fib (0.382%) 1.06333
Target 2 Fib (0.618%) 1.06512
Trade management move stop loss to break even when target 1 is hit or split your trade into 2 lots and take out 1 lot at target 1 and let the other one role.
The pattern is valid as long as price does not go beyond time fib 3 marked with a red vertical line on the chart.
Do not use pending orders.

VNDA Descending Triangle Pattern. Short (and Long) Opportunity.Simple probability set up. Triangle downtrend started in 11/2016 and VNDA has only been through one full harmonic trend (wave) ever since. Second wave downward move imminent with RSI confirmation @ 35 and bearish $13 target.
However, aggressive long entry for quick profit ($15 bullish target) especially with upcoming earnings. Upon $15 target, (expected RSI >50) short for mid-term trend follow.
Quick Long Target: $15
First Short Target: $13
Second Short Target: $11.50
Total trade should complete by/in April.

Potential bullish Bat PatternPotential Bullish Bat pattern EURUSD 15m.
Completion at :1.0597
Target 1: 1.0632
Target 2: 1.0654

USDJPY long scalpUSD/JPY short term trend follow strategy. Strong pullback , strong support level , strong trend line, pivot point rejection. 75-80% probability.
