EUR/USD Shorts from 1.09200 (Sell to Buy) My EU bias currently is to catch a temporary move down. As price approaches a high-quality 11-hour supply zone, I'll be watching for a Wyckoff distribution to confirm a sell opportunity.
Whether or not price mitigates the supply zone, I'm expecting it to retrace to a newly formed demand zone, ultimately aiming to make a new high. Therefore, once price reaches the 10-hour demand zone, I will be looking for buy opportunities.
Confluences for EU Sells are as follows :
- Price has been very bullish, breaking structure to the upside.
- The current trend is bullish, matching the dropping DXY.
- There is significant liquidity to the upside, with strong bullish candles on the higher time frame.
- Demand zones have been created near the current price, indicating potential for another rally.
P.S. Once price returns to the 10-hour demand zone, I will be on the lookout for a Change of Character (CHOCH) on the lower time frame to confirm my buy opportunities. For now, I'll wait to see how Monday's market opens.
Shorttermsell

AGIX - not looking good! Prepare for more downside.First of all, I acknowledge that I've changed my mind on AGIX short term price prospects (see previous post in link below). I acknowledged a risk of a pullback but the resulting move was much more decisive than I was expecting. The Bitcoin wobble has really sparked some sudden short-term reversals and hurt the technical charts of a vast number of coins, but it has also given hope to the strength of others (e.g. SOL). Unfortunately, AGIX is in the former camp.
Not making any predictions on medium- and long-term prospects (so AGIX hodlers: this is not for you), but from a short-term perspective this chart is now looking decidedly dicey. Some more shenanigans at the BTC front (see second previous post below), could see AGIX dropping into the $0.50s before bouncing. Also note that the AGIX/BTC gives the same impression:
I continue to believe the excitement around AGIX and the merger is not all hype, though and look forward to seeing it recover and mint a new ATH later in the year.

Price Peak Show Up After Denies Optus Sales' RumorPrice in 5 mins shows unreasonable price & volume formed. Despite high volume traded intraday, but the stock price stays within the range. This could mean the "Jedi" are holding the price up while churning volume to looks good to the public.
From our analysis, we find these price movement a price peak & a possible short term retrace is building up. Which going for a short DLC, $Singtel 5xShortSG241218(DVZW.SI) will make more sense for us.
This is just our short term view based on our analysis. You might like to share your view with us in the comment too! MAY THE FORCE BE WITH US!
About our analysis :
Utilizing the dynamic insights from a 5-minute chart. By closely examining this timeframe, we dissect the intricate volume and price transactions of significant market players. Our aim is to identify short-term support and resistance levels, enabling informed trading decisions. Through this meticulous analysis, we decipher price patterns and trends, providing valuable guidance for traders navigating the fast-paced realm of stock trading.
Disclaimer:
The information provided in this post is for informational purposes only and should not be considered as financial or investment advice. Any action you take upon the information in this post is strictly at your own risk. We are not responsible for any losses or damages that may occur in connection with the use of this information. Always do your own research and consult with a qualified financial advisor before making any investment decisions. The views and opinions expressed in this post are those of the author and do not necessarily reflect the official policy or position of any other agency, organization, employer, or company.
#shorttermtrading #SGX #demandsupplytrade #pricevolumeanalysis #roundnsurge #DLC #shorttermtrading #dailyleveragecertificates #singtel #short

Gold - Elliot's Wave Analysis - March 2024 - Short, then LongThis post will go over 3 wave degrees for $OANDA:XAUUSD.
Primary (4h)
Intermediate (1h)
Minor (30 mins)
Primary Degree:
Wave 1 came to an end just below the December 2023 high of 2088, meaning we are likely entering a wave 2 of a 5 wave impulse. This can be seen on the image below where:
The diagonal trendline links the high of 2148 till the high of March 1st 2024 at 2088.36.
The horizontal trendline linking the high of December 2023 at 2088.58 and the high of march 1st at 2088.38.
Intermediate Degree:
The wave 1 of the primary degree was a zigzag forming an A,B,C. I tried fitting an impulse sequence but an A,B,C respected the rules and guidelines more than a 5 wave did.
Wave A is an impulse from the start at around 1984 to the end of the 5th at 2041. Wave B is a 3 wave flat corrective and wave C is an impulse with an extended 5th. These can all be seen on the Minor degree (see last section of post).
Minor Degree:
As mentioned in my previous post, The wave 1 of the primary degree was a zigzag forming an A,B,C. Wave A is an impulse from the start at around 1984 to the end of the 5th at 2041. Wave B is a 3 wave flat corrective and wave C is an impulse with an extended 5th.
When breaking down wave A, we can establish a clear 5 wave sequence where wave 4 is an expanding triangle leading to a last push (wave 5). The expanding triangle can be seen as A,B,C,D,E and all respect the rules and guidelines of the wave principle.
Wave B and wave C form a 5 wave impulse where Wave B is a flat and a double correction on the smaller degree, hence why the markings of W, X, Y. The end of the flat (Wave B) is also the end of Wave 2. Wave C, on the smaller degree (Minute, 15 min) forms a 5 wave sequence. This can be seen from the end of Wave 2 and the start of Wave 3 on the Minor degree. The Minor degree's 5th wave is extended, rejecting the high, ending the current Minor 5th wave and Intermediate C wave. the image below should allow for clear visualization.
When placing the Fibonacci retracement on the wave 1 of the Primary degree, the most likely retracement point is between, the now support of the monthly trend line going back to 2080 in Dec 2023 till it's break on feb 29th at 2048, and the 0.618 fibonacci level at around 2048.9. The Fibonacci retracement levels can be seen on the second image below this text.
In conclusion, the most likely outcome is for a 5 wave sequence on the Intermediate degree and Minor degree to be our Primary degree Wave 2.
I have placed a short till 2043.95 due to the possibility of the retracement to reject the diagonal trendline a bit below the 0.618 level. I will then Long the 3rd wave till the current ATH, if this 3rd is extended, the next target should be at the most, 2190. Otherwise we will see wave 5 reach near this level on the Primary degree.

XAU/USD - Elliot's Wave Analysis - March 2024 - Short, then LongThis post will go over 3 wave degrees for $OANDA:XAUUSD.
Primary (4h)
Intermediate (1h)
Minor (30 mins)
Primary Degree:
Wave 1 came to an end just below the December 2023 high of 2088, meaning we are likely entering a wave 2 of a 5 wave impulse. This can be seen on the image below where:
The diagonal trendline links the high of 2148 till the high of March 1st 2024 at 2088.36.
The horizontal trendline linking the high of December 2023 at 2088.58 and the high of march 1st at 2088.38.
Intermediate Degree:
The wave 1 of the primary degree was a zigzag forming an A,B,C. I tried fitting an impulse sequence but an A,B,C respected the rules and guidelines more than a 5 wave did.
Wave A is an impulse from the start at around 1984 to the end of the 5th at 2041. Wave B is a 3 wave flat corrective and wave C is an impulse with an extended 5th. These can all be seen on the Minor degree (see last section of post).
Minor Degree:
As mentioned in my previous post, The wave 1 of the primary degree was a zigzag forming an A,B,C. Wave A is an impulse from the start at around 1984 to the end of the 5th at 2041. Wave B is a 3 wave flat corrective and wave C is an impulse with an extended 5th.
When breaking down wave A, we can establish a clear 5 wave sequence where wave 4 is an expanding triangle leading to a last push (wave 5). The expanding triangle can be seen as A,B,C,D,E and all respect the rules and guidelines of the wave principle.
Wave B and wave C form a 5 wave impulse where Wave B is a flat and a double correction on the smaller degree, hence why the markings of W, X, Y. The end of the flat (Wave B) is also the end of Wave 2. Wave C, on the smaller degree (Minute, 15 min) forms a 5 wave sequence. This can be seen from the end of Wave 2 and the start of Wave 3 on the Minor degree. The Minor degree's 5th wave is extended, rejecting the high, ending the current Minor 5th wave and Intermediate C wave. the image below should allow for clear visualization.
When placing the Fibonacci retracement on the wave 1 of the Primary degree, the most likely retracement point is between, the now support of the monthly trend line going back to 2080 in Dec 2023 till it's break on feb 29th at 2048, and the 0.618 fibonacci level at around 2048.9. The Fibonacci retracement levels can be seen on the second image below this text.
In conclusion, the most likely outcome is for a 5 wave sequence on the Intermediate degree and Minor degree to be our Primary degree Wave 2.
I have placed a short till 2043.95 due to the possibility of the retracement to reject the diagonal trendline a bit below the 0.618 level. I will then Long the 3rd wave till the current ATH, if this 3rd is extended, the next target should be at the most, 2190. Otherwise we will see wave 5 reach near this level on the Primary degree.

HTF Bullflag, LTF H&SHowdy - Quick idea here for potential short term and long term setups.
We are in a weekly uptrend and recently saw our first signs of weakness by a double top and neckline retest. The next moves will decide whether we continue our bullish performance or continue to see struggle from buyers at this level.
Bullish Bias: On the weekly, we broke out of a strong bull trend line and approached our swing low. We had a strong bounce (indicating strong support and additional liquidity). We are seeing a potential bull-flag and approaching the top of that down-trend line. Even if we don't break out on this attempt, this is still a longer-term possibility. If we break out of resistance line with force, we can see price continue up to retest the 2.000 psychological level.
Bearish Bias: On the MTF (2HR), if we reject the upper trend line, we can see a drop toward 1.7500 liquidity or at minimum a neckline retest. This is where we might see our H&S play out to propel us toward that demand zone.

Breakout or Fakeout. USD-CAD Top of Wedge Trade SetupsFor a more detailed analysis, see my former post linked below which highlights many points of confluence for a bullish trend continuation.
Here however I want to focus on our current move as we are approaching a strong upper resistance level .
On our weekly chart, we're approaching a large resistance level in the top of a HTF wedge and the bottom of a large supply zone that's been mitigated twice.
We just created a major CHoCH to the upside and though I do believe the market wants to break out of this wedge, I think another liquidity grab is necessary for buyers - perhaps a mitigation of the demand zone sitting just below.
I'm looking for a return to 60% levels within the wedge and a subsequent large upward move for a successful breakout.
For a short trade:
Look for a rejection at these upper wedge levels and await a CHoCH & BOS to the downside on the 15min
For a long trade:
Look for a bounce off demand zone and and await LTF CHoCH & BOS

Short-term Trade Opportunity Approaching - AUDJPYQuick short idea I saw on the charts today:
HTF Recap (from former post - linked below):
We are currently at an impasse on the weekly chart as we could not create a higher high after a strong bullish trend. We recently mitigated the HTF supply zone and held at former strong support however we are now struggling to break our former high.
I believe that if we have any chance of a higher high, we will require a demand zone mitigation below after the strong bullish breakout we had. So this trade seems like a win-win – Either we grab liquidity below, take profit at demand and reanalyze for a potential bullflag push upward toward new highs – or we grab liquidity and continue to drop leaving our second take profit to gain and stop loss at breakeven
LTF Trade Opportunity:
We are sitting at a good spot to look out for short trades toward the demand zone.
Confluence:
1. 15 min – Symmetrical triangle and breakout potential. Resistance at fib 61.8% and 70.7%
2. Daily Chart - Top of descending channel (of potential bullflag for future long play)
3. Weekly resistance above and failure to create HH + Supply zone mitigation
I’m looking to enter on a retest of certain resistance levels (such as the strong fib levels above) and a subsequent CHoCH and supply zone mitigation.
If we don’t test upper resistance and drop straight from this top of channel, we will look for a retest of the bottom of the triangle/breakout and signals to enter from there.

USD-CAD Short-term 4 R:R short setupIn an update to my previous analysis and trade setups posts on the USD/CAD pair:
We are now seeing the rejection we predicted after grabbing liquidity from our HTF supply zone. We rejected off of the upper trendline and are continuing an unconvincing downtrend and more of a consolidation. A breakout to either side is very possible.
This can be part of a massive weekly bullflag to take us out of the HTF downtrend or a reversal from the recent pullback.
I believe for a further push to the upside we need further liquidity and consolidation – lucky for us that level of liquidity is nearby. At this 1.30-1.34 – Look left on the weekly chart and you’ll see this has been a level of attraction and has been broken through and multiple times as both support and resistance.
I expect us to mitigate demand levels below and grab liquidity outside of our trend – with this, expecting a quick and powerful move to the upside having hit these low and attractive levels.
Confluence for short-term Short Trade:
1. On the verge of a Major CHoCH on daily chart
2. HTF strong level below holding a lot of liquidity
3. Upper trendline strong resistance
4. Major demand zones and liquidity below
I will be waiting for this CHoCH on the 15 min time frame to be confirmed and then await a LTF mitigation. Then I will enter a short with my stop loss above the supply zone high/former lower high.
If signals are there, could turn out to be a 4.09 R:R trade with our TP1.

NZD/CAD – Long term analysis & Short term tradeTime Frame:
- Daily/Weekly Analysis
- 1HR/2HR Execution
- 30Min Confirmation
Trend: HTF Downtrend after HTF pullback to 70.70% Fib
Weekly = Downtrend
Daily = Downtrend
1. We are observing the continuation of a downtrend after a large retrace took us to the 70.70% Fibonacci.
2. We then continued our descent within a strict downward trend line (5 bounces off resistance, 3 off support). As of recently, support has been weakening as you see price is not respecting the trendline as strongly as it was. In addition, we are now back into a demand zone that has already been mitigated – meaning, the liquidity that would otherwise help us reverse momentum to the upside is no longer there and instead the lack of buying liquidity should help invalidate and turn this into a supply zone.
3. This happening would in the longer run be helpful for buyers as I do believe, in the longer run, price wants to reverse and we want to create a HTF higher High and mitigate Supply levels above. However, buyers lack liquidity at the moment and could use a strong low/level of support/demand zone to propel this reversal.
This current level/zone is likely an induced order block to bait buyers in however I would be careful of price potentially holding at strong support and psychological .7900 level which is also the bottom of our mitigated demand zone – this could propel a large move to the upside and begin the HTF reversal.
My short term hypothesis and trade plan for NZD/CAD is since we just recently had a liquidity grab and hit our LTF supply zone, I will wait for a strong resistance off our current 8.08 level (61.8% fib) and with confirmation, take a short trade toward the bottom of our nearer demand zone and ultimately to our POI below.
Confluence:
1. Weakened Support/Trend line breaks
2. 61.8% resistance / Liquidity Grab for further push downward
3. Mitigated demand zone turning to Supply Zone
4. Strong unmitigated demand zone below for necessary liquidity
5. Lacking liquidity for HTF reversal
Trade Plan as follows:
Stop Loss: Above mitigated demand zone
Take Profit 1: Bottom of mitigated demand zone = 3.36 R:R
Take Profit 2: Top of unmitigated demand zone / POI = 5.67 R:R
*Take Profit 3: Retest of Lowest low / bottom of demand zone = 10.5 R:R

USD/CAD HTF and LTF Trades Breakdown and AnalysisOver the past few days i've posted a few trade ideas and setups specifically in regard to the USD/CAD pair.
In this video I walk you through my thought process for the overall future of the pair in addition to a breakdown of the trades I took (2/3 have hit their take profit so far) and my setup for taking them.
This is my first analysis video so I apologize if it's a little long - tried to get as much helpful and pertinent info in as possible. As always, feel free to reach out with any questions, comments, requests, etc!
Happy Trading!
- FourXTrader

USD/CAD LTF Trade SetupOn the 1 hour chart, after a HTF double top and subsequent CHoCH, we identified the Supply zone which was hit and that led to a bearish Break of Structure (BOS).
We now have an opportunity to enter a short position once price reaches the Supply Zone created by the most recent BOS. We will only take this trade if price reaches our supply zone with low volume – any strong momentum move upward will invalidate our trade setup.
We will take profit at the next Break of structure (prior to break as it is also an area of strong support) with a potential longer term Take Profit 2 below at an unmitigated demand zone.
Stop loss: Above LTF Supply Zone (Created by recent BOS)
Take Profit 1: Next Break of structure at 1.351 = 2.0 R:R
Take Profit 2: Unmitigated HTF Demand Zone @ 1.3388 = 6.9 R:R

USD/CAD Short Trade with a 4.93 R:RReasons for this trade (Step by Step):
1. On the daily time frame we broke out of a strong uptrend and trend line which had 5 bounces of support and 3 points of resistance.
2. After breaking out, we immediately mitigated our HTF supply zone which gave us enough liquidity and downside momentum for bearish Change in Character (CHoCH).
3. We then found the CHoCH supply zone and waited for price to touch (which happened last week)
4. My hypothesis (as projected on the chart) is in order to sustain a continued bull trend on the higher time frame, price will need to mitigate these lower demand zones (former support within trend line) and which hold large amounts of liquidity for buyers to take advantage of.
Confluence:
1. Golden Bounce – 61.8% if with Fib measured from previous low & Psychological support 1.20 to the Recent high of 1.47
2. Strong bounces off resistance with high volume at 1.379 & 1.365
3. Strong Support level at 50% Fib – can offer liquidity for further push down if support fails
Trade Details:
Stop loss is above our CHoCH Supply zone
Take Profit 1 = 61.8% Fib
Take Profit 2 = Lower demand zone/POI

GU Analysis update 4H and 15M4H internal switched bearish last week and we just broke below again giving us a clearer range to look at. 15 Min is bearish as well and I'll be looking to short in the next few days

EURAUD Update I What to Expect from this PairWelcome back! Let me know your thoughts in the comments!
** EURAUD Analysis - Listen to video!
We recommend that you keep this pair on your watchlist and enter when the entry criteria of your strategy is met.
Please support this idea with a LIKE and COMMENT if you find it useful and Click "Follow" on our profile if you'd like these trade ideas delivered straight to your email in the future.
Thanks for your continued support!

EURCAD I Approaching resistance zone Welcome back! Let me know your thoughts in the comments!
** EURCAD Analysis - Listen to video!
We recommend that you keep this pair on your watchlist and enter when the entry criteria of your strategy is met.
Please support this idea with a LIKE and COMMENT if you find it useful and Click "Follow" on our profile if you'd like these trade ideas delivered straight to your email in the future.
Thanks for your continued support!

XAUUSD (Gold spot) Bulls and Bear FightXauusd accepted the psychological Resistance 1850
Bears will control below 1845 as strong resistance for short term
Bulls will back in the 1830 Level

USD/CHF chart idea USD/CHF Pre market analysis I’ll short if price goes above the relative equal high. I’ll also be expecting it to go through the fvg and take partial at poi also re enter at poi
Btc — bc1qzjhcun30unqxrwaj6xnul3h4lxq33acy3v63em

XMR Missing Corrective waveWe still lack one more leg down before fufilling larger scale wxy on Elliott wave. Good entry for short here. On the smaller fractal of WXY we're just missing that X leg.

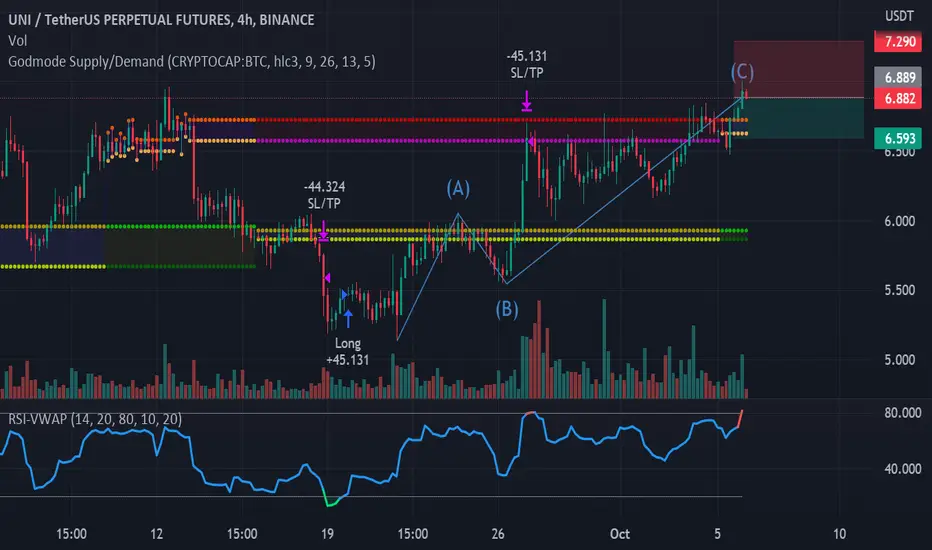
4h harmonic pattern UNIEntry price :6.891
Stop Price : 7.290
Take Price : 6.593
RSI : 68.47
RSI Divergence : Yes
BTC : Short it Here is a simple short term trade i'm opening (all details in the chart).
Basically, we short now from about 30000-30300 and TP to 27k with a SL slightly above our entry.
Let's see how it goes
Comment your thoughts.

EURCAD Analysis I Bullish! Welcome back! Here's an analysis of this pair!
**GBPJPY - Listen to video!
We recommend that you keep this pair on your watchlist and enter when the entry criteria of your strategy is met.
Please support this idea with a LIKE and COMMENT if you find it useful and Click "Follow" on our profile if you'd like these trade ideas delivered straight to your email in the future.
Thanks for your continued support!
Brian & Kenya Horton, BK Forex Academy

Gold Sell Setup (Short-term).This count is based on my assumptions so anything can happen not a trading or financial advice just for educational purposes only kindly do your own ta thanks trade with care good luck.
