Smells Like a Trend ReversalWeekly Recap – Gold Market
Monday, May 12, 2025
The week began with a sharp GAP during the Asian session (starting around 1:00 AM London / 8:00 PM New York on Sunday) :
Gold dropped abruptly by $60, from $3,325 to $3,266.
The catalyst was a temporary easing of trade tensions between the U.S. and China, following weekend negotiations that led to a 90-day tariff pause.
During the European session (starting at 8:00 AM London / 3:00 AM New York) , the downtrend continued, pushing the price further down to $3,207.
Tuesday–Wednesday, May 13–14
Between these two sessions, the price consolidated within a narrow range of $3,265 to $3,202 (63 $ range).
Despite better-than-expected U.S. inflation data, there was no significant breakout—the market remained indecisive.
Wednesday, May 14 – European Session
The price continued its descent, falling from $3,243 to $3,168—a $75 drop—indicating persistent downward pressure despite macroeconomic stability.
Thursday, May 15
The Asian session (1:00 AM London / 8:00 PM New York) began quietly, with a range between $3,168 and $3,192.
Then a sharp drop to $3,123 followed (down $71), triggered by new statements from President Trump, who announced potential trade deals with India, Japan, and South Korea.
In the European session (8:00 AM London / 3:00 AM New York) , a strong reversal occurred.
After failed peace negotiations between Russia and Ukraine in Istanbul, and due to growing geopolitical uncertainty plus a weakening dollar, gold surged by $132, from $3,120 to $3,252.
Friday, May 16
The Asian session opened slightly bearish, with gold dipping from $3,252 to $3,218.
However, bullish momentum returned during the European and U.S. sessions, continuing Thursday’s upward trend and adding $51 by day’s end.
📰 Geopolitical News Landscape
India / Pakistan
Since the Kashmir terror attack on May 9, 2025, tensions have escalated again.
Cross-border airstrikes and border closures have resumed. A fragile ceasefire, brokered by the U.S., is under pressure.
Disputes over water rights further strain relations.
➡️ Short-term outlook: high tension remains.
Gaza Conflict
On May 9, Israel launched Operation Gideon’s Chariot against Hamas, aiming to dismantle the group and rescue hostages.
Over 300 deaths have been reported. A leaked plan suggests Gaza will be divided into three heavily controlled zones.
The humanitarian situation is catastrophic (over 53,000 deaths since 2023).
Peace talks are underway in Doha, but the situation remains dire.
➡️ No relief in sight.
Russia / Ukraine
Direct talks were held in Istanbul for the first time in three years.
While a prisoner exchange (1,000 each side) took place, no substantial progress was achieved.
Russia demands Ukrainian troop withdrawals from contested areas—Kyiv refuses.
Simultaneously, Russian attacks intensified, including drone strikes on Sumy.
➡️ A ceasefire remains unlikely in the near term.
U.S.–China Trade War
A 90-day tariff pause was announced the weekend before May 12:
U.S. tariffs cut from 145% to 30%
Chinese tariffs reduced from 125% to 10%
Markets reacted positively at first—especially in retail and shipping sectors.
➡️ However, unresolved structural issues (e.g., tech transfers, export controls) keep tensions fragile.
No comprehensive deal is in sight.
⚖️ Trump vs. Powell
Tensions escalate between President Trump and Fed Chair Jerome Powell:
- Trump demands aggressive rate cuts
- Powell warns of inflation risks
- The Fed holds the interest rate steady at 4.25–4.5%
- A 10% staff reduction is planned at the Fed for “efficiency”
➡️ The growing political interference is increasing market instability.
📉 U.S. Inflation – April 2025
The official inflation rate dropped to 2.3%, the lowest since February 2021.
However, consumer inflation expectations soared to 7.3%, the highest since 1981.
The University of Michigan Consumer Sentiment Index fell to 50.8—a historic low.
➡️ A clear gap between perception and data is emerging.
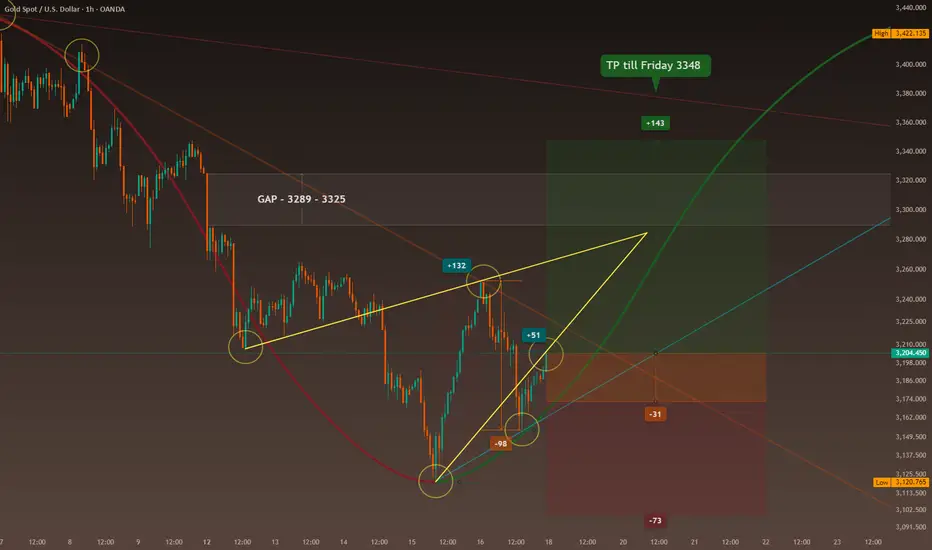
📊 Technical Analysis – Short-Term
Since May 12, an open GAP exists between $3,289 and $3,325 (36 $ range)
A V-shaped reversal formed from the low on May 15 ($3,120) to the Friday close ($3,204)
Symmetrical triangle formation suggests a convergence around $3,284 (possible by Tuesday)
➡️ Current trading range: $3,172 to $3,285 (113 $ range)
💡 Outlook for Monday, May 19
Time-Zone-Based Expectations:
Asia session (starting 1:00 AM London / 8:00 PM New York Sunday):
👉 Potential retest of $3,154
Europe session (8:00 AM London / 3:00 AM New York):
👉 Bullish outlook toward $3,234
U.S. session (2:30 PM London / 9:30 AM New York):
👉 Possible continuation of bullish move — open-ended potential
📌 Trade Setup – Monday 8:00 AM (London) / 3:00 AM (New York)
If price is below $3,154 → I stay flat and wait for clear signals
If price is above $3,172 → I consider a long position, unless conflicting news emerges
🎯 Weekly Target
My goal for the week is $3,348, provided the U.S. Dollar Index (DXY) holds near the 100-point level.
🧠 Conclusion
I am increasingly convinced that news-driven trading delivers the best results—if one can properly interpret the signals.
🔢 Fibonacci Levels
1h chart: low $3,131 → high $3,500 (April 22)
Levels: 0.315, 0.382, 0.5
1h chart: low $3,131 → high $3,435 (May 6)
Levels: 0.315, 0.382, 0.5
1h chart: low $3,131 → high $3,252 (May 16)
Levels: 0.315, 0.382, 0.5
-------------------------------------------------------------------------
This is just my personal market idea and not financial advice! 📢 Trading gold and other financial instruments carries risks – only invest what you can afford to lose. Always do your own analysis, use solid risk management, and trade responsibly.
Good luck and safe trading! 🚀📊
Shorttimeframe
THORChain (RUNE): Chances for a Swing TradeOn the two-hour timeframe, the clarity of the market movements for BINANCE:RUNEUSDT becomes even more evident. The end of Wave ((i)) is marked by our high at $11.47. Following this peak, there has been a consistent downtrend, punctuated by a brief corrective phase—this is typical market Elliott Wave behavior.
We potentially have the end of Wave ((ii)) established within the 50% to 78.6% retracement levels. Additionally, a Fair Value Gap (FVG) is marked in yellow on this chart. This scenario presents a second strategic play for Rune.
We would wait for the price to rise, triggering a change in structure. This would involve retesting the trendline and the Fair Value Gap, then breaking out above and re-touching the support zone where we could place our entry.
This strategy would represent a short-term trade opportunity but is quite intriguing due to the dynamics at play on the lower timeframe. It’s feasible that we might follow this plan depending on how the situation develops with Rune.

GBPNZD-15M-NONTRENDINGGBPNZD is making any bullish or bearish trend in short time frame and respecting support and resistance
idea is if GBPNZD will break the support or resistance our order will be execute on second support and resistance

It will pushed down from the Clip sooner or later. In case you didn't know, sometimes even I don't know short-term direction for $BTC. What I do then is to wait. Obviously waiting is better than doing risky shit. Market always provides good setups if you have patience.
Watching, for something like this maybe. Will decide then.

A Buy Entry Levels of Ethereum/USDT Pair Hello Guys You All!
Here Is the Draw Level of eth/usdt perp pair. I analyzed that a little reversal possible at draws level. but this isn't not confirmed for long only depend on this level. We need more confirmations at this level like, candlestick behavior or pattern or Price momentum with a help of indicators.. So we need to patience for a good entry on long side.
Hope So You All like analysis. If wrong in analysis please give comment for correction

GBP/USD 5 short minute ⬇️Market can go a little up until 1.21645 then can reverse with down trend , we can trade down from 1.21645 to until 1.20944.

Gold in 30 minutesThe chart was moving in a parallel channel, and it broke the channel to the upward. It hasn’t broken the previous resistance in a proper way so we have to wait to get the breakout confirmation. If the bulls were stronger than the bears, we speculate that GOLD will continue its uptrend to 1912$ zone.

Back and touch line failure in higher timesBack and touch the failure line in a higher time and the purchase price at the same price in time 15 and short-term growth in terms of the price action

