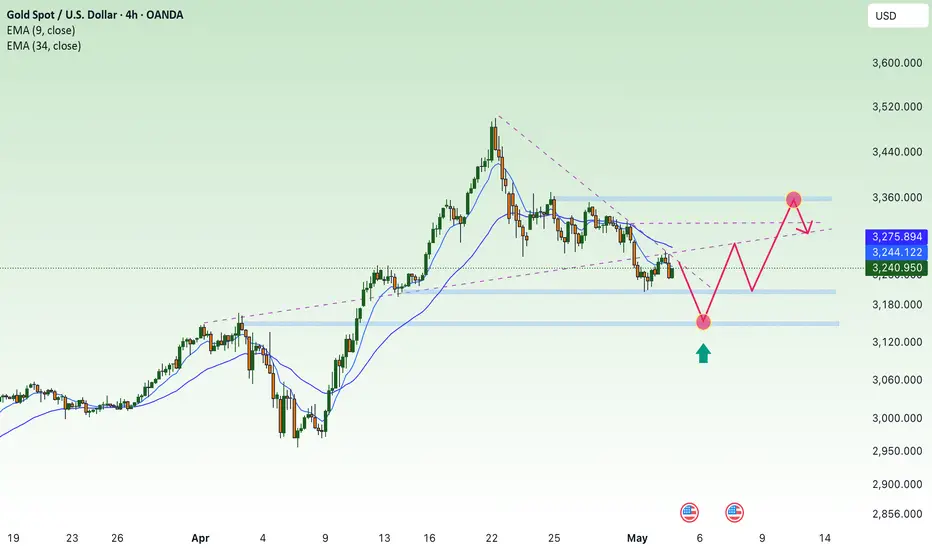
H4 frame accumulation 2 trend lines✍️ NOVA hello everyone, Let's comment on gold price next week from 05/12/2025 - 05/16/2025
🔥 World situation:
Gold prices advanced over 1% on Friday, rebounding as the US Dollar (USD) softened following a two-day winning streak, pressured by declining US Treasury yields. Renewed risk-off sentiment, fueled by persistent geopolitical tensions, bolstered demand for the safe-haven metal. At the time of writing, XAU/USD is trading near $3,338.
US equity markets slipped as investors adopted a cautious stance ahead of Saturday’s high-stakes meeting between US and Chinese delegations in Switzerland. While hopes for a de-escalation in trade tensions remain elevated, uncertainty continues to dominate sentiment.
Adding to the volatility, US President Donald Trump reignited trade concerns by stating on social media, “80% Tariff on China seems right! Up to Scott B.”
🔥 Identify:
Gold prices slow down, starting to accumulate more. Trade negotiations will appear more, putting selling pressure on gold prices in the near future.
🔥 Technically:
Based on the resistance and support areas of the gold price according to the H4 frame, NOVA identifies the important key areas as follows:
Resistance: $3402, $3435
Support : $3282, $3203
🔥 NOTE:
Note: Nova wishes traders to manage their capital well
- take the number of lots that match your capital
- Takeprofit equal to 4-6% of capital account
- Stoplose equal to 2-3% of capital account
- The winner is the one who sticks with the market the longest
Shorttrade

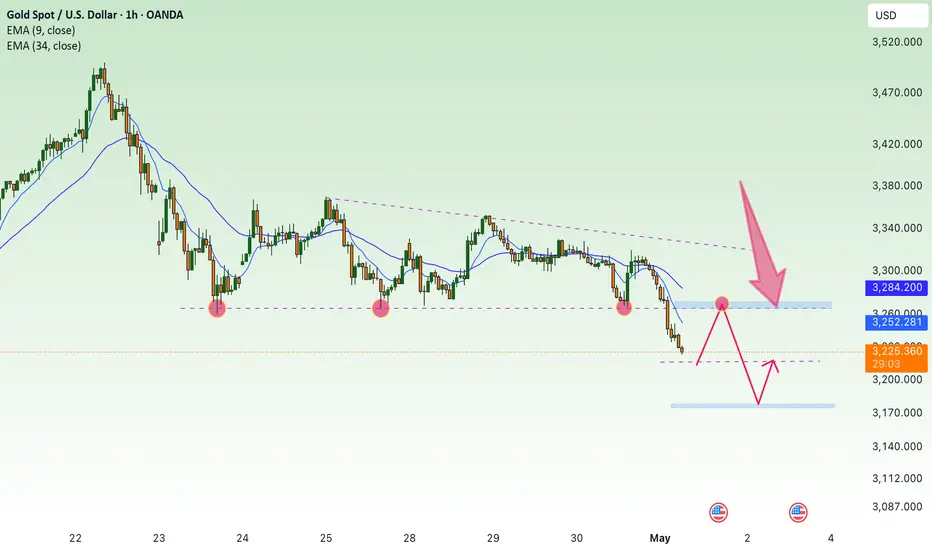
Downtrend - will gold price return to 3233?⭐️GOLDEN INFORMATION:
Gold price (XAU/USD) rebounded from an early Asian session drop to a multi-day low, reclaiming ground above the $3,300 psychological level in the past hour. The precious metal continues to draw support from persistent geopolitical uncertainties, including the Russia-Ukraine conflict, intensifying tensions in the Middle East, and renewed friction along the India-Pakistan border. That said, the upside appears constrained by improving risk sentiment, driven by renewed optimism surrounding a US-UK trade agreement and the launch of US-China tariff negotiations over the weekend.
⭐️Personal comments NOVA:
Gold prices are under great selling pressure as trade negotiations on tariffs are becoming more active. They may return to the 323x price zone and continue to accumulate.
⭐️SET UP GOLD PRICE:
🔥SELL GOLD zone : 3351- 3353 SL 3358
TP1: $3340
TP2: $3330
TP3: $3320
🔥BUY GOLD zone: $3232 - $3234 SL $3227
TP1: $3245
TP2: $3260
TP3: $3270
⭐️Technical analysis:
Based on technical indicators EMA 34, EMA89 and support resistance areas to set up a reasonable sell order.
⭐️NOTE:
Note: Nova wishes traders to manage their capital well
- take the number of lots that match your capital
- Takeprofit equal to 4-6% of capital account
- Stoplose equal to 2-3% of capital account

bullish momentum, accumulating around 3400⭐️GOLDEN INFORMATION:
Gold price (XAU/USD) regained strong upward momentum during the Asian session on Thursday, rebounding sharply above the $3,400 level in the past hour and recovering much of its overnight pullback from a two-week high. The renewed demand for the safe-haven metal comes as US President Donald Trump downplayed expectations of an imminent resolution to the US-China trade dispute, stating he feels "no rush" to finalize an agreement. Heightened geopolitical tensions—including the ongoing Russia-Ukraine war, instability in the Middle East, and escalating military friction between India and Pakistan—further support gold's appeal as a defensive asset.
⭐️Personal comments NOVA:
Gold price continues to recover well around 3400, FED's speech is quite moderate, predicted early by investors, the market is positive in the recovery trend this week
⭐️SET UP GOLD PRICE:
🔥SELL GOLD zone : 3438- 3440 SL 3445
TP1: $3425
TP2: $3410
TP3: $3395
🔥BUY GOLD zone: $3352 - $3350 SL $3345
TP1: $3365
TP2: $3380
TP3: $3400
⭐️Technical analysis:
Based on technical indicators EMA 34, EMA89 and support resistance areas to set up a reasonable sell order.
⭐️NOTE:
Note: Nova wishes traders to manage their capital well
- take the number of lots that match your capital
- Takeprofit equal to 4-6% of capital account
- Stoplose equal to 2-3% of capital account

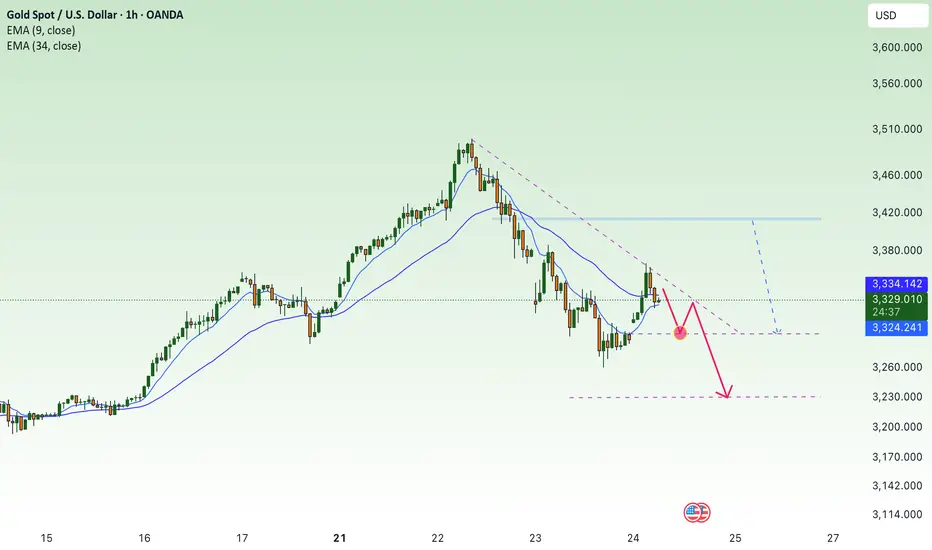
Interest rates, will gold prices fall sharply today?⭐️GOLDEN INFORMATION:
However, US Dollar bulls appear cautious, holding back from making bold moves as they await clearer signals regarding the Federal Reserve’s (Fed) future rate-cut trajectory. This wait-and-see stance, combined with ongoing geopolitical tensions—particularly the prolonged Russia-Ukraine conflict and unrest in the Middle East—continues to bolster demand for safe-haven assets like gold. As such, investors are likely to remain on the sidelines until the conclusion of the closely watched two-day FOMC policy meeting on Wednesday.
⭐️Personal comments NOVA:
Gold price awaits today's interest rate result, there was a good recovery above 3400 but then fell immediately after, showing that the market is not ready for the first interest rate cut if any, gold price may face strong selling pressure today
⭐️SET UP GOLD PRICE:
🔥SELL GOLD zone : 3438- 3440 SL 3445
TP1: $3425
TP2: $3410
TP3: $3395
🔥SELL GOLD zone : 3396- 3398 SL 3402 scalping
TP1: $3390
TP2: $3380
TP3: $3365
🔥BUY GOLD zone: $3308 - $3306 SL $3301
TP1: $3315
TP2: $3330
TP3: $3345
⭐️Technical analysis:
Based on technical indicators EMA 34, EMA89 and support resistance areas to set up a reasonable sell order.
⭐️NOTE:
Note: Nova wishes traders to manage their capital well
- take the number of lots that match your capital
- Takeprofit equal to 4-6% of capital account
- Stoplose equal to 2-3% of capital account

Sideway range, gold price accumulates below 3302⭐️GOLDEN INFORMATION:
Gold price (XAU/USD) kicked off the week on a positive note, rising toward the $3,271 level during Monday’s Asian session as a blend of geopolitical and economic concerns fueled demand for the safe-haven asset. The prolonged Russia-Ukraine conflict, coupled with renewed tensions in the Middle East, continues to elevate global risk sentiment. Meanwhile, lingering uncertainty surrounding US President Donald Trump's tariff agenda has added to investor caution, further supporting the appeal of gold as a hedge in times of instability.
⭐️Personal comments NOVA:
Gold price continues to accumulate, low amplitude at the beginning of the week, waiting for the most important interest rate information this week
⭐️SET UP GOLD PRICE:
🔥SELL GOLD zone : 3302- 3304 SL 3309
TP1: $3290
TP2: $3280
TP3: $3270
🔥BUY GOLD zone: $3204 - $3206 SL $3199
TP1: $3215
TP2: $3224
TP3: $3240
⭐️Technical analysis:
Based on technical indicators EMA 34, EMA89 and support resistance areas to set up a reasonable SELL order.
⭐️NOTE:
Note: Nova wishes traders to manage their capital well
- take the number of lots that match your capital
- Takeprofit equal to 4-6% of capital account
- Stoplose equal to 2-3% of capital account

Lack of bullish momentum, gold price waits, slight decrease✍️ NOVA hello everyone, Let's comment on gold price next week from 05/05/2025 - 05/09/2025
🔥 World situation:
Gold (XAU/USD) slipped by more than 0.35% on Friday and is on track to close the week with a decline exceeding 2.5%, as easing trade tensions and upbeat US labor market data boosted investor risk appetite. This shift in sentiment encouraged profit-taking ahead of the weekend, weighing on the safe-haven asset. At last check, XAU/USD was trading around $3,226, pulling back from an intraday peak of $3,269.
Adding to the improved market mood, China’s Commerce Ministry confirmed that the US has shown a willingness to resume discussions on tariffs, while reiterating that Beijing remains open to dialogue.
🔥 Identify:
Gold price continues to adjust down, lacking momentum to increase price. around price range 3200 - 3350
🔥 Technically:
Based on the resistance and support areas of the gold price according to the H4 frame, NOVA identifies the important key areas as follows:
Resistance: $3285, $3316, $3355
Support : $3202, $3155
🔥 NOTE:
Note: Nova wishes traders to manage their capital well
- take the number of lots that match your capital
- Takeprofit equal to 4-6% of capital account
- Stoplose equal to 2-3% of capital account
- The winner is the one who sticks with the market the longest
NF fluctuates in a downward trend⭐️GOLDEN INFORMATION:
China’s Ministry of Commerce announced Friday that the United States has recently initiated communication through official channels, expressing interest in reopening talks on tariffs. Beijing is currently evaluating the proposal, fueling optimism that a resolution to the prolonged tariff standoff between the world’s two largest economies may be on the horizon.
This renewed hope for a breakthrough in trade negotiations helped lift the US Dollar to a three-week high on Thursday, pressuring Gold prices down toward the $3,200 mark. However, bullish momentum for the USD remains tempered as markets increasingly price in the likelihood of more aggressive rate cuts by the Federal Reserve, especially with the closely watched US Nonfarm Payrolls data looming.
⭐️Personal comments NOVA:
NF news volatility is certain, with the big accumulation from last week. Gold price has confirmed the trend after breaking 3267, will fluctuate in a downtrend below 3200
⭐️SET UP GOLD PRICE:
🔥SELL GOLD zone : 3312- 3310 SL 3317
TP1: $3290
TP2: $3280
TP3: $3270
🔥BUY GOLD zone: $3175 - $3177 SL $3170
TP1: $3185
TP2: $3200
TP3: $3210
⭐️Technical analysis:
Based on technical indicators EMA 34, EMA89 and support resistance areas to set up a reasonable SELL order.
⭐️NOTE:
Note: Nova wishes traders to manage their capital well
- take the number of lots that match your capital
- Takeprofit equal to 4-6% of capital account
- Stoplose equal to 2-3% of capital account

Looking to short CL to continue lowerCL is making a corrective move higher before moving down to the ultimate target of last Daily structure leg down. It retraced to Daily bearish Fair Value Gaps (internal range liquidity zones) which should act as resistance. 15M bearish structure is in Extreme premium.
I'm looking for CL to break down bullish corrective structure on 5M chart and start a final move down.

Gold price weakens, correction 3176⭐️GOLDEN INFORMATION:
Gold’s intraday decline appears partly driven by technical selling pressure after decisively breaking below the key $3,265–$3,260 support zone. However, the US Dollar (USD) struggles to sustain any significant recovery as expectations grow for more aggressive Federal Reserve (Fed) rate cuts—fueled by an unexpected contraction in US GDP and signs of softening inflation. These factors may continue to support demand for the non-yielding precious metal, suggesting that traders should remain cautious before anticipating a deeper pullback from the recent all-time high near $3,500.
⭐️Personal comments NOVA:
Crossing the 3264 mark in the sideways price zone, gold prices continue to weaken.
⭐️SET UP GOLD PRICE:
🔥SELL GOLD zone : 3270- 3272 SL 3277
TP1: $3260
TP2: $3250
TP3: $3240
🔥BUY GOLD zone: $3178 - $3176 SL $3171
TP1: $3185
TP2: $3200
TP3: $3210
⭐️Technical analysis:
Based on technical indicators EMA 34, EMA89 and support resistance areas to set up a reasonable SELL order.
⭐️NOTE:
Note: Nova wishes traders to manage their capital well
- take the number of lots that match your capital
- Takeprofit equal to 4-6% of capital account
- Stoplose equal to 2-3% of capital account
continue to accumulate, gold price waiting for NF⭐️GOLDEN INFORMATION:
Gold price (XAU/USD) continues its downward trajectory, slipping toward $3,315 during early Asian trading on Wednesday as improving global risk sentiment and signs of easing trade tensions weigh on demand for the safe-haven asset. Market participants remain cautious ahead of key US economic data releases, including the ADP Employment Change, the Core PCE Price Index, and the preliminary Q1 GDP figures, all scheduled for later in the day.
Meanwhile, US President Donald Trump is reportedly aiming to reduce the overall impact of automotive tariffs by avoiding cumulative duties on foreign vehicles and loosening restrictions on imported parts used in domestic production. Treasury Secretary Scott Bessent added that major trade partners have made “very good” proposals to avert further US tariffs. Furthermore, exemptions on select US goods from retaliatory duties suggest a growing intent to de-escalate ongoing trade disputes.
⭐️Personal comments NOVA:
Gold price maintains accumulation range of 3265 - 3360, temporary stability awaits big fluctuations
⭐️SET UP GOLD PRICE:
🔥SELL GOLD zone : 3368- 3370 SL 3375
TP1: $3350
TP2: $3340
TP3: $3330
🔥BUY GOLD zone: $3264 - $3262 SL $3257
TP1: $3280
TP2: $3300
TP3: $3318
🔥BUY GOLD zone: $3285 - $3283 SL $3280 scalping
TP1: $3290
TP2: $3295
TP3: $3300
⭐️Technical analysis:
Based on technical indicators EMA 34, EMA89 and support resistance areas to set up a reasonable SELL order.
⭐️NOTE:
Note: Nova wishes traders to manage their capital well
- take the number of lots that match your capital
- Takeprofit equal to 4-6% of capital account
- Stoplose equal to 2-3% of capital account

What is gold waiting for? Stuck in the 3300 area⭐️GOLDEN INFORMATION:
Gold price (XAU/USD) fails to build on Monday’s rebound from the key $3,265–$3,260 support zone, encountering renewed selling pressure during the Asian session on Tuesday. Although signals from the US and China remain mixed, investor sentiment remains buoyed by hopes of a potential easing in trade tensions between the world’s two largest economies. Additionally, signs of advancement in tariff negotiations have further bolstered optimism, dampening the appeal of the safe-haven metal.
⭐️Personal comments NOVA:
Gold price needs to be boosted by economic news to break out of the sideways price range around 3300, continue to wait today around 3300
⭐️SET UP GOLD PRICE:
🔥SELL GOLD zone : 3366- 3368 SL 3373
TP1: $3350
TP2: $3340
TP3: $3330
🔥BUY GOLD zone: $3267 - $3265 SL $3260
TP1: $3280
TP2: $3300
TP3: $3318
🔥BUY GOLD zone: $3301 - $3299 SL $3296 scalping
TP1: $3305
TP2: $3310
TP3: $3320
⭐️Technical analysis:
Based on technical indicators EMA 34, EMA89 and support resistance areas to set up a reasonable SELL order.
⭐️NOTE:
Note: Nova wishes traders to manage their capital well
- take the number of lots that match your capital
- Takeprofit equal to 4-6% of capital account
- Stoplose equal to 2-3% of capital account

Short-Term Opportunity Emerges for XAUUSDOn the 1-hour timeframe, I anticipate that XAUUSD remains vulnerable to further correction, at least to retest the 3303–3322 area. Subsequently, as long as XAUUSD is able to stay above 3273, there remains a short-term opportunity for a rebound toward the 3356–3376 area.

H4 downtrend line, gold price cools down✍️ NOVA hello everyone, Let's comment on gold price next week from 04/28/2025 - 05/02/2025
🔥 World situation:
Gold prices reversed course on Friday, wiping out Thursday’s gains and slipping below the $3,300 threshold, as persistent US Dollar strength weighed heavily on the precious metal despite declining US Treasury yields. The easing of tensions in the US-China trade dispute further pressured bullion, with XAU/USD trading around $3,294, down more than 1.6%.
Market sentiment remains fragile, swinging sharply between risk-on and risk-off modes in response to comments from US President Donald Trump. Earlier, Bloomberg reported that China was considering tariff exemptions on some US goods, sparking optimism. However, the mood soured after Trump asserted that he would not lift tariffs on China without significant concessions.
🔥 Identify:
News about Russia-Ukraine peace talks this weekend will continue to put selling pressure on gold prices next week. Moving along the downtrend line H4
🔥 Technically:
Based on the resistance and support areas of the gold price according to the H4 frame, NOVA identifies the important key areas as follows:
Resistance: $3357, $3498
Support : $3228, $3155
🔥 NOTE:
Note: Nova wishes traders to manage their capital well
- take the number of lots that match your capital
- Takeprofit equal to 4-6% of capital account
- Stoplose equal to 2-3% of capital account
- The winner is the one who sticks with the market the longest

Gold price heading below 3300⭐️GOLDEN INFORMATION:
Federal Reserve (Fed) officials have signaled openness to potential interest rate cuts, a stance that could limit further upside in the US Dollar (USD) and lend support to the non-yielding Gold price. Additionally, growing concerns over the economic repercussions of President Donald Trump’s aggressive tariff measures, combined with ongoing geopolitical instability, continue to bolster the appeal of safe-haven assets. In this environment, the broader bias for gold remains tilted to the upside, urging caution for traders considering bold bearish positions.
⭐️Personal comments NOVA:
continue sideways, price range fluctuates around 3300
⭐️SET UP GOLD PRICE:
🔥SELL GOLD zone : 3382- 3384 SL 3389
TP1: $3370
TP2: $3360
TP3: $3350
🔥BUY GOLD zone: $3294 - $3292 SL $3287
TP1: $3300
TP2: $3310
TP3: $3320
⭐️Technical analysis:
Based on technical indicators EMA 34, EMA89 and support resistance areas to set up a reasonable SELL order.
⭐️NOTE:
Note: Nova wishes traders to manage their capital well
- take the number of lots that match your capital
- Takeprofit equal to 4-6% of capital account
- Stoplose equal to 2-3% of capital account

Gold's short-term decline continues⭐️GOLDEN INFORMATION:
Gold price (XAU/USD) regained strong upward momentum during the Asian session on Thursday, rebounding sharply from the previous day’s steep decline and ending a two-day losing streak near the $3,260 weekly low. The renewed buying interest comes amid lingering concerns over the protracted trade impasse between the US and China, following US Treasury Secretary Scott Bessent’s comments indicating that the standoff could drag on.
Compounding market anxiety is the persistent uncertainty surrounding President Donald Trump’s tariff policies and their broader implications for global growth. These factors have fueled a fresh wave of safe-haven demand, driving investors back toward gold.
⭐️Personal comments NOVA:
Still under selling pressure, gold price is consolidating below the downtrend line. Trading around 3300 and lower.
⭐️SET UP GOLD PRICE:
🔥SELL GOLD zone : 3412- 3414 SL 3419
TP1: $3390
TP2: $3380
TP3: $3370
🔥BUY GOLD zone: $3228 - $3230 SL $3223
TP1: $3240
TP2: $3250
TP3: $3260
⭐️Technical analysis:
Based on technical indicators EMA 34, EMA89 and support resistance areas to set up a reasonable SELL order.
⭐️NOTE:
Note: Nova wishes traders to manage their capital well
- take the number of lots that match your capital
- Takeprofit equal to 4-6% of capital account
- Stoplose equal to 2-3% of capital account
Gold price stabilized again, trading around 3300⭐️GOLDEN INFORMATION:
Gold price (XAU/USD) found fresh buying interest during the Asian session on Wednesday, pausing its pullback from the previous day’s record high near $3,500. Attempts by the US Dollar (USD) to rebound from multi-year lows faltered, as investor confidence in the US economic outlook continues to erode amid President Donald Trump’s erratic tariff policy shifts.
Additionally, growing expectations of more aggressive monetary easing by the Federal Reserve (Fed) have triggered renewed selling pressure on the greenback. This, in turn, has reinforced demand for the non-yielding yellow metal, helping gold regain upward momentum as investors seek shelter from mounting economic and policy uncertainty.
⭐️Personal comments NOVA:
The slowdown and downward adjustment of gold are inevitable. Profit-taking psychology and cooling news of tariffs and Russia-Ukraine military forces caused gold prices to fall.
⭐️SET UP GOLD PRICE:
🔥SELL GOLD zone : 3410- 3412 SL 3417
TP1: $3390
TP2: $3380
TP3: $3370
🔥BUY GOLD zone: $3281 - $3283 SL $3276
TP1: $3290
TP2: $3300
TP3: $3315
⭐️Technical analysis:
Based on technical indicators EMA 34, EMA89 and support resistance areas to set up a reasonable SELL order.
⭐️NOTE:
Note: Nova wishes traders to manage their capital well
- take the number of lots that match your capital
- Takeprofit equal to 4-6% of capital account
- Stoplose equal to 2-3% of capital account

continue sideways, BTC accumulates below 88K💎 BTC PLAN UPDATE (April 18)
The recovery of the D frame shows the optimistic sentiment of the market, believing that in the second quarter of 2025 the market will heat up again. The FED lowers interest rates, the group raises tariffs.
NOTABLE NEWS ABOUT BTC:
Recent trends suggest that Bitcoin ETF sell-offs during price surges often foreshadow significant market pullbacks. Notably, substantial outflows were recorded from BlackRock’s IBIT and Ark Invest’s ARKB ETFs, each losing over $113 million in assets.
Should the sell-off by seasoned U.S. institutional investors persist into Thursday, cautious sentiment may spread to strategic retail and mid-tier traders, deterring them from initiating large bullish positions. This risk-averse stance could help explain Bitcoin’s current stagnation near $84,600, even as top-performing altcoins like Solana outpace it with stronger gains over the past 24 hours.
TECHNICAL VIEW
BTC price needs to surpass 92-93K to enter the next big growth period. However, political instability and tariffs are holding back BTC's breakout. Price will continue to sideway and accumulate around 82-86K
Short time frame, sideway around 84k, slow liquidity.
==> Comments are for reference only. Wish investors successful trading

SOL throwback short setup formingShort Entry : 133
TP : 122
SL : 136.5
My trading is based on momentum, and the chart said that SOL is going to retest the previous 4H breakout resistance.

Bulls recover, gold prices grow OLD ATH ⭐️GOLDEN INFORMATION:
Gold price (XAU/USD) climbs modestly toward the $3,080 mark during early Asian trading on Wednesday, buoyed by renewed safe-haven demand as trade tensions between the United States and China intensify.
In a fresh move, US President Donald Trump announced a 90-day delay on new tariffs—set at 10%—for most US trading partners to allow space for negotiations. However, he simultaneously escalated trade friction with Beijing, raising tariffs on Chinese imports to a staggering 125% “effective immediately,” citing China's "lack of respect for global markets."
⭐️Personal comments NOVA:
The rapid recovery and large fluctuations of gold prices show that the impact of Trump's 90-day tariff postponement news is very strong. The price zone of 3135 and 3167 will be under great selling pressure. There is not much momentum for gold prices to create new ATHs.
⭐️SET UP GOLD PRICE:
🔥SELL GOLD zone : 3164- 3167 SL 3171
TP1: $3150
TP2: $3140
TP3: $3130
🔥BUY GOLD zone: $3074 - $3076 SL $3069
TP1: $3090
TP2: $3105
TP3: $3123
⭐️Technical analysis:
Based on technical indicators EMA 34, EMA89 and support resistance areas to set up a reasonable SELL order.
⭐️NOTE:
Note: Nova wishes traders to manage their capital well
- take the number of lots that match your capital
- Takeprofit equal to 4-6% of capital account
- Stoplose equal to 2-3% of capital account

Gold begins to stabilize, trading around 2990⭐️GOLDEN INFORMATION:
Gold price (XAU/USD) finds renewed upward momentum during Tuesday’s Asian session, appearing to end a three-day losing streak after dipping to a nearly four-week low around the $2,957–2,956 region on Monday. Investor sentiment remains fragile amid lingering concerns over a potential global trade war, triggered by US President Donald Trump’s sweeping reciprocal tariffs announced last week. Fears of a recession and heightened uncertainty continue to fuel safe-haven demand, helping bullion stabilize after its sharp pullback from last Thursday’s all-time high.
⭐️Personal comments NOVA:
Gold price is in a correction downtrend, will continue sideways around 2950 - 3040
⭐️SET UP GOLD PRICE:
🔥SELL GOLD zone : 3036 - 3038 SL 3043
TP1: $3020
TP2: $3005
TP3: $2990
🔥BUY GOLD zone: $2962 - $2964 SL $2957
TP1: $2975
TP2: $2990
TP3: $3010
⭐️Technical analysis:
Based on technical indicators EMA 34, EMA89 and support resistance areas to set up a reasonable SELL order.
⭐️NOTE:
Note: Nova wishes traders to manage their capital well
- take the number of lots that match your capital
- Takeprofit equal to 4-6% of capital account
- Stoplose equal to 2-3% of capital account

what's next after historic plunged? what's next after historic plunged?
HSI needs to claw its way back - resistance now takes the spotlight!
🚨🚨🚨
🔎🎯 Always ask before you open a position, what's your time frame!?
Follow this principle for your trade for entry and exit so you will not lost on that particular trade. Happy trading everyone! 💰
From previous posts:-
MACD - Deadcross formed 20/3/2025 on D Chart.
4H chart:
at point of writing ✍️: the Index uptrend mode is broken where we have been reviewing the movement of the Index.
For this week trade plan: Most likely short the index for days to few weeks until get confirmation of reversal back to uptrend.
For swing trade: Buy into support Sell at resistance.
Set your TP/SL & protect your capital.
PEPPERSTONE:HK50
On 7Apr25 - special Monday, HSI dropped 13.22% ; 3021.51pts to close at 19828.30. The Index below its 20MA@22814 (currently); 50MA@22509 (currently)
This is the historic largest single day plunge since 1997 Asian Financial Crisis.
Historically, the HSI has experienced significant single-day drops during major financial crises. For instance, that was on October 28, 2008, amid the global financial crisis, the HSI fell by 12.7%, marking its biggest single-day percentage drop since 1997.
Well, human beings shape history. While it may not repeat the same way, but often returns in similar forms and familiar contexts. We are the innovative and creativity creatures on this earth, hence we are free to craft the stories eventually become history.
PEPPERSTONE:HK50
currently the 20MA:22581; 50MA:22423
🚨 as of ✍️ :
🗝️ Resistance : 20632
Resistance Level : 20143 20266
Support Level : 18830 19450
🗝️ Support : 18751
W Chart:- HSI continues its Bullish mode with strong pullback! Recovery could expected to see in end Jun - early Jul'25.
17Mar2025 -
24Mar2025 -
7Apr2025 -
For current markets condition, the CHN & HKG can be volatile with the continuing noise from tariff.
🎯 Reminder: For long term (6-18 months) continue to accumulate China & HKG for the potential upside for the year! All retracement is a good entry point.
🔎 DYODD and don't listen to anyone. Invest in yourself, do some study and learn along the way while you trying to verify or finding the answer if to start invest in CHN/HKG markets. If you don't know how or where, you may ask Deepseek/Chatgpt for most reputable Trading courses nearest to you.
Let's follow our own zentradingstrategy , continue to trade and zen with 📙 and 🍵 for profits.
** Please Boost 🚀/LIKE 👍, FOLLOW ✅, SHARE 🙌 and COMMENT ✍ if you enjoy this idea! Share your trading journey to encourage trading and investment buddies.

Bitcoin Signal for Short Lets Make Some Real GameThis is an educational trading setup for Bitcoin (BTC/USD), focusing on a short position opportunity between the $82,000 and $80,000 price levels. The analysis is based on technical indicators, price action strategies, and current market sentiment. Please note: this is not financial advice, strictly for learning purposes!
📉 Trade Concept:
Entry Zone: $82,000
Target Zone: $80,000
Setup Type: Short / Sell
Timeframe: Short-term / Intraday
Market Context: After an extended bullish rally, BTC/USD is showing signs of exhaustion near key resistance. High probability retracement expected towards the $80,000 support area.
🔍 Educational Insights:
Technical Indicators: Overbought RSI levels, bearish divergence, and candlestick reversal patterns around $82,000 zone.
Psychological Levels: $80,000 is a major psychological number where buyers may step in.
Risk Management: Always use stop-losses and proper risk-reward ratios in live trades.
💡 Purpose of Sharing:
This setup is shared purely for educational purposes to help traders understand how to spot potential short opportunities in volatile markets like Bitcoin. Learn how to analyze resistance zones, manage risk, and read price action effectively.
📢 Disclaimer:
This is not financial advice. For educational purposes only. Always do your own research and consult with a professional before making financial decisions.
#Bitcoin #BTCUSD #CryptoAnalysis #ShortTrade #BitcoinSignal #PriceAction #Educational #TradingStrategy #TechnicalAnalysis #CryptoEducation #LearnTrading #RiskManagement

Selling pressure remains, gold price adjusts down⭐️GOLDEN INFORMATION:
Suki Cooper, an analyst at Standard Chartered, noted, “Gold is often seen as a liquid asset that investors turn to when they need to meet margin calls in other areas, so it's not uncommon for gold to decline following a risk event, considering its function within a diversified portfolio.”
On the data front, the US economic calendar showed a solid employment report, with private sector employers adding more than 200,000 jobs in March. Although the Unemployment Rate ticked up slightly, Bloomberg suggested this was “largely due to rounding.”
According to figures from Prime Market Terminal, money market participants have already priced in more than 1% worth of rate cuts from the Federal Reserve by 2025.
⭐️Personal comments NOVA:
Short-term downtrend, disputed price zone 3054 - 2975. Gold price continues to adjust down at the beginning of the week.
⭐️SET UP GOLD PRICE:
🔥SELL GOLD zone : 3084 - 3086 SL 3091
TP1: $3070
TP2: $3055
TP3: $3040
🔥BUY GOLD zone: $2973 - $2971 SL $2966
TP1: $2980
TP2: $2990
TP3: $3000
⭐️Technical analysis:
Based on technical indicators EMA 34, EMA89 and support resistance areas to set up a reasonable SELL order.
⭐️NOTE:
Note: Nova wishes traders to manage their capital well
- take the number of lots that match your capital
- Takeprofit equal to 4-6% of capital account
- Stoplose equal to 2-3% of capital account
