GBPJPY SHORT IDEASo this would be my next setup for this pair,going short if it breaks the low,chasing 650 pips profit,but take your own decision how long do u want to keep trade going because on daily we can spot a big rejection half move down,where price could possibly reverse,take partials or keep your sl above last hi.Happy trading everyone,september was extremly choppy,lets see how will october be.
Shorttrade

Bearish set-up on STORJUSDTReasons for short:
- Head and Shoulders formation
- Bearish Divergence on RSI
- Bearish reversal signal on FRSI
- Price crossed below the whipsaw-resistant trend cloud signalling the beginning of a potential downtrend
Levels:
Entry - $0.4687
Take Profit - $0.3267
Stop Loss - $0.4999

Jasmy short period analysis ⏰🆓🚦📌 #dyor
💰 Position size :: 1%
💱 Leverage :: cross ➖ 2-5x
🪙 $JASMY-USDT 📌 🔰
#futuretrade :: 2-6X ↗️ ......🌴
#BUY :: $0.003435 - $0.003632
🎯
:: $0.003969
:: $0.004131
:: $0.004200
Stop 🛑 lose #SL :: $0.003379 🚏
📌 always move stop lose #sl
when target get reached 📌
#risk :: too high 🔥#scalping
#explanation
👉 Provided based on support and resistance / supply and demand zone

Ok now $LINKUSDT is topping with a 9! I just opened a short in $OKX:LINKUSDT.Pwith a tight Stop Loss. Let's see if it has some money to gave me the next days.

vedanta looking weekvedanta ready for touch 208 lavel
on daily-timeframe
You can set the stop-loss as your risk-reward!

BTCUSD converging triangle of the 4th Elliott correction waveWe observe the possibility of converging triangle of the 4th Elliott correction wave appeared on BTCUSDT chart. We may enter short NOW with the target ~23000.
If the price will break the rules and knock out the stops from above in the area of 27000-28000, it may be good idea to reenter with SL around 29000 and target price 23000.

Parabolic Short JST USDTOKX:JSTUSDT.P Parabolic Short. I'm expecting this price not beign sustained for the next days. I'm shorting it and giving a Stop Loss at 10 % the current price because most probably will pump a bit more.

EURGBP - Long/Short Scenario (ICT)Long and short scenario for EURGBP.
Scenario (A) is relying on a reversal from a Bullish 4h Breaker Block before moving higher.
Scenario (B) is relying on a retracement from a Bullish 4h Breaker Block up into a Bearish 4h Breaker Block before moving lower.

Swing trading.Since yesterday GBP/JPY was not showing any clear direction. Made couple of losses and one tiny win.
I thought since for some time GBP/JPY on D TF going towards FVG and OB I'll try swing trading for the first time.
Initial TP was set at 2% but now is 17%.
It might take days or even weeks or not even at all to reach my target. ;)

Daily Wave Rider - EURUSD - SELLEURUSD
Channel: RED
WK Pivot: RED
AOB: WS1
CON: SBB
SELL Stop: 1.05612
Stop Loss: 1.06120
TP01: 1.05104
DWR present as a sell setup on 27SEP, with Channel and Pivot are red bouncing of weekly support line
However, trade is not taken/considered as price is extremely close to our weekly key level
SPX500: BUY
DXY: SELL
OIL: SELL
GOLD: SELL

WTI - 4HI mostly try to trade with the trend line, which has clearly broken a trend line in this 4-hour chart, and the divergence in the MACD indicator is considered a failure confirmation for me.

The market is bearish and looks good to analysteruusd looks very bearish and looks good to take a good position follow for more

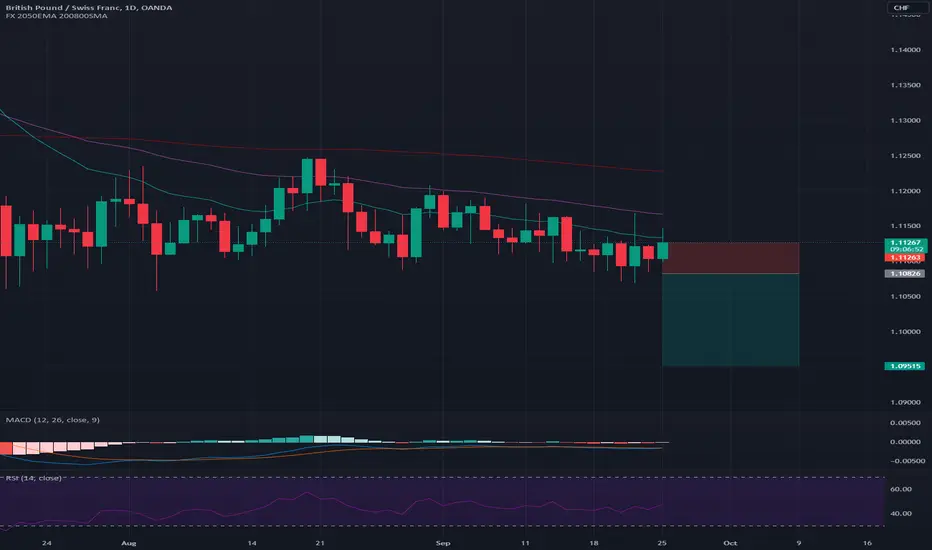
Daily Wave Rider - GBPCHF - SELLGBPCHF
Channel: RED
WK Pivot: RED
AOB: EMA10
CON: IB
SELL Stop: 1.10826
Stop Loss: 1.11263
TP01: 1.10389
TP02: 1.09515
DWR present as a sell setup on 25SEP, with Channel and Pivot are red bouncing of EMA10
However, trade is not taken/considered as it is Monday which is normally correction day and market is unpredictable
SPX500: BUY
DXY: SELL
OIL: SELL
GOLD: SELL
SP500 Futures new Supply Zone (?)Hello trading community!
The ES Futures seems to be Bearish, and we can watch in this chart 3 Higher Lows created. A strong support that was tested three times has already been crossed and tested to create a new possible resistance.
The Dollar continue to show strength, the DXY is again testing the resistance, and we believe this time will be a strong long signal.
Also, after analyzing the SPX timeframe 4Hours, is possible to observe the Supply area that has already been tested and originated the three HL.
SPX is entering in an area that was resistance some months ago.
To conclude, we believe ES Futures contracts will test again the area of the new resistance 4401.25, and will change the direction to a short position

WLD/USDT on Binance Futures🚀 *Bitxer Signal Alert ID# 284-4
WLD/USDT on Binance Futures (10x to 20x Cross)
📈 Trade Direction: Short ⬇️
📈 *Entry Point:* 1.574 as want before
🎯 *Targets:*
🎯 Target 1: 1.550 🚀
🎯 Target 2: 1.540 🚀
🎯 Target 3: 1.533 🚀
🎯 Target 4: 1.499 🚀
🚀🚀🚀🚀🚀
🛡️ *Stop Loss:* 1.660
💰 *Risk Management:* Wallet Size - 3-4% (Protect those funds!)
🚀🚀 Ready to blast off with Bitxer signals! We've got our sights on those targets! 🌠🛸

TSLA Short OpportunityTSLA has a perfect short swing trade since 18/09. This is confirmed today as the stock droped below $260 key level - pre market.
Another confirmation that a key ascending trendline on the 4hrs chart has been broken pre market. it marked as white line.
My trading plan for the day is to see how it will react to this level - i need to see it retest and then enter my short position. this is perfect Risk Reward percentage and can played as day trade or swing trade.
Entry : 260
Stop Loss : 262
Take Profit: 242

Moderna Break of Major Support, Short PotentialThis is a Technical Analysis on Moderna (MRNA) on the 1 Week Timeframe.
Current price action shows that we are currently in the process of breaking a MAJOR SUPPORT Zone.
We held critical SUPPORT multiple times ABOVE the $115.00 level, for a span of about 26 months. Expressed by the GREEN circles. But notice we havent been able to successfully rally and stay above the "MAJOR RESISTANCE" line.
Though the CURRENT candle has not yet closed, which it will end of trading session Monday, the 7th of August.
This in my opinion is a critical development. If we CONFIRM below this $115 ish area, the lower range of about $82.00 of the ORANGE zone becomes more likely.
The ORANGE zone, or price range between $115 and $82 has barely any market structure or in other words barely any candles. It would be easy for price to fall stright down, in my opinion.
This can be an area to take a SHORT position.
Another thing to notice since the BLOW of top, we have been forming a DESCENDING TRIANGLE. Its been forming since August 2021, this is NO JOKE. Measuring the target of the end point of descending triangle we get about a 75% drop target. Just remember it doesnt have to play out exactly but its something to consider and keep in the back of the mind.
So just to mention:
1st Target = $82 ish area
2nd Target = $57- $47 range
Last Target = Descending triangle measured target of $29 ( *Less likely for the time being)
RSI has been:
1. printing Lower Highs
2. is currently below the Black Moving average, which i use as an indication of price moving down
3.Is currently in process of ALL TIME RSI LOW, provided we close this weeks candle at current RSI lvl.
STOCH RSI -> Setting up for a BEARish cross. This if it occurs and we are below the MAJOR SUPPORT, bearish momentum can push price down.
Lastly ADX & DI -> We have RED line cross above Green and pointing up. We need to observe this, this indicates also the BEARISH momentum is coming in. If the BLACK moving average curves up and starts moving towards the RED/GREEN line with RED being on top, this will indicate bearish momentum.
CONCLUSION:
We are at major cross roads for MRNA. If we don't have any buying occur during Mondays trading session, and we close below MAJOR SUPPORT, it may be time to SHORT MRNA. We have not had any luck trying to break and stay above the "MAJOR RESISTANCE" line. This, along with multiple touches on MAJOR SUPPORT, has made this WEAK (in my opinion). Short targets include the primary, secondary and descending triangle target levels. Indicators are also shaping up to support the current price action. At times like this, it is important to observe further clues of bearish activity, to be patient and take it one step at a time.
Thank you for taking the time to read my analysis. Hope it helped keep you informed. Please do support my ideas by boosting, following me and commenting. Thanks again.
If you have any questions, do reach out. Thank you again.
DISCLAIMER: This is not financial advice, i am not a financial advisor. The thoughts expressed in the posts are my opinion and for educational purposes. When trading always spend majority of your time on risk management strategy.

Short With PMIThe price started to rise from the beginning of the day and broke yesterday's ceilings and completed its pullbacks
My main area will be 1930
After the price reaches this area and collect liquidity, I will enter a sell position and my target will be today's opening price.
Price recovery requires high liquidity and I will wait for the New York session
Don't forget today we have PMI news on the dollar and it will provide the necessary liquidity

Daily Wave Rider - NZDCAD - SELLNZDCAD
Channel: RED
WK Pivot: RED
AOB: WP
CON: SBB
SELL Stop: 0.79539
Stop Loss: 0.80158
TP01: 0.78920
TP02: 0.77682
DWR present as a sell setup on 22SEP, with Channel and Pivot are red bouncing of weekly pivot
However, trade is not taken/considered as it differs from our Market Analysis Bias.
SPX500: BUY
DXY: SELL
OIL: SELL
GOLD: BUY
Reference to our WK38 analysis, we are anticipating a "Risk-On" sentiments thus will BUY AUD/NZD.

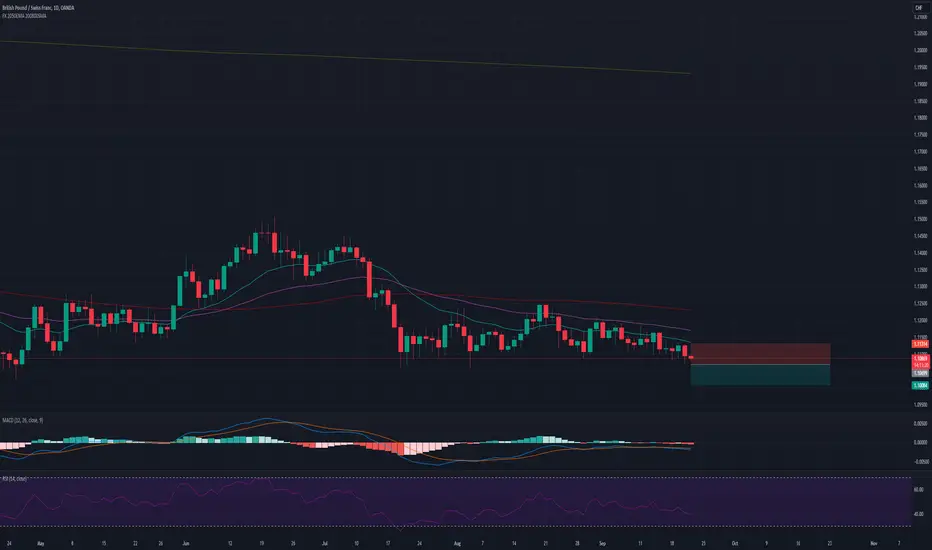
Daily Wave Rider - GPBCHF - SELLGPBCHF
Channel: RED
WK Pivot: RED
AOB: WP
CON: SBB
SELL Stop: 1.10668
Stop Loss: 1.11707
TP01: 1.09629
TP02: 1.07551
DWR present as a sell setup on 22SEP, with Channel and Pivot are red bouncing of weekly pivot
However, trade is not taken/considered as it differs from our Market Analysis Bias.
SPX500: BUY
DXY: SELL
OIL: SELL
GOLD: BUY

Daily Wave Rider - GBPCHF - SELLGBPCHF
Channel: RED
WK Pivot: RED
AOB: EMA10
CON: SBB
SELL Stop: 1.10699
Stop Loss: 1.11314
TP01: 1.10084
DWR present as a sell setup on 18SEP, with Channel and Pivot are red bouncing of weekly pivot
However, trade is not taken/considered as it is not within our trading rules.
SPX500: BUY
DXY: SELL
OIL: SELL
GOLD: BUY
Daily Wave Rider - NZDCAD - SELLNZDCAD
Channel: RED
WK Pivot: RED
AOB: EMA10
CON: SBB
SELL Stop: 0.79628
Stop Loss: 0.80268
TP01: 0.78988
DWR present as a sell setup on 18SEP, with Channel and Pivot are red bouncing of weekly pivot
However, trade is not taken/considered as it is not within our trading rules.
SPX500: BUY
DXY: SELL
OIL: SELL
GOLD: BUY
Reference to our WK38 analysis, we are anticipating a "Risk-On" sentiments thus will BUY AUD/NZD.

Daily Wave Rider - AUDCAD - SELLAUDCAD
Channel: RED
WK Pivot: RED
AOB: WP
CON: SBB
SELL Stop: 0.86702
Stop Loss: 0.87310
TP01: 0.86094
DWR present as a sell setup on 18SEP, with Channel and Pivot are red bouncing of weekly pivot
However, trade is not taken/considered as it is not within our trading rules.
SPX500: BUY
DXY: SELL
OIL: SELL
GOLD: BUY
Reference to our WK38 analysis, we are anticipating a "Risk-On" sentiments thus will BUY AUD/NZD.
