hypothetical extended invertedhead & shoulder neckline breached?The Bull run continues. was happy to see the momentum happening today. I added to my position at the near-bottom of today's candle's dip (10300). It surpassed the red fibline and may be keeping it as a line of support depending on how today closes out. Today's best trading probability opportunities would be small laddering in at 10300 and profit taking just below the top of the tan trendline. We seem still well on our way to reach the initial inverted head and shoulder trajectory target at 11900...but I might have spotted the potential for the real shoulders of the inverted head and shoulders to be much more massive tahn originally thought...and if we close today's candle where we are in price now or above that, that would signify that the larger hypothetical neckline(the tan horizontal dashed line) had been breached which would equal a far higher climb(vertical tan dashed line) I don't know if Head and shoulders patterns can operate like that or if its possible for a chart pattern to trigger twice though and would love to hear input from anyone who knows the history of the head and shoulder pattern better than I to know whether or not my hypothetical is even possible. Even if not I still suspect we will flirt with the top green channel line....and if it is correct I think we will blow the lid off the channel and sky's the limit. Thanks to all who have folloed or agreed with my ideas, I have finally hit 100 rep points so for that I am grateful. As always these are my methods not suggesting anyone use them as this is not financial advise. You do you.
Shoulders

BTC Blows up outta the inverted h&s pttern brking the neckline! The neckline has been breached in big fashion! However not as much volume as you would anticipate to go with it....that may very well come today. it has blasted past all recent lines of resistance and now seems to be forming it's new resistance line with the green fibonacci retracement line. We may most likely see it bounce back down and see the inverted head and shoulder neck line as the current support at which point I say is the best opportunity to buy in and enjoy being back on the impending bull trend to come. I'd do any selling just below the green fib line and any buying near the thin grey head and shoulder neck line! Bring on Pamplona!!!

Inverse Head and shoulder pattern has formed! Watch 4 the break.On the 4 hour chart we can see a clear inverted head and shoulders pattern has formed...it needs to go above the thinner grey line to break the neck line in order to be valid, but even then, we need bullish confluence in every key indicator (rsi, stoch, mac d and especially Volume) to validate the pattern. To break the grey neckline we will need to get above 9,000 and close the 4hour candle there. Currently the depth chart on gdax suggests that the sell wall will engulf the buy wall just before it hits 9,000 and send it back down as far as 7900-8100, however it may be able to still shoot back up again before the 4 hour candle closes to over 9,000 breaking the trendline and validating the pattern...even if it doesn't break the trendline on this candle, keep in mind that sometimes head and shoulder patterns will retest the trendline, so I think it's very possible we will see it break the nackline within the next 3 days. I plan on waiting until the depth chart dumps and getting some more bitcoin then to take full advantage once it breaks the trendline. If I don't see the volume to go with the pattern once it does break then I will amke sure to safeguard myself with appropriate stop losses. A special thank you to all those so far who have read, and liked my ideas. Thanks to you, I have finally reached the coveted 50 reputation points needed to be able to communicate on other traders idea pages haha. I'm still fairly new here to this space so thanks again for your time...and always this is only what I plan to do and not financial advice....you do you.


Bitcoin time machine. Two scenarios If H&S that forming will fail, we have a "plan B". It's too similar to ignore it. Look at 4H Ichi for the short signal

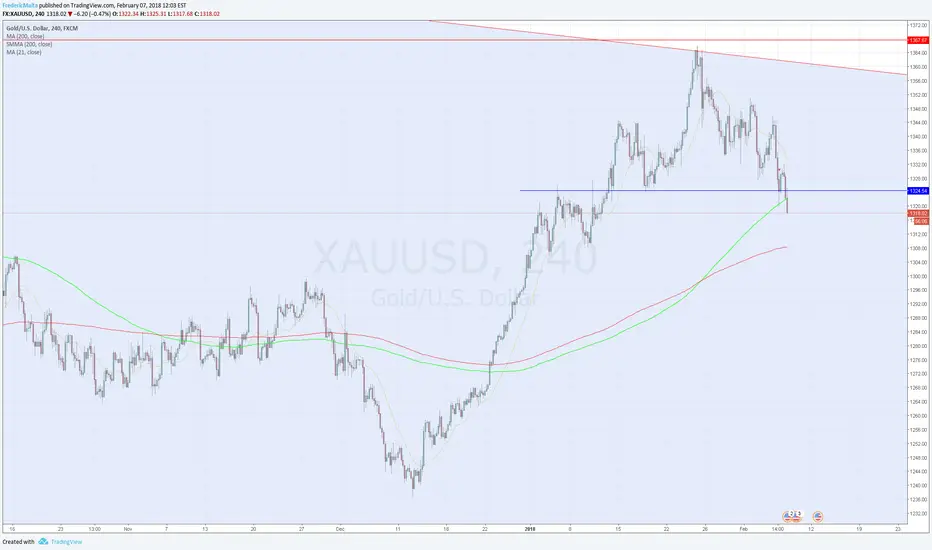
Shoulder head shoulder breaks on XAU/USDAs predicted: in a bullish environment for USD, with XAU/USD under big resistance, the SHS pattern breaks and gives a downward signal

BTCUSD BULLISH Head Shoulders Knees and Toes patternSo for the traders among us that were children in the past, there is this song which goes:
Head, shoulders, knees and toes, knees and toes <---
Head, shoulders, knees and toes, knees and toes
And eyes and ears and mouth and nose
Head, shoulders, knees and toes, knees and toes
So naturally, we should see a head shoulders pattern again

NTLA - Inverse head & shouldersAn inverse head & shoulders pattern formed in the charts of Intellia, a company developing CRISPR gene-editing therapy. While CRISPR has not been approved to begin human trials in the US, it has already been tested on over 80 patients in China.
Target: $31 (previous closing high), or long term hold
Stop: $18 - $20


Why 14000 could be bearish for BTCHead and shoulders, but on a sloping line.
If BTC reaches 14000 and fails to push through then it could be abiding by the down trending channel and not the Schiff Pitchfork
You can see this pitchfork on some of my posts from several days ago. It continues to be very accurate. a breach of this will be very significant.
Each bounce within this fork is smaller and smaller.
A short opportunity may present at 14000.
I will update later

Ripple (XRP): Head and shoulders pattern formationAfter support failed between 17k - 18k satoshis I think we are heading back down to the neckline to finish off classic head and shoulders pattern.
I will keep this updated.


Bitcoinausaurus about to wake up!A little messy but definitely starting to look like an inverse head and shoulders getting ready for it's reverval....
Booom! hehe... take your time Bitcoin!

Short Term Bullish UpturnWait until we reach the support line of the right shoulder at 1300.
Possible buy opportunity with low RSI for short term long position.
Hold for approximately 25-30 Hours depending on the moment of the bullish upturn.
Take Profits at 15800

BTC make it or break it - possible head & shouldersWe have a possible Head & shoulders pattern forming on the 4h chart. We know BTC doesn't follow usual patterns, but we also know we're in a descending trend, so this time, it may surprise us.
We're currently at the 200 MA, if it breaks support and goes to 13k, prepare your wallets for a buying point.
What do you guys think?

ETH SHORT - Gann Fann analysis (Head/Shoulders)Pretty simple and straightforward Gann Fan analysis.
There is very visible resistance in the market. Wait until signs of trend reversal from the right shoulder, then short.


USDJPY H&S ReverseAlong with upcoming events the head and shoulders shows a high potential for a secure long sell position against the Yen.
I would sell upon the confirmation of the right shoulder. I will post a clear signal once the shoulder fully forms and continue on the reverse of the trend.

BTC 1 month trendlineAnalysis with dozens of possible influences taken into count.
Lot's of variables are used to predict this.

USDDKK Head and ShouldersThere is a Reverse Head and Shoulders pattern in the USDDKK. This could be confirmed by breaking through the neckline

Bitcoin BTCUSD Watch out for potential Head and Shoulders hereBitcoin BTCUSD Update
If you got long again at the ridiculous hour of 11.30 pm est you're hard working and deserve your 400 points reward.
Weirdly the crypto chat room was quite quiet with a guy from
London waiting for the BCH burst to top out so he could bail out and fade the consolidation. London's finally catching on.
2018 will be so fascinating and fast moving. It's good for competition, good for spreads and good for us therefore, in
time. Now, finally people are taking BTC very seriously. So many Bitcoin jobs to be created now. How long for though? No
one can answer that one for us but if anyone will know in advance it will be GS. And the chart. Until that day comes we
ride this like nothing has ever been ridden before...in the entire history of speculation. Ever. We are alive for it. Wow
Right now Bitcoin is trying to track huigher but is, weirdly, being contrained on the upside by an old parallel from way
back in the mists of time (hell, it's 14 days old - that's 2 years in FB time!) - and yet it's clearly back in play once more,
stopping the rallies. Another nice day in prospect for day traders but not much for others right now. It's trying to hold a
newly forming little parallel off yesterday's lows and needs to keep holding up there or we have a danger of a head and
shoulders forming here off the top, with a neckline at 15809 and a minimum downside target at 14210 if it gets broken.
Time will tell but right now this is not a very strong pattern, except for day traders. Unless you look to short if head and
shoulders gets completed later on, as above.

