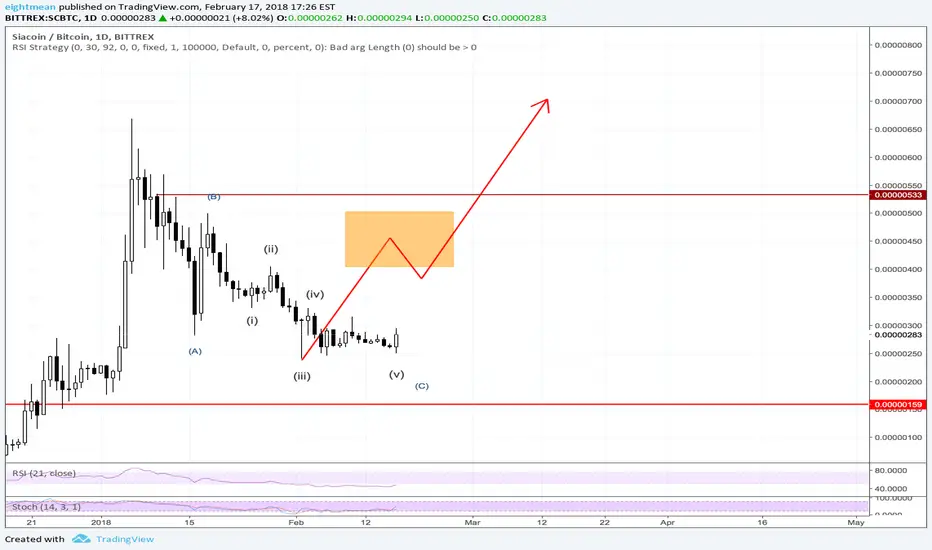
SC - Sia coin - Time to SOAR!!!SC coin, like many others, has suffered and spiraled down for days now.
Oversold for a month now and seems to have hit the bottom
Since hitting the bottom, SC has had 3 daily green candles, first time in weeks!
MACD steady rising and about to finally come back up.
I see a nice rally coming soon here.
Target 1: 215
Target 2: 245
Target 3: 290
SIA

Siacoin (SC) Can We Get 10x Again? (Over 340 Profits Potential)Siacoin (SC) is one of the most famous altcoins of all with low market cap., and has really good fundamentals. The development team is active and on top of the market starting to reverse now, there's news on the pipeline and a TSO launch for this project on the 16th April.
Now, can we get 10x out of this coin? Here is the chart for 2017 after May:
- The magenta line represents the two tops reached in 2017. We had two strong bull run for this coin last year. If we want to get 10x or more, Siacoin needs to break its all time high... This can take some time... In the meantime, let's focus on the profits.
Let's look at the details for this trade.
CHARTS, SIGNALS & INDICATORS
Siacoin (SC) daily chart:
- First notice how support is almost always found at the same breakout point that started the last bull run. Note this as this can be useful in the future for trading. When a top is reached and the big retrace starts, you can check for the last big breakout to buy in again into any coin and enjoy profits on the way up. The bottom reached this time was 121 satoshis, marked with a black dotted line. For the first bull run of 2017, the bottom was set at 48 satoshis.
- Here you can see that the SMA20 (green line) is curving and soon crossing up the SMA50 (blue line) and SMA200 (brown) lines. This is a very bullish signal. On the 6 hours chart this signal has already been confirmed.
- We can see the accumulation period marked by the positive divergence on the MACD and all the usual suspects.
- Doji, reversal candle on the daily chart (yesterday).
- Weekly chart looks very positive.
- Siacoin (SC) looks good for a long term trade.
- So what are you waiting? Let's trade!
TRADE INSTRUCTIONS
Buy-in: 0.00000160 - 0.00000220
Siacoin (SC) Targets:
(1) 0.00000250
(2) 0.00000330
(3) 0.00000459
(4) 0.00000551
(5) 0.00000668
(6) 0.00000850 (2017 All time high)
(7) 0.00001006
Stop loss: 0.00000084
Message: Look At The Sky
I am looking up to go up.
I am going up while looking up.
Light blue, shades of gray.
Vibrant yellow, orange and red.
Look at the sky!
It is beautiful... take your time...
Please... look again!
Namaste.


Just a small profit from our chandelier Siacoin confirmed the second bottom which was higher than the first, let's have a nice ride up ;)
Let's try to have 20% profit on our chandelier


SIACOIN about to explode?... learning.Siacoin has touched their lowest level where it form a new support.
This will be confirmed by the break of the black line, corresponding to the Top of this ware trend that I have find.
Targets are on Red circles.
This are just crazy ideas based on math patterns.
This is not a trading advice.
Regards.
-SG-

-80% ruleAs we can see pump was blown in POLONIEX:SCBTC but the level is not strong enough... I would buy with wariness

SiACoin (SC) : Day Chart : Substantial Potential profitI'm pretty confident we've seen the last of the bearish BTC trend.. Maybe a few rough retracements, but as far as negatively influencing the Alts go, I think that's done..
This is a very good opportunity on a slow and steady coin, that should race up from today..
Take a close look at the fan and the slices on its inside.. They correspond perfectly as resistance and support levels and touch on many of the peaks and dips, all the way from December..
This is a strong buy..

Siacoin fractalSiacoin is in a correction. Looks pretty the same as the last cycle. Investor EMA are expanding toward a bearish bias. Based on fractal, we are entering the last cycle of the correction. I will build a long position around 0.00000060-0.00000050, where the volume profile is showing a strong buy zone.

Siacoin: having a hard timeShort way to describe Sia is 'dropbox on the blockchain'. Sia has been around since 2015 and allthough the idea sounds pretty cool and the solution is live for quite some time now, getting it adopted is still a huge challenge. User statistics are pretty poor and there are many complaints on various discussion boards about setup troubles.
From a technical view I have really zoomed out here to the weekly chart. It doesn't look too nice. Allthough we have some sort of uptrend supportline, it is still well below current price. Price painted a lower high early january. On the way down it broke horizontal support and is currently at 78,6 Fibonacci supportlevel, which isn't the strongest fib level. Unless another altseason starts on short notice and traders go nuts for low priced alts again, Sia will most likely fall below 100 sats once more and could even go towards 50/60 sats.


siacoin within next 3 monthsiacoin short next 3 month
after MAY 2018 i think will see strong bullish trend


One Last Chance to Short SiaShort or Long... you decide, but it doesn't look good for SC right now. The red diagonal resistance lines are pushing it into a long term consolidation. I would guess we test that blue diagonal resistance line once more before dropping to level off for a bit prior to a slow bleed back to the mid 50 satoshi mark. This will be the third time something like this plays out if it does. Short now, check back mid summer. Keep in mind that technical analysis aside, a new batch of Bitmain A3's is hitting the market this week and people will want to pay them off asap (i.e. dump everything they mine).
Not investment advice, good luck if you trade this idea.


TA on SIAcoinDid a TA on SIAcoin against BTC. Looks like its pretty bearish from the TA side of things. It broke support at 246 sats and might be heading towards next level support at 185 sats. Its moving below EMA and thats usually a bearish sign. However, one main reason is also because BTC is moving up fast so most alts are going down. But my best bet is to exit of SIAcoin and enter back to BTC just from TA perspective.

SC looking for a bottomSia has a great potential in Q1 2018 by releasing:
- File Contract Upgrade
- File Recovery System
- Simple File Sharing
It is still in downtrend, looking for a bottom at (blue lines)
Support 1: 200 sats
Support 2: 130 sats
Forming a falling wedge, which will confirm a reversal after bouncing from one of the support lines and breaking resistance (red).
+
- RSI going to oversold territory.
-
- MACD and RSI confirming downtrend
Green lines are targets
Target 0: 200 sats
Target 1: 260 sats
Target 2: 335 sats
Target 3: 400 sats
Target 4: 460 sats
Target 5: 550 sats
Target 6: 650 sats
Target 7: 1000 sats