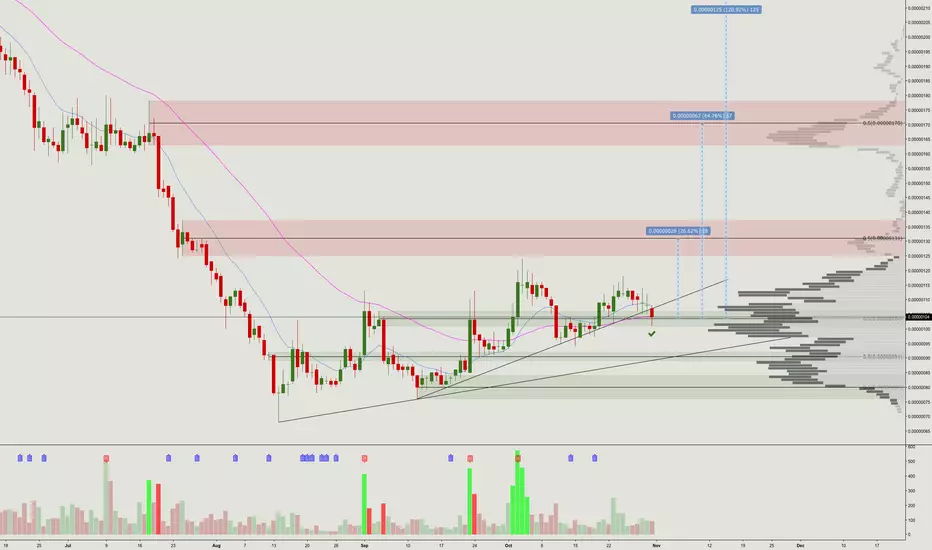
SC/BTC long 26%Buy Price: 0.00000096 - 91
Profit: 0.00000118 -121
SL: 0.00000088
Profit Expectations: 24-26 Percent
Sell when you got some profit according to your way of trade.
I am sure, you will be get nice profit. Good Luck!
Looks Good? Leave a like, share and leave a comment.
Thanks for visiting.
Siacoin

SIACOIN Roadmap && How To Make A Roadmap For Anything! :)The following analysis attempts to illustrate a reliable road map for Siacoin. I anticipate that this road map will hold true for months and perhaps years to come. Let's dig in.
There is a lot of information on the chart to parse for people not familiar with Fibonacci Retracements and Pitchforks. Believe it or not, this chart was created with only the following:
- 1D candlestick chart
- 2 Schiff Pitchforks
- 2 Fibonacci Retracements
(There's a link at the bottom that will get you high quality images of me building all of this. Download them so you don't have to squint your eyes and scroll for a million years.)
Let me walk you through this. Use your imagination with me and let's peel back all of the layers until we're left with the grey background.
We start with a grey background, we want to clear our minds. No horizontal and vertical helpers to distract us.
Let's add the candlesticks to the chart. We use candlesticks because they show the market's psychology towards Siacoin and Bitcoin, every single day. We use a 1D chart because we don't want to pick everyone's noses and see what they think from minute to hour. A 1D chart gathers everyone's feelings - hopes, greed, and fear - and represents the collective psychology of all players into one singular candle stick. A new day starts and the 1D candle opens at the previous day's close. We observe the highs and lows, and finally see what everyone's collective sentiment has settled on at the end of the day. This is represented across the entire history we're looking at. But what do see? Do we zoom in to look at every candlestick pattern? Not right now. This is a Road Map. We're zooming out and looking at everything that was, to find the overarching patterns in what the market thinks about Siacoin. We use this map to anticipate when to sell to the greedy, and when to buy from the fearful. Let's continue.
We have candlesticks, let's find the MAJOR support and resistance areas. These are illustrated as thick horizontal lines. You can bet money on the fact that these levels matter, a lot! These are the levels where people will take profits. The price is at 99, below the bottom Fibonacci resistance at 116. Do not sell here unless you're a pro. If you haven't studied trading for thousands of hours and you want to be smart and sell Siacoin at 116, you're going to become depressed. If you don't know what you're doing, HODL until at least 300-350; yes Siacoin will make it to 300-350 easily. Just wait. Sit on your hands if you have to. Money isn't made by trading, it's made by waiting. Look at how price reacts at these critical levels. There's rapid and short-lived movement here. These are good places to have sell orders. These Fibonacci levels are created taking into account the highest price of Siacoin to date and relating it to the lowest. These are literally the fundamental, psychological levels of support and resistance. Expect that in the coming years, as Sia breaks out from these level and maintains higher prices, these levels will begin acting as support. Expect this. The point: Having sell orders at these Fibonacci levels is a good idea.
A good profit-taking strategy would be as follows:
- 50%
- 30%
- 20%
Let's say your big sell target is 350, a reasonable number. Don't go selling all of your Siacoin here. Why do it? We're not geniuses. Anyways the price will definitely go higher, but how much higher? Why not lock in profits, take a sizable chunk of our profits off the table and into our pockets. We've taken 50% profits and the market moves up higher! Let's say the price gets to 400-450 and we want to sell here. Sell everything? No! Sell 30%, maybe the price goes higher, but you want to lock in profits and sell to the greedy before the price comes tumbling down. You have 20% of your Siacoin left, the price is still climbing. Let's say it gets to 500-550... you see that the market is getting tired. It looks like the bulls are losing their breath. The hopeful, euphoric, high chasing fools will buy here, you will sell your last 20% to them. And you have 0% Siacoin left.
So you sold something, maybe you only got to selling 50% at 350 and the market reversed, what now? Well look at the Fibonacci levels. You see the thinner levels? Those have been created not by using the entire market's history to get the Grand Scheme of Things support & resistance levels, they were made by taking into account the next largest swing levels, to get more surgical, specific support/resistance levels. See for yourself. Look at how price reacts at these Fibonacci levels. They tend to hold as support/resistance for some time before finally moving up/down to another Fibonacci level. You've sold 50% and the price moves down, to another Fibonacci level, and you see that there is a flurry of more buyers eager to get in on that previous high: Do you want to invest all of your 50% profit into backing back? You could do that, or withdraw the profits and buy back what you started with. You're buying on the move towards the next high up... just think about it. 50%, 30%, 20%. And you don't have to sell it all in one Hail Mary. Set sell orders. Say 350 is your target for selling 50% of your Siacoin. Why not set sell orders for 10% at 330-340-350-360-370? It's smart. You give yourself a chance to lock in profits at various levels, maybe you save yourself if the market retraces before your Grand Target, or maybe the fervour of buying exceeds all good reason, you could profit from that too.
Fine, we have an idea about using Fibonacci Retracements as support and resistance levels because we've looked at the chart and it makes sense, right? Good. Those are the horizontal levels... you get the same effect using a Schiff Pitchfork on the entire history, macro view, just like the macro Fib levels give you the ultimate sell targets, this gives you... something amazing. Let's talk about it.
Imagination time again. Remember we stripped everything away - we started with grey and added the horizontal Fibonacci Retracements. So we have grey, candles, horizontal lines. Now we add the right-down sloping Schiff Pitchfork with rainbow colours. Look at it, observe how the market moves here. Doesn't this look like support and resistance? Yes it does, but what's mind-blowing about it is that a break out from one level to the next could provide a good buy opportunity, and if that breakout happens to occur at the intersection with a Fibonacci level, then you have additional confirmation. Anyways, you'll learn more about that by looking at the charts. The colours though... this will blow your mind...
Look at the bottom left colour, the blue zone, think of this blue zone as the ideal magical place to buy, now look up top, to Siacoin's highest prices, you see the blue zone there? Another magical place to sell. Well consider the rainbow from that perspective, the blue zones are the extremes. The magical place to buy is at the bottom blue and the magical place to sell is at the top blue. Then there are gradients in between - lighter blue, turquoise, green, yellow, and red. Look at the red in the center. You see how there's a yellow line there, right in the center cutting the red in half? That's the Pitchfork center line. You have to study Pitchforks. They're amazing. The thing about Pitchforks is this... well first...
You're looking at the Pitchfork, yellow center line. Price will return to this point 80% of the time. Read about it. Download and study this file: the_forktrading-blueprint.pdf . You have to register to the ForkTrading website to get it. Do it. Download it. Study it. Profit. So the center line, look at the chart. When the price gets to the center line one of three things will happen, the price will accelerate through at high volume, it will retrace from there, or it will consolidate there. Look at Siacoin cutting through it time and time and time again, zooming up and down, using it as support and resistance. The more you can buy below in blue or below the center line, the more profitable the trade can be. Do you see how Siacoin broke above the center line, ending the downtrend and starting a long period of accumulation? People accumulate, the price goes up to the center line, it acts as resistance, and retrace. Rinse repeat. Well we're out of there, toward the end of the red, and where are we now? Just below the most significant, thick horizontal Fibonacci level at 116. Here's the thing, Bitcoin is at its bottom. Big money is manipulating the market and shaking the money tree to shake out the last cheap Bitcoin from the frightened and uneducated. This is the bottom. Could we get to 5000? Sure why not, but I don't think so - anyways that's another chart and another explanation. Siacoin keeps steadily climbing towards that Fibonacci level and when it does, what?
Next step: let's add one more layer, ready? So you see how awesome the macro, Big Picture Pitchfork is? You make those by connecting any swings high/low to get a micro view of action, so you can see price channels here and now, in this month, in these days. That yellow line shooting to the upper right is that new Pitchfork center line. It's an Original Pitchfork. I left the center line and removed the other levels. Why? Because after we break 116 Fib and get up to the intersection of 157 Fib and the Pitchfork center line what do you support is going to happen? At that bottom yellow circle? Let me tell you, if price breaks 157 these on volume hold onto your cowboy hate because... you see that yellow circle above? What is it? It's the extremity of the blue Pitchfork area (remember the bottom one?), the magical place to sell, and it's right below what? The 384 major Fibonacci resistance level. Things this might be the ideal place to sell that 50%. Well expletive yeah. Sad us, maybe the price doesn't zoom through the bottom Pitchfork center line, what happens? Retrace. Where to? Probably 116 major Fib. Think that might be a good place to buy? You betcha. Did you sell when the price started to retrace below the Pitchfork center line and 157 Fib? Well why the Hell not what have I been saying! Observe price action where Pitchforks and Fibonacci levels intersect! And while you're at it observe whole numbers like 150 and 200. People find them to be significant and want to either buy or sell at those nice round numbers. Pay attention. Pay. Attention.
What's left to explore on the chart? Let's see... nah that's pretty good. I've just about covered all the basics... aside from the most important, the most fundamental thing: candlesticks! If you don't know candlestick patterns turn off your computer. Go read a book, ride a bike, go away, lol. No seriously candlesticks are the very foundation of trading. Research Steve Nison. He's God. Study Steve Nison. Again: Study. Steve. Nison. He has a magical seminar called Steve Nison - Candle Charting Collection . Get creative. Take the course. Complete volumes 1-4. COMPLETE THEM. COM-PLETE. THEM. You cannot be a master trader without taking that course. Then what? You took it once? Great, you understand candlesticks. Take the course again. Yes, take volumes 1-4 AGAIN. You learned candlesticks before and learned a Hell of a lot about identifying support and resistance levels, the best places to buy and sell, but it was too much information for you to learn everything. The first time you learn how to read candlesticks. The second time around you master candlestick analysis and know when to buy and when to sell. Do you want to know when to buy and when to sell? Do you want to stop buying at the top and selling at the bottom? Then take the damned course, TWICE!
Anything else? Hmm... we unwind the chart layer by layer and we get the grey background and we shut down the tab and the browser and the computer and what do we have? You.
Study trading. Become a better trader. This is not a game. This is a job. Crypto is the magical place where nobodies and become millionaires. If you're in it to get rich, you need to study. I've given you a lot, really. I've studied for thousands and thousands of hours, every single day over the course of a year. Anyways. I hope this helped you out. Oh yeah and one more thing...
You can apply this technique to any single market and create a Road Map for anything. Study Hard and have fun. Take care of the people around you. Remember what and who is really important to you and find balance and inner peace. See ya.
Oh yeah, here's a link to me building this chart over various stages. Download the images and study. Enjoy!
photos.google.com


SC BTC HEAD AND SHOULDERS
SCBTC now formed a head and shoulders pattern which is a sign of bearish ,after a small accumulation and increase based to speculation of hard fork the price went up but coulden t be sustained. Now RSI is below neutral zone(50),MACD sell volume increase and we have a bear cross and stoch is in free falling with bear cross
Target 85-83 (support levels) but last target is 80 sats

Siacoin - Perfect bounce off support block! Siacoin has fallen into the demand OB and bounced perfectly at the bottom before rising back above the midline. We have broken below the trendline support and currently finding it hard to close above.
EMAs have started to curl over but price has been so far supported by the lower EMA. If we can get above the upper EMA, we could retest the local highs and possibly make a run up to the supply zone. This dip could have been the pullback we needed to be ready to test higher.
Stops would be placed below this SFP to mitigate risk if you are long.
Thanks guys
SC HardFork on the 31-Oct-2018 (block 139,000). Pump incoming.SC short term pump is expected on the ~31-Oct-2018 due to hardfork at block 139.000. Possible targets are 160, 230..maybe more.
My advice: Do not enter just for the purpose of possible hardfork pumt&dump. Sia is a great project of decentralized data storage, so I suggest to buy as much as possible and HODL longterm. Sia is the real sleeping giant! The project is just in its initial stage and has a great team of people with very good vision who work very hard to fulfill it. The best would be if you do your own research regarding to Sia to make your own judgement. You can start here: sia.tech My personal opinion is that any decentralized cloud storage is needed in the future. I don't like how any 3rd party is overseeing my data.

SiaCoin, bullish patternSiacoin formed a Falling Wedge, this is a bullish-continuation pattern with an accumulation at the bottom and a rising volumen. Actually broke the accumulation zone, maybe we would see a retest on 105 sats. Target: 61% Fibonacci Extension or beyond.
Siacoin have a Hard Fork on 31 Oct. A good zone to buy and hold.

Siacoin... Jump to the next Fibonacci level.Siacoin may jump to the next Fibonacci level after finding a new
resistance. As you know this 2018 is being hard for all cryptos, but
let's keep working.
This is the goal for Siacoin this year: sia.tech

Siacoin remains a BUY!Siacoin has returned back into the demand zone after briefly hitting highs of 118. It also bounced off of the trendline support as it returned into this block so as long as we remain inside and not below this zone, we are still bullish SC.
The EMAs are a little concerning as they seem to be turning over and price returned below the fast-moving EMA after solidly trending above so a few days. We do have the pink EMA as another support level so we still don't have a reason to exit the trade but keep an eye on BTC. If BTC breaks below $6100, it could drag everything down with it especially altcoins who have had a nice run of late.
Thanks guys


break out. looking to move...see previous movement, to 618 fib. ( highlighted in green )
break out confirmed.
see dotted lines for targets. 1st - 220-230
100% ROI ! safe trading !!

There is a possibility for the beginning of an uptrend in SCBNBTechnical analysis:
. Siacoin/BinanceCoin is in a range bound and the beginning of uptrend is expected.
. The price is above the 21-Day WEMA which acts as a dynamic support.
. The RSI is at 66.
Trading suggestion:
. There is a possibility of temporary retracement to suggested support zone (0.000680 to 0.000610). if so, traders can set orders based on Price Action and expect to reach short-term targets.
Beginning of entry zone (0.000680)
Ending of entry zone (0.000610)
Entry signal:
Signal to enter the market occurs when the price comes to " Buy zone " then forms one of the reversal patterns, whether " Bullish Engulfing ", " Hammer " or " Valley " in other words,
NO entry signal when the price comes to the zone BUT after any of the reversal patterns is formed in the zone.
To learn more about " Entry signal " and the special version of our " Price Action " strategy FOLLOW our lessons:
Take Profits:
TP1= @ 0.000790
TP2= @ 0.000870
TP3= @ 0.001000
TP4= Free

A good entry for Siacoin - gains over 100% lurkingThe technical analysis uses multiple indicators.
Some Moving Averages that are commonly used.
Trendlines
Cycles
Waves
Fibonacci Retracement (1 was drawn over all prices + 1 was drawn from last downfall)
RSI
> RSI is not a strong indicator, buy - sell undecided
> The 3 trendlines going down that I drew were all broken to the up side. This is a good sign that bearish movement could be over.
> 2 cycles ago, the yellow dashed arrow indicates the time before the huge breakout. It is probably no coincidence that the red trendline was crossed in the current cycle and that after the same time (again yellow dashed arrow).
> The Moving Averages are lining up nicely. Strong indicator that price will move soon.
> Fib levels line up nicely around 225 - 230 satoshi. That's over 110% profit and that's only Target 1.
My believe is we'll head to Target 1 before the end of 2018.

Sia (SC) About To Swing From A Chandelier!Siacoin about to rocket (already has partly since we got in @ 99) due to Airdrop & Hard Fork on same day, being 31/10/2018.
MACD shows bullish signs.
20 EMA crossed over 50 EMA.
Airdrop and Hardfork.
If we get to 135 an inverse H & S will happen and either we go up or we go down as they all say on here lol. Up to 176 would be around the mark we are looking at max target range. When BTC hits it's straps later this week this will help us achieve the max target.
Flag on MACD is first target.
Good luck all!
HTBB

Siacoin Looks Like it Will Continue to Bang As noted by myself (author) numerous times, Siacoin is probably one of, if not the most manipulated cryptocurrency out of them all in the cryptosphere.
However, that does not mean that it does not represent some lucrative buying opportunities.
In this piece we’re going to attempt to dissect whether now is one of those buying opportunities.
Siacoin Price Analysis
So, let’s dissect the picture above for a second.
We can glean a few things from the image above:
1. The price of Siacoin is currently trading at a resistance.
2. The next overhead resistance for Siacoin is at roughly 125 sats, which is where that P/L box of 8.74% was drawn to.
3. There appears to have been a substantial increase in the price in the last few days/weeks.
Let’s check out what’s going on in terms of the price from a zoomed out view:
Since September 17th, 2018, the price has increased by 48.15%, pretty substantial.
We can also see that a strong uptrend has developed as well.
We also can notice what (potentially) may be a flat-top triangle formation
The general characteristics of a flat-top triangle pattern (or ascending triangle formation) are pretty easy to understand from just looking at the graphics.
Generally there is a resistance point that the price has continually failed to surpass whilst also posting a series of ‘higher lows’.
This is a bullish chart pattern formation, and in crypto, this pattern usually plays out to a certain extent.
If and when the pattern does play out, make sure that you always watch for the re-test.
Below is an example of what the re-test may look like:
However, before getting ahead of ourselves, it is important to see if there is an indication that the trend will continue on both the smaller time frames as well as the daily.
This will help us to confirm that the price may more than likely break out in due time.
Relative Strength Index(14) for SiaCoin
As one can see in the picture above, the RSI(14) has posted a very good performance on the H4 chart recently.
However, it is also closing in on the overbought region, which means that a potential drawdown before proceeding upward could be a possibility.
We’ll need more information before we can make such a conclusion though.
So, the next logical step will be to look at the 2-hour chart in order to see if that’s overbought. If that chart is reading that it is grossly overbought, then there’s a solid chance that there could be a drawdown in the price before it eventually rises again. Whether or not it will rise again is contingent on what we can see on the daily chart.
Yup, so as expected, the RSI(14) on the 2-hour chart is grossly overbought at this point in time, and the RSI(14) on the 4-hour is getting to that point as well.
So, an entry right now in the short-term may not be the best option for traders.
Now Let’s Check Out the Daily Resolution
As expected, the performance of the RSI is doing pretty well at the moment.
It is racing toward the overbought zone, but it is definitely not there as of yet, so there is no danger on the daily in terms of investing that we can detect specifically from the daily RSI(14).
We also have a ‘buy signal’ (the line is green; this is a custom RSI indicator), which tells us that buy signal initiated by the RSI(14) has been mostly confirmed at this point.
The flat-top triangle formation is still looking solid on the daily resolution as well.
Zerononcense Balance of Power RSI Indicator Readings for Siacoin
The beauty of this indicator is that it detects whether there is buying or selling occurring in the markets.
If the line is trending upward, that means that there is accumulation.
If the line is trending downward, that means that there’s distribution.
There is an RSI-like overlay on the chart as well, which gives us a sense of when the buy/sell pressure is beyond its normal limits.
The line turns red when it has detected an extreme in either accumulation or distribution. This indicator is useful because it renders a lot of divergence and it shows when individual on the protocol are either buying or selling.
Let’s check out the readings that we get here for Siacoin on the daily resolution.
So, in specific, what we can see on the chart is that there has been a large uptick in purchases of Siacoin since October 12th.
Let’s see where that point was on the regular chart:
The first to the last candle in the golden rectangle above represent October 12th-18th.
As we can see above, the price was trading sideways during this time period, but there was also substantial accumulation of Siacoin going on during that same period. Thus, the inherent value of this indicator has come to light once again.
As noted above when reviewing the Balance of Power RSI for Siacoin, it appears that the accumulation / buy pressure is still rising at a consistent rate, which gives the impression that the overhead resistance probably won’t be enough to send Siacoin’s price back down toward the ground.
Conclusion
For those that can’t wait for the price to calm down, here’s the R/R on this trade:
Waiting is generally advised, but operate to your heart’s content.
Disclaimer: Please note that this is not trading advice of any sort.

SC will cost 160 by the end of OctoberThis is the case when fundamentals and TA are working together. SC was moving sideways for very long and was ready to launch. Upcoming hardfork should trigger it.
The following major resitance zones can be considered as targets: 111 - 123 - 143 - 162. Zones! Not exact numbers =)
P.S. Better leave the coin before hardfork happen.


$SC #SCBTC Quick Trade - Elite Trading Group Hello guys,
this is a quick trade, nice set up, lowest dotted line as Stop Loss, overall looking pretty nice, probably having one nice increase over next few days/weeks.
Cheers, TJ

Siacoin is gearing up for a HUGE move! Siacoin has started moving off the bottom and the recent S/R flip zone is gearing up for potential massive gains ahead.
Between now and the end of the month, Siacoin announced the release of code version 1.3.6, which will ensure that only Nebulous subsidiary Obelisk ASICs can mine the network, effectively blocking crypto mining giants like Bitmain. As we have seen in the past, hard forks do provide volatility in price and we could expect to see a jump in price as Bitmain gets cut-off!
The hard-fork will be activated on Oct. 31 according to CoinDesk and it is currently setting up nicely. After seeing a few altcoins popping like crazy past few days, we could very likely see a spike up in Siacoin so something to keep your eyes on!
Thanks guys

siacoin to form a 250+ satoshi cup, just watch for the handle!!!siaocin about to hardfork could ramp up the satoshis on this already fucntioning coin.
a drive to 250+ sats will finish the forming cup but we must be prepared for an imminent dump before/during/after the fork??
the handle for top sellers will be very tempting as a rebuy price given this could do 600+ in the future.
fundamentals are there lets juts see if the market wants it...


