SC : does it is able to break out?Hi every one , as see you chart above , if it does able to be remain above red line it should be an bullish to 0.01550 area in one step and in two step im sure it would up to 0.023 area
We suppose is that btc stay above 46000 dollar
Siacoin

🆓Siacoin (SC) Mar-27 #SC $SC
SC has started an uptrend after breaking through the $0.01 zone. In April, SC may continue to rise to the $0.015 zone or even higher.
📈RED PLAN
♻️Condition : If 1-Day closes ABOVE 0.01$ zone
🔴Buy : 0.011 - 0.01
🔴Sell : 0.013 - 0.015 - 0.017
📉BLUE PLAN
♻️Condition : If 1-Day closes BELOW 0.01$ zone
🔵Sell : 0.01
🔵Buy : 0.009 - 0.0075
❓Details
📈Red Arrow : Main Direction as RED PLAN
📉Blue Arrow : Back-Up Direction as BLUE PLAN
🟩Green zone : Support zone as BUY section
🟥Red zone : Resistance zone as SELL section

We Are Still Bullish On Siacoin (SCUSDT)We haven't given up on Siacoin (SCUSDT), in fact, things are looking good as its price remain trading above EMA50, which is always great.
We have a strong RSI and MACD bullish as well.
The Siacoin vs Bitcoin (SCBTC) pair is looking good as well, great 'buy' price.
But we need to be patient... The bullish wave will be massive once it takes place.
Namaste.

Siacoin/Bitcoin historical buy pointThe longterm trendline will get tested and Williams % R gives us a heavy oversold status.
IMO a perfect point in time to enter Siacoin here.

SIA 18 bear market comparison to TRAC 22SIA 18 bear market comparison to TRAC 22
think i had the positioning wrong. have adjusted it here. looks very similar to me.
if this is right then we flat here for a bit and then one more deep dive.
rebound is 65%.. not even that good really.
i have left this trade. thought id do this for anyone who actually gave a shit about that last analysis and also to point out alt pain might not be over.
obviously this is a very odd type of analysis. wouldn't put too much weight on it.
gl

SC 2018 ; TRAC now - pt2 - closer lookSC 2018 ; TRAC now - pt2 - closer look
been following this idea to see where it leads. i wanted a better version where i didnt have to keep zooming in haha
we could be in for a sick pump here, then retest the lows before an even sicker pump
this is a very abstract idea. lets see how it goes.
gl

SCUSDT SIACOIN CHARTTrading Setup:
There is a Trading Signal to Buy in SCUSDT SIACOIN
Traders can open their Buy Trades NOW
⬆️Buy now 0.00875
⭕️SL: Close bellow 0.00718
🔵TP 0.01202
🔵Move SL in 0.01020
What are these signals based on?
Classical Technical Analysis
Price Action Candlesticks Fibonacci
RSI , Smoothed Ichimoku , Break of Trend

Siacoin Risky But Promising Chart Setup (144.4% Potential)This chart setup is looking good but a bit risky.
Risky because we are dealing with early signals.
We have a bearish cross between EMA21 and EMA50.
A bearish cross can lead to a short-term bounce (up) but a mid-term drop (down).
We are looking to profit from this bounce.
All the levels are clearly marked on the chart.
That is support and resistance (targets) levels.
This is not financial advice.
All the information I shared is for learning and/or entertainment purposes only.
Thank you for reading.
Namaste.

SC/EUR SIACOINSC/EUR symmetrical triangle wave pattern ???
Siacoin on the daily chart appears to be making a symmetrical triangle pattern, is it?

🆓Siacoin (SC) Feb-10 #SC $SC
.
📈RED PLAN
♻️Condition : If 1-Day closes ABOVE 0.01$ zone
🔴Buy : 0.011 - 0.01
🔴Sell : 0.013 - 0.016 - 0.02
📉BLUE PLAN
♻️Condition : If 1-Day closes BELOW 0.01$ zone
🔵Sell : 0.01
🔵Buy : 0.008 - 0.0065
❓Details
🚫Stoploss for Long : 10%
🚫Stoploss for Short : 5%
📈Red Arrow : Main Direction as RED PLAN
📉Blue Arrow : Back-Up Direction as BLUE PLAN
🟩Green zone : Support zone as BUY section
🟥Red zone : Resistance zone as SELL section

$SC SIACOIN projected targets to end cycle IISiacoin targets lower to complete large degree ABC correction to end cycle II before start of cycle III up.

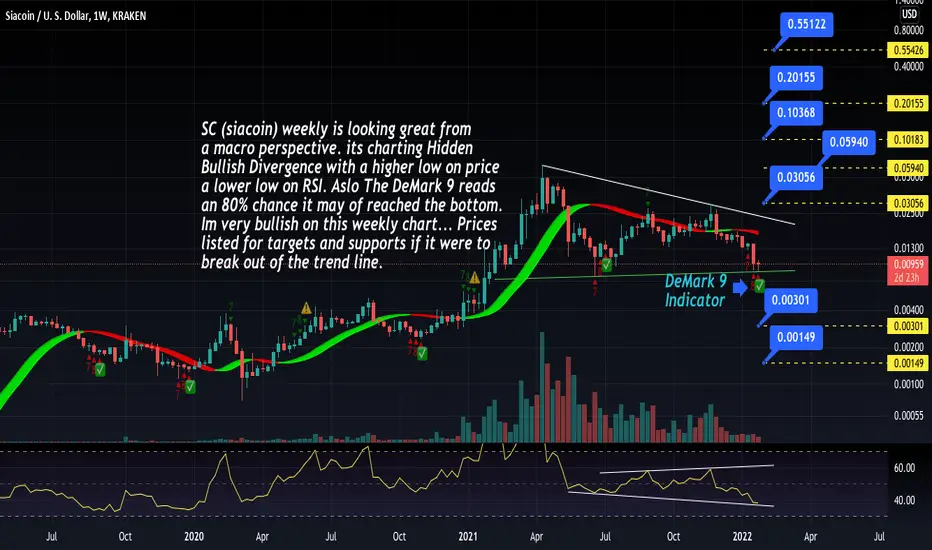
SC (siacoin) still looking bullish on the weeklySC (siacoin) weekly is looking great from
a macro perspective. its charting Hidden
Bullish Divergence with a higher low on price
a lower low on RSI. Aslo The DeMark 9 reads
an 80% chance it may of reached the bottom.
Im very bullish on this weekly chart... Prices
listed for targets and supports if it were to
break out of the trend line.

Siacoin (SC) formed bullish Shark for upto 224% big moveHi dear friends, hope you are well, and welcome to the new update on Siacoin (SC).
During the previous market crash of April to Jun 2021, SIA formed a big bullish BAT, which I shared as below:
The priceline moved close to the sell targets but move down back inside the buying zone. Therefore the above trade is still valid.
Now during the current drop, on a weekly time frame, SIA has formed a huge Shark move.

SC (siacoin) looking bullish on the weeklySC (siacoin) weekly is looking great from
a macro perspective. its charting Hidden
Bullish Divergence with a higher low on price
a lower low on RSI. Aslo The DeMark 9 reads
an 80% chance it may of reached the bottom.
Im very bullish on this weekly chart... Prices
listed for targets and supports if it were to
break out of the trend line.
$SC Siacoin bull run soon $SC is currently down 86% from its ATH. Looking past at Siacoin history it generally bottom out after retracing 80%+. The 4.236 fib of $SC has a target of $0.30 which is a 3500% from today current price at $0.009. Starting a spot long in $SC here

Siacoin (SC) is ready to breakout bearish pennant.Hi dear friends, hope you are well and welcome to the new trade setup of Siacoin ( SC )
Bearish Pennant:
On a daily time frame, Sia has reached at the end of a bearish pennant and the movement is squeezed. Therefore, at any time it can breakout or break down this pattern.
Testing Strong Support:
On a long-term weekly time frame, it is very clear that priceline is testing a support of $0.013, therefore there is a more possibility of breaking out the aforementioned pennant.
Note: Above idea is for educational purpose only. It is advised to diversify and strictly follow the stop loss, and don't get stuck with trade

SC/BTC will lead this market like 2017-2018 ..?#SC/BTC
#SC currently trading at 33 Satoshi
And Also holding good support at 30 Satoshi.
Entry:- 30-33 Satoshi
Targets:- 66/107/187/306 Satoshi
Stop Loss:- 27 Satoshi
Guys don’t forget to Placed Stop loss if you want to enter any trade.
Support:- 30 Satoshi
Resistance:- 66/107 Satoshi

SIACOIN - SIA/USDT On the Verge of BreakoutSiacoin can be a good buying opportunity looking for Breakout on 4H chart
Sia/usdt

Siacoin (SC) Is Getting Extremely OversoldHi friends, hope you are well, and welcome to the new update on Siacoin ( SC ).
Broke down a channel:
On a weekly time frame priceline of Sia was moving in a down channel but now it has left the channel and now moving below the support. But the Stochastic is oversold which is indicating that priceline may move here sideways and we can also expect a reversal move.
Broke out a wedge:
On a 4-hour, Sia has broken out a wedge. It is moving above very strong support of $0.014. This level has been working as a strong support and resistance previously as well.
Note: Above idea is for educational purpose only. It is advised to diversify and strictly follow the stop loss, and don't get stuck with trade

SIACOIN +1000% PUMP, SC SIACOIN PRICE PREDICTION 2022Siacoin price prediction using a simple price action. Fundamental analysis and Technical analysis are included. According to Bitcoin Gorilla, Siacoin SC price shows why Siacoin could see some surge demand in 2022.

The MOTHER of all Cup and Handles - SCUSD Log scale storyHi all,
Main TA Points;
***
1. Log scale chart.
2. Big cup and handle on monthly.
3. 20MA currently acting as support.
4. Break of Ichi looking imminent.
5. Incredible R:R
***
Talking Points;
***
Going to keep it simple,
Log scale is a fantastic tool to use over long term chart views as well as high volatility markets such as crypto.
SCUSD is painting an enormous cup and handle suggesting a price target of anywhere between $1 - $3.50.
There is a strong possibility that Web 3.0 will be the "meta" paradigm during the peak of the current bull run. Sia/Skynet is arguably the strongest offering in this space with Siacoin offering a significant investment opportunity with considerable upside.
These price estimates are also inline with SCBTC hitting its all time high of 800 satoshis. Should it do this with BTC hitting upwards of 100K we are definitely talking price targets in this range.
***
Estimates;
***
Log scale modifies your drawing tools and I'm having difficulty calculating the exact measured move. At this price entry however, liquidating a portion of holdings at 1 dollar would be a prudent strategy having banked significant profits.
I think targets should involve averaging out of the trade in this case given we are looking at a range of $1 - $3.50.
Good luck,
Please consider donating, following or leaving a comment if this analysis was valuable to you.
SIA donations;
807db3f1186dd2a5a40418200064b44a94bffb0e32fac9e713923088a7e3bb0886c2d0281374
***
***
Any trading advice provided has been prepared without taking into account your objectives, financial situation or needs. Before acting on the information provided you should consider the appropriateness of the information, having regard to your objectives, financial situation and needs. You should seek professional personal financial advice before making any financial or investment decisions.
All investment and trade decisions, no matter how well investigated, involve risk.

SCUSDT - Trend BreakoutSCUSDT (4h Chart) Technical analysis
SCUSDT (4h Chart) Currently trading at $0.0161
Buy level :Above $0.0158
Stop loss: Below $0.0142
TP1: $0.0169
TP2: $0.0184
TP3: $0.0201
TP4: $0.0217
Max Leverage 3x
Always keep Stop loss
Follow Our Tradingview Account for More Technical Analysis Updates, | Like, Share and Comment Your thoughts.

Siacoin Trying To Go Bullish (140% Target)Siacoin (SCBTC) is trying to go bullish as you can see from the higher lows since June.
Resistance is being faced right now at 33 satoshis (0.00000033) or EMA10, followed by EMA21 and EMA50/100 (34 & 35 satoshis).
Finally, MA200 at 0.00000037 is the final barrier.
All these levels need to be conquered for a higher high to show up (orange arrow).
We are aiming at 140% as our bullish target.
We have 26-27 satoshis as the main lower support.
Additional details can be found on the chart.
Namaste.
