BTC At this time is shaking out weak handAll the feat is all over markets. Stock, Gold, Crypto is all down. Situation like this It will be chop up and down and shake out weak hand investors. At this point be careful and manage your risk carefully. It possible to move in the zone for maybe 5-10 days until bull come back.
Sideways


MKR/USD 4h No Idea What will happen but looks bullishI see a triangle on the MKRUSD chart and strong support but no signs right now for a break through.
What are your thoughts on this?

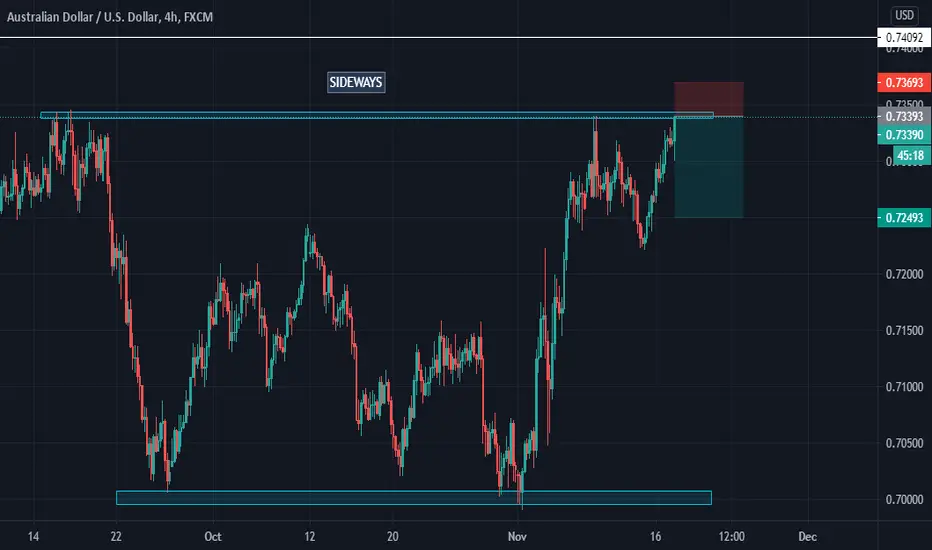
AUDUSD H4 sideways shocks.AUDUSD H4 sideways shocks.
After falling back from the high of 0.7820 on January 6, the AUDUSD rebounded after reaching low 0.7563 yesterday (February 3). The current price is still above the 0.7600 integer.
Since the mid-term ascending channel (dotted line) has been broken, and the MA60 is about to “death cross” the MA200, the chance of rising in the short and medium term has been reduced, and there are already multiple resistance prices above. The larger chance in the future is sideways shocks.
It is recommended to do a trading strategy of buying low and selling high within the interval shown in the box.
Shock Range: 0.7570-0.7750
Update: Feb.4th 2021
Reliability: 5-10 Market Days

GBPUSD GU is moving sideways, so I'm waiting for a break either to the upside or down. Overall trend is bullish.

Bitcoin My ViewMy view is that bitcoin is in parallel channel right now which means nearly sideways.

Short to mid term BTC playLooking at the I have a fib extension from the top of the 2017 ATH (20K) and if you look it has played these Fib extension levels like a champ!
Currently I am seeing lower highs and lower lowers forming from its prior 42K top I could see BTC pump up to the 35K range and ideally get rejected form the downward trend line which might be a good potential for a short term short.
Target downward to the 1.38 fib or 27,500.
If BTC breaks above and holds above the 35K area then the trend pattern has changed.
If BTC post a HIGHER LOW IE 29K or higher then the pattern has changes.
This could be the range of sideways trading that we have been waiting for for the first alt season to take place till is coils to the end of the triangle.
Lets see what happens and best of luck!

Btc may just sideways and dump with very little upsideso here is the thing. we are right at where our weekly pivot point it coming it. its possible btc plays out down or up before thie daily/weekly close then either way reverts back to that purple line. I think corretions is just some time away. if you wanted to long try to do it on developing camarilla L3 for daily or weekly around close. If you want short do the same for H3. I do not see a lot good risk reward selling at these current prices. I will say be patient. dont front run anything here. most alts even still hve lower to got to meet their new weekly pivots. and btc going either direction now (unless huge direction) will be only a waste of time.

Bitcoin goes sideways, do NO panic! Let's wait for the big move!Hello traders! I can see in the chats that people are panicking that the bears have taken over Bitcoin and we will have a crash to 20k, 10k, 5k, and so on. DO NOT LISTEN TO THOSE TRADERS. There is no need to panic because we are in a sideways symmetric triangle.
Price seems to have lower highs but also have higher lows. We can also see in the chart that the volume is slowly decreasing. This means that the trend range is compressing into a quiet sideways movement. Unlike the Alts(cryptos other than Bitcoin)which are going crazy in either direction, Bitcoin just seems... quiet.
The ATR, or Average True Range, which visualizes volatility, has been decreasing, suggesting that every candle is quieter than the last one.
But like a compressed spring being released, Bitcoin will definitely have a breakout... in either direction. The bulls or the bears will win. Let's wait for a breakout in any way. Good luck!
REMINDER: DO NOT PANIC! DO NOT LISTEN TO SPECULATORS! It will not help you in trading. We're supposed to make money, right?
Thanks for reading! Do not forget to like and follow for more insights. Also read my educational post, Why a small stop loss will hurt you. Cheers!

EXCL masih sideways?Trend bearish ditandai dengan Hanging Man lalu dilanjutkan dengan 3 CS bearish. Pada closing hari Jumat, tidak berhasil menunjukkan adanya reversal pattern. Namun EXCL masih ada di support fibo 23.6, jadi apakah masih akan sideways beberapa hari?
NB: analisis murni dari teknikal sederhana, belum dari berita beredar

The altcoin season is about to begin!In fact, the party has started
You can see this by looking at the BTC.D and OTHERS indices
Bitcoin dominance is declining and altcoins are growing rapidly
I think the bitcoin market will move sideway after a slight increase
Sincerely
B Rivera


Short term trend indicates consolidation within a wedge BTCUSDif price action does not close above $19,400 we may see a long term trend downwards towards major supports all the way down at $6000.
I


Will NIO touch the 50% fib retrace?NIO is having some consolidation, and it is more due to the massive growth in the EV market and investors cashing in unrealized profits before the end of the year, NIO is being sold with the rest.
IMO the consolation is limited, there is too much interest in this company, accumulation is taking place, so I see 2 scenarios, the first is a sideways move for couple weeks and the other is a deeper retracement to the 50% FIB from its latest impulse, that would put the stock low at perhaps 39ish, however NIO has proved to be a lot more resilient that expected.
I also see a return in growth for the whole EV market in Q121, the race will go on.

GAPersonally with GA I really won't trade if unless i see a clear setup
because for now price is kinda stuck in a range
and its moving sideways wit a lot of fakeouts
unless price start showing movement of an uptrend or downtren
im gonna stay away with it


Ripple after waveyes it is. the journey is still long way to go.
there are resistance above.
if there newcomers coming in or have more volume,
then it can passed.
if no fomo, new comers coming in, going for sideways
if not, here is the nearest pull back
Current price.
rank 3
$0.646067 USD (40.60%)
0.00003444 BTC (39.42%)

Short setup of AUDCHF at 0.6715-0.6750 with high RR ratio Technical Analysis:
On the Weekly chart, the pair has been sideways for a while, sell at the top would give me a low risk trade with high reward.
entry 0.6715
stop 0.6750,
target 1 is 1.5 of stop loss, target 2 is 0.6450.
In addition, the downtrend line in cyan blue colour would give more odds on my side.
Basically, it’s a nice structure to place this trade. However, if I got stopped out. I will look for long setups for the pullback.
Plan your trade and trade your plan. Before we pull the trigger, we must know the possible scenarios. Don't focus on the money, instead focus on your trading process. The money will come into your pocket.

Side Way #LINKUSDT We have #Resistance on level 0.618 fibonacci & up trend line too. if this level be broken the price will increase to ~16.66. otherwise if market line falls down & reach to level 0.236 & down trend line & breaks it out, the price will reach to ~10
_________
Indicator: Fib Retracement & Trend Lines
Position: #LINKUSDT
Market: Condition: Side Way
Time Frame: 1D
Timezone: UTC+3:30(Tehran-Iran)

SELL THE TOP - SHORT THE RALLIESHere we have a great opportunity to sell a high from a sideways market.
It has very good risk to reward and you can extend the target if the market breaks it.
Your profits can go up to 300+ pips ( Length of the sideways channel ).